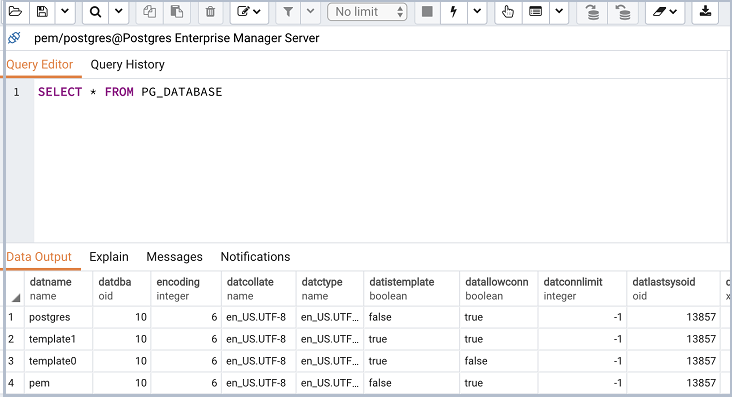
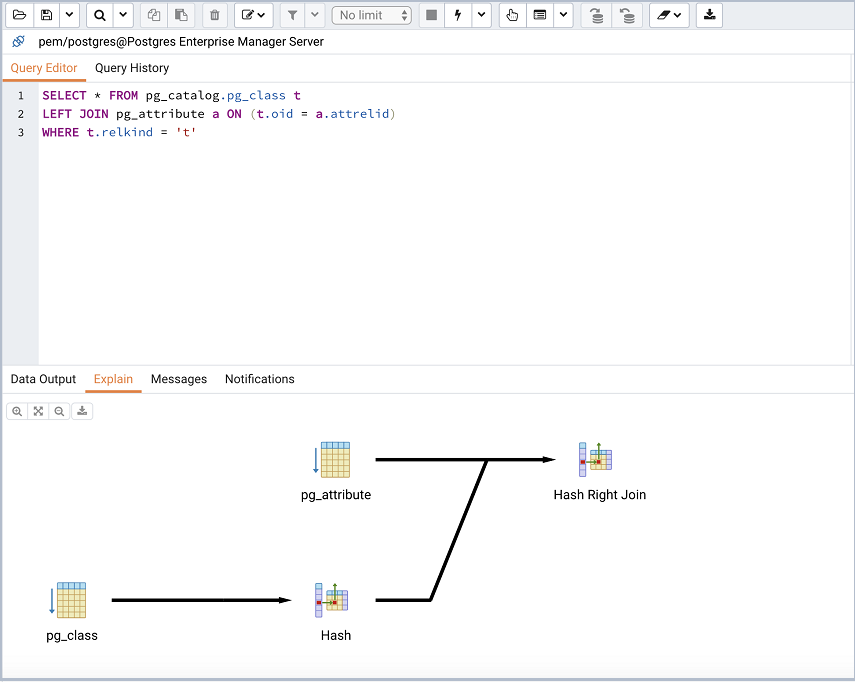
The Query Tool dialog provides an interface that allows you to manually enter SQL queries, graphically execute and interpret SQL statements,
EXPLAIN queries and much more (see Figure 2.0).
The upper panel of the Query Tool contains the SQL Editor. You can use the panel to manually enter a query, or read the query from a file. If you are manually entering a SQL query, the edit entry window also contains autocompletion code and formatting features that help you write queries.
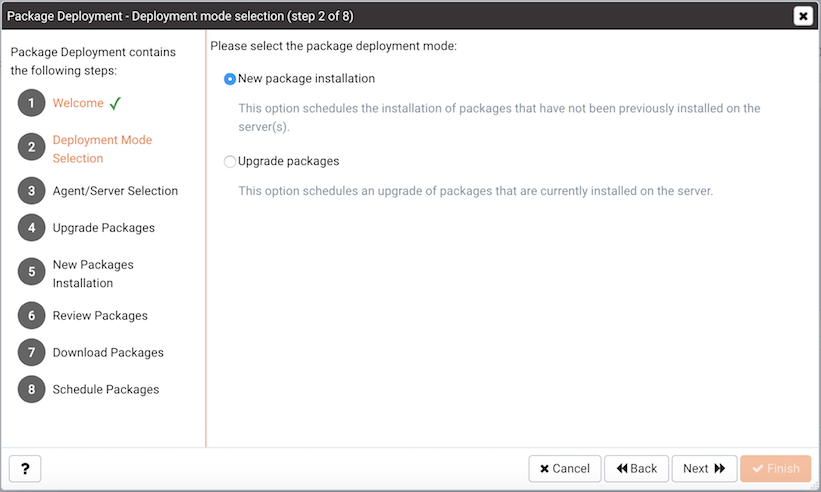
If you select New Package Installation on the
Deployment Mode Selection dialog, the Package Deployment wizard opens the
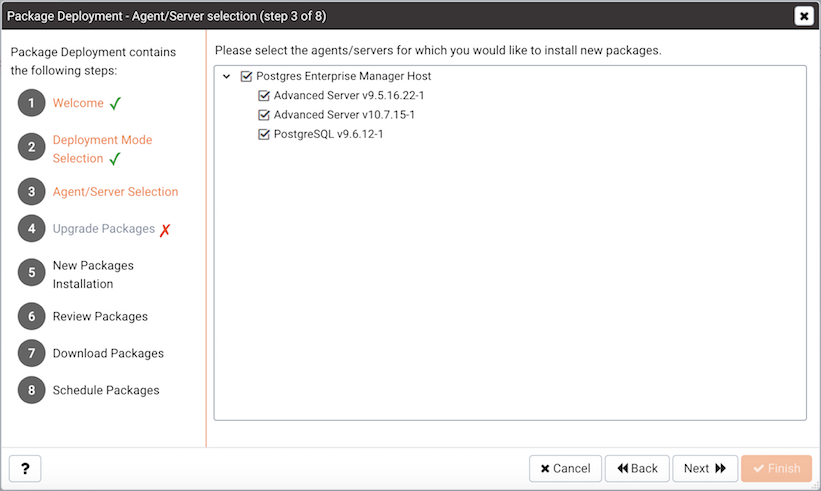
Agent/
Server Selection dialog (see Figure 3.3), allowing you to specify the agents and servers on which the new applications will be installed.
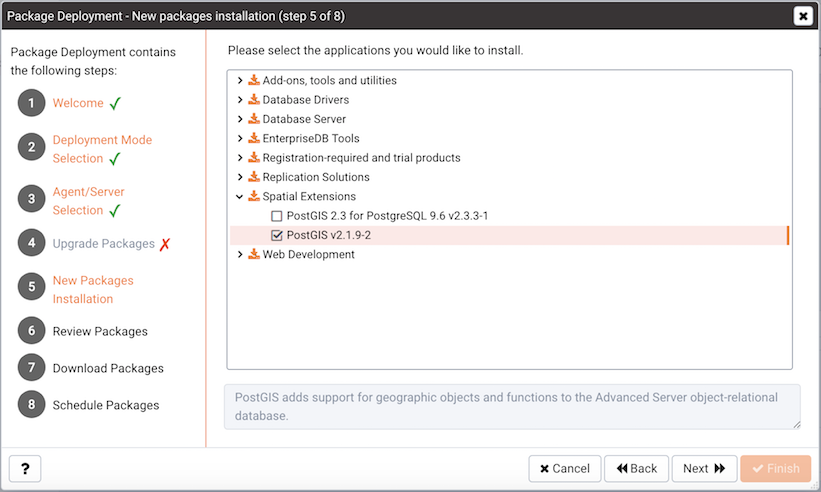
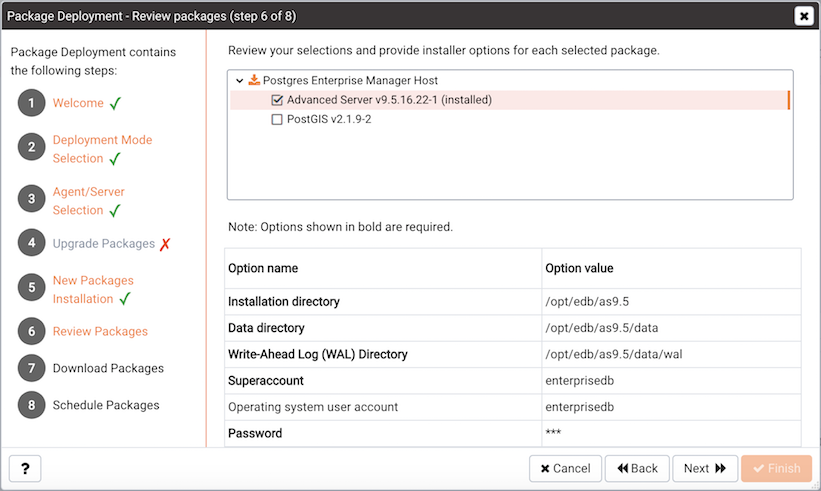
The New Packages Installation dialog opens (see Figure 3.4).
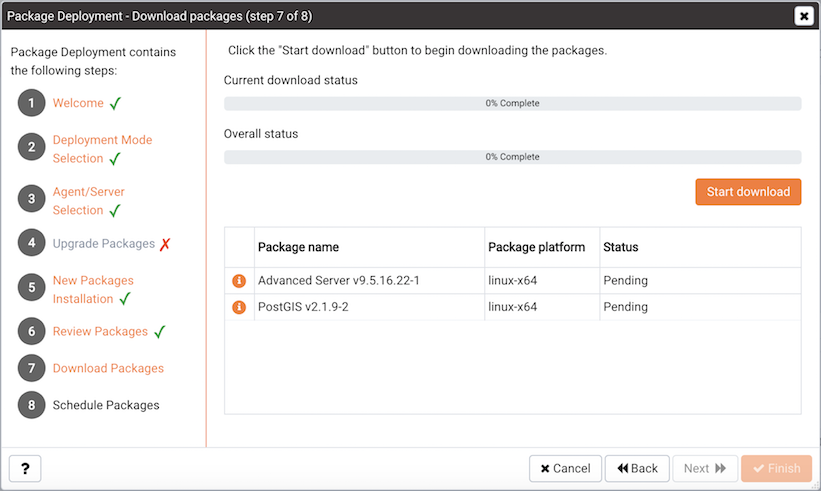
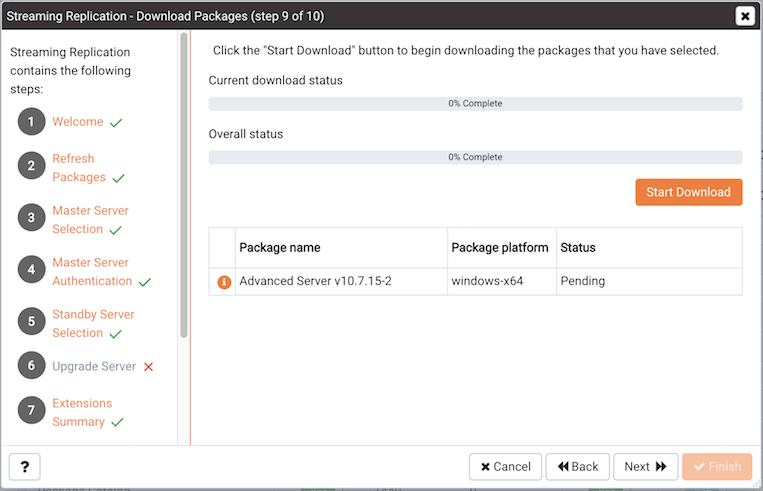
Click the Start Download button on the Download Packages dialog to instruct the Package Deployment wizard to download application installers (see Figure 3.6). During the download, you can click the
Cancel Download button to abort the batch download. When the download completes, click
Next.
|
•
|
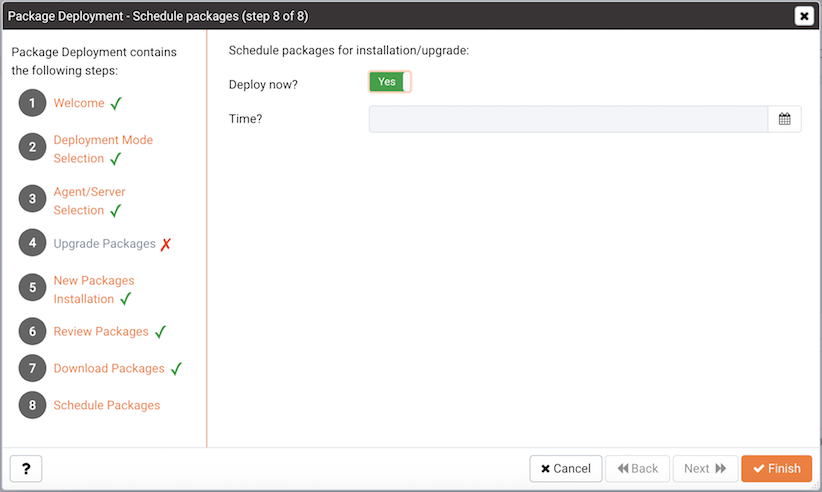
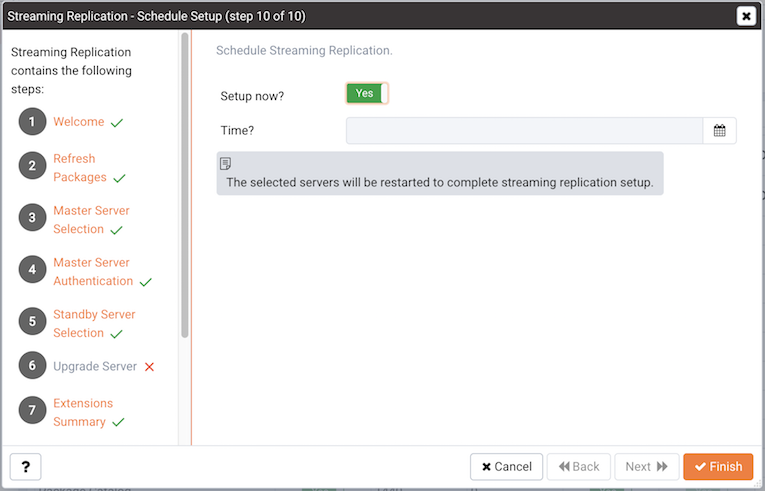
Set the slider next to Deploy Now to Yes to instruct the respective PEM agents to install the downloaded packages immediately. Please note that if a package requires a server restart, current user sessions may be interrupted.
|
|
•
|
Set the slider next to Deploy Now to No and use the Time selector to specify a later date and time that you would like the package installation to begin.
|
Click Finish to install the downloaded packages or schedule the installation and exit the package deployment wizard.
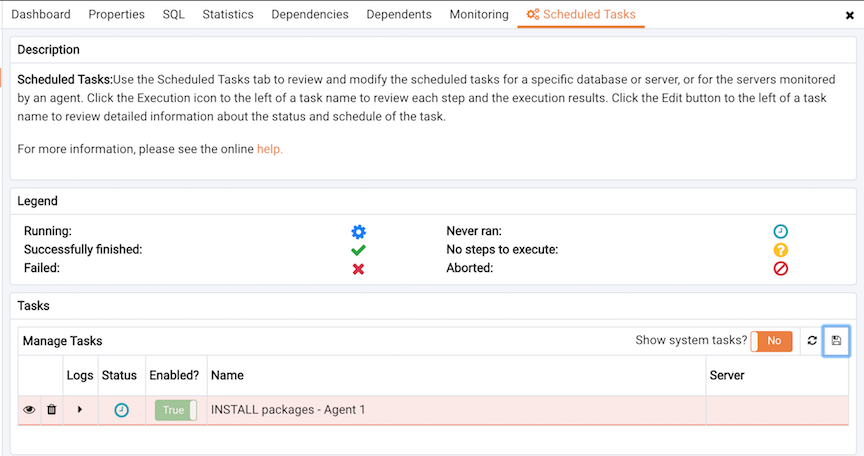
The Scheduled Tasks tab (see Figure 3.8) features a legend, displaying the icons that identify the status of each task. The
Manage Tasks table displays a list of tasks that are pending execution or recently completed.
Set Show system tasks? to
Yes to display system tasks; if it is set to
No, only user-defined tasks are displayed. System tasks are displayed with a grey background, and may not be modified.
|
•
|
Use the Steps drop-down to view a list of the steps performed during the selected task.
|
|
•
|
The Status field lists the status of the current task.
|
|
•
|
The Enabled? switch displays Yes if the task is enabled; No if the task is disabled.
|
|
•
|
The Name field displays the name of the task.
|
|
•
|
The Agent field displays the name of the agent responsible for executing the task.
|
|
•
|
The Last run field displays the date and time of the last execution of the task.
|
|
•
|
The Next run field displays the date and time of the next scheduled execution of the task.
|
|
•
|
The Created field displays the date and time that the task was defined.
|
To remove a task, click the Delete icon located to the left of a task's name. The task will be marked for deletion, and removed when the tab refreshes.
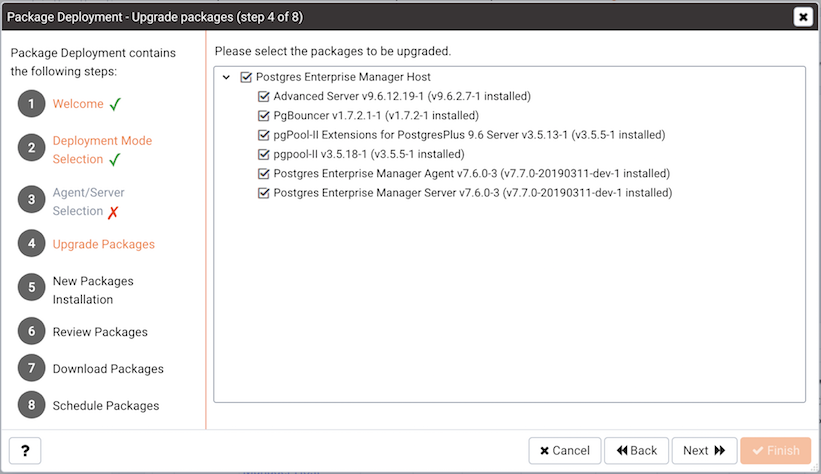
If you select Upgrade Packages on the
Deployment Mode Selection dialog, the Package Deployment wizard opens a dialog that allows you to specify which agents and packages will be updated.
Click the Start Download button to instruct the Package Deployment wizard to download application installers (see Figure 3.11). During the download, you can click the
Cancel Download button to abort the batch download. When the download completes, click
Next.
|
•
|
Set the slider next to Deploy Now to Yes to instruct the respective PEM agents to install the downloaded packages immediately. Please note that if a package requires a server restart, current user sessions may be interrupted.
|
|
•
|
Set the slider next to Deploy Now to No and use the Time selector to specify a later date and time that you would like the package installation to begin.
|
Click Finish to install the downloaded packages or schedule the installation and exit the package deployment wizard. If you have scheduled the update for a later date/time, the scheduled task will be included on the
Scheduled Tasks dialog (accessed through the
Scheduled Tasks... menu selection on the agent's context menu).
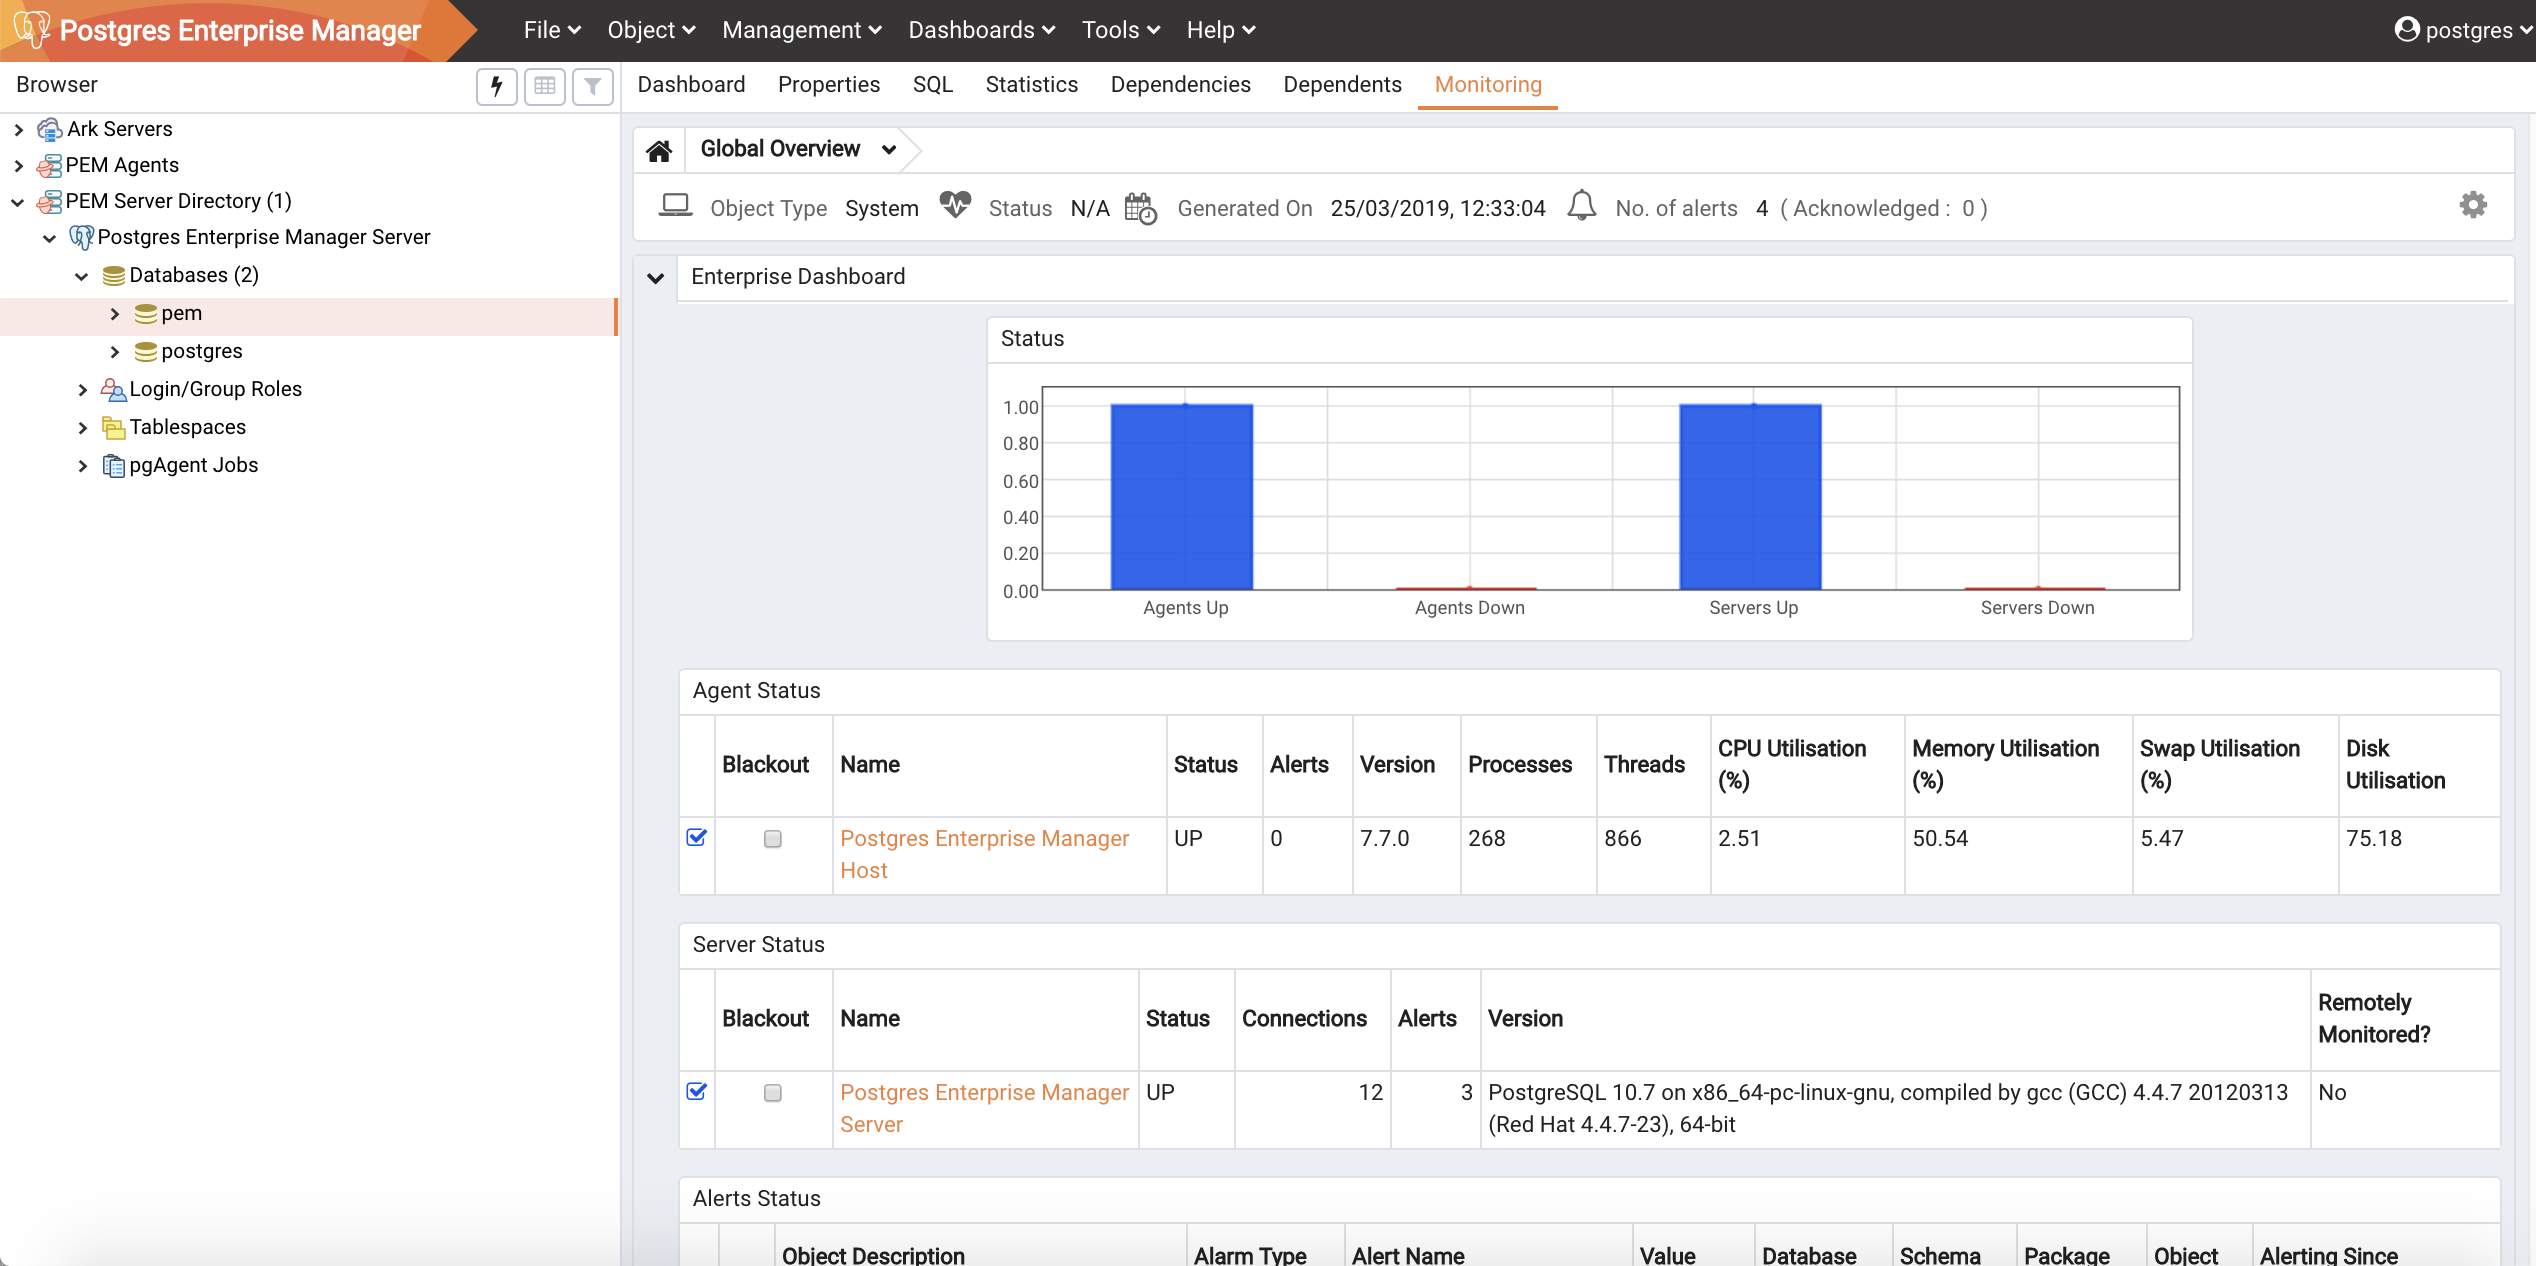
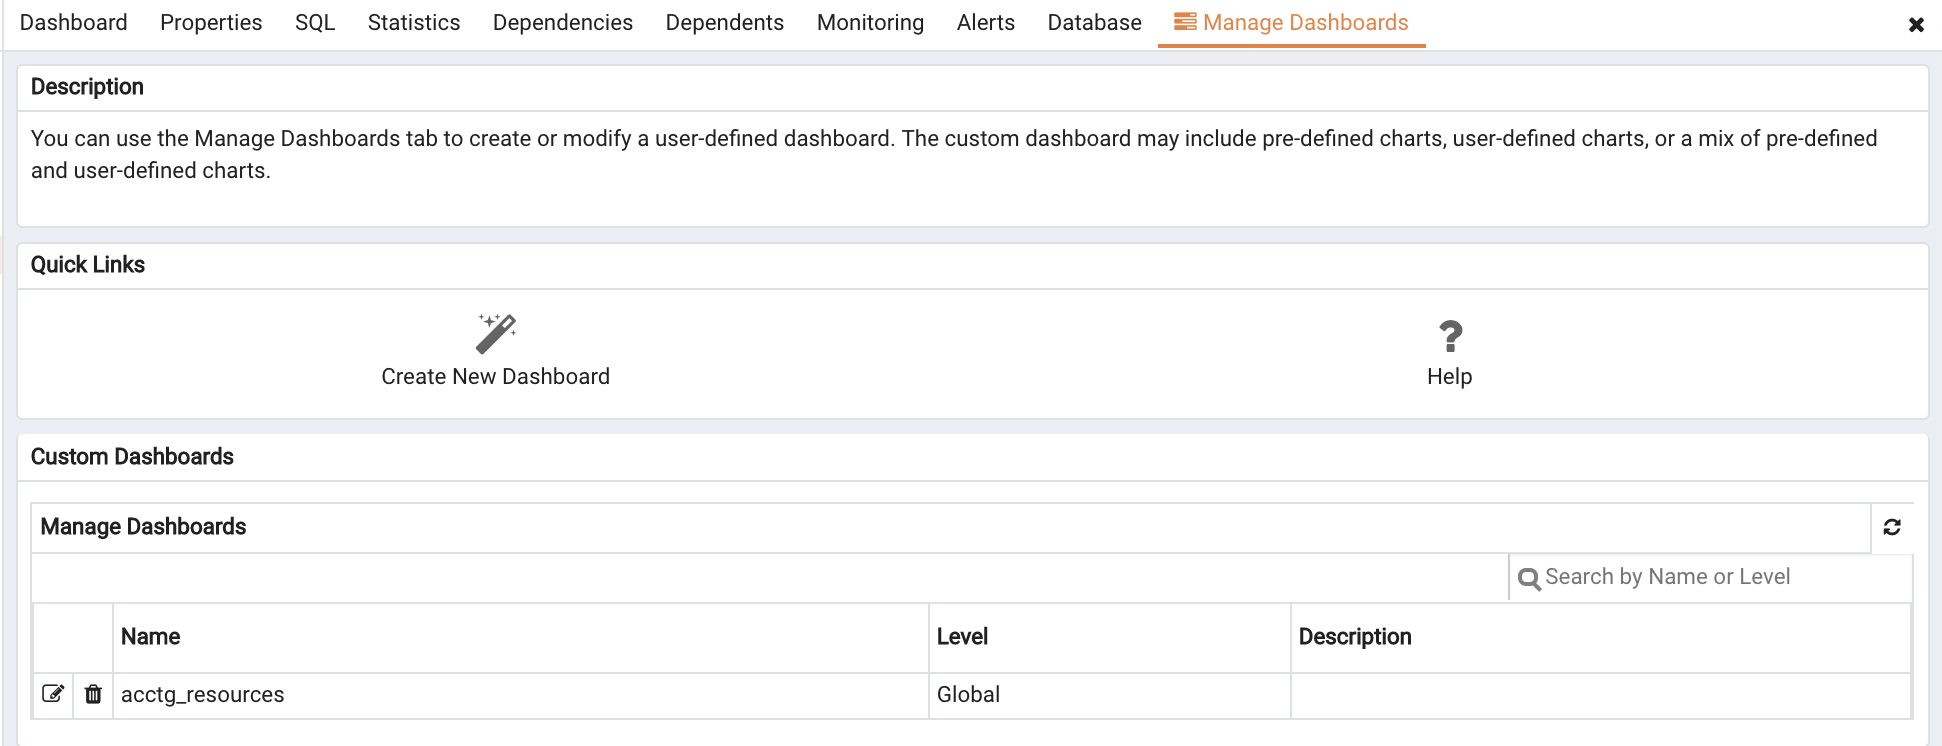
The top-level dashboard is the Global Overview (shown in Figure 4.1). The
Global Overview presents a status summary of all the servers and agents that are being monitored by the PEM server, a list of the monitored servers, and the state of any currently triggered alerts. The PEM client displays the
Global Overview when it connects to the PEM server. Other dashboards provide statistical information about monitored objects. These include the:
The Alerts dashboard displays the currently triggered alerts. If opened from the
Global Overview, the dashboard displays the current alerts for all monitored nodes on the system; if opened from a node within a server, the report will reflect alerts related to that node, and all monitored objects that reside below that object in the tree control.
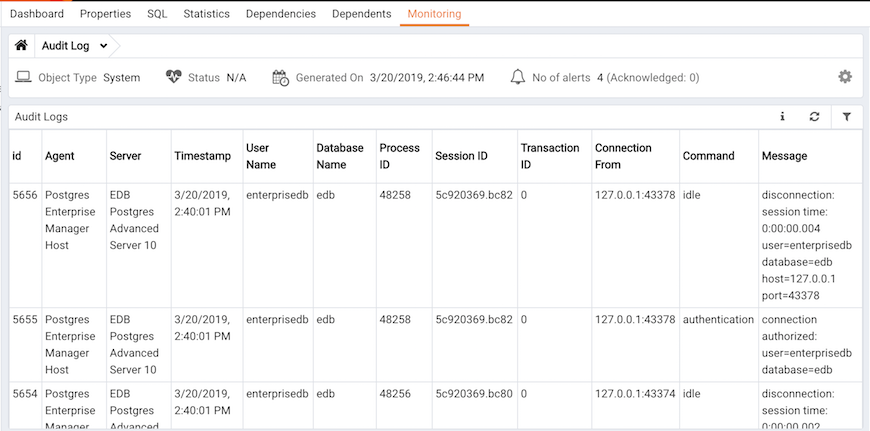
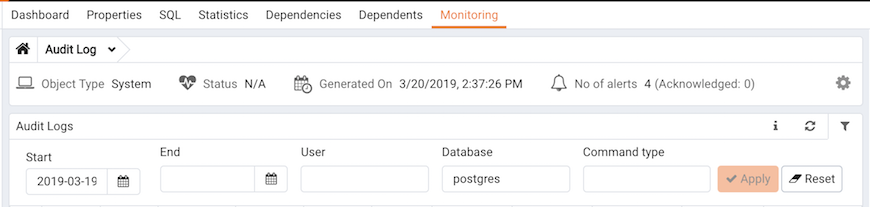
For Advanced Server users, the Audit Log Analysis dashboard allows you to browse the audit logs that have been collected from instances that have audit logging and collection enabled.
The Database Analysis dashboard displays performance statistics for the selected database.
The I/O Analysis dashboard displays I/O activity across various areas such as object DML activity, log operations and more.
The Memory Analysis dashboard supplies statistics concerning various memory-related metrics for the Postgres server.
The Object Activity Analysis dashboard provides performance details on tables/indexes of a selected database.
The Operating System Analysis dashboard supplies information regarding the performance of the underlying machine’s operating system.
The Probe Log Analysis dashboard displays any error messages returned by a PEM agent.
The Server Analysis dashboard provides general performance information about the overall operations of a selected Postgres server.
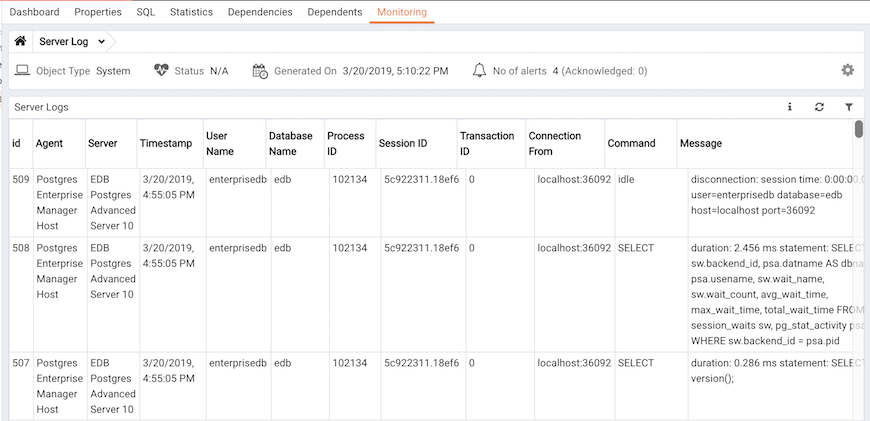
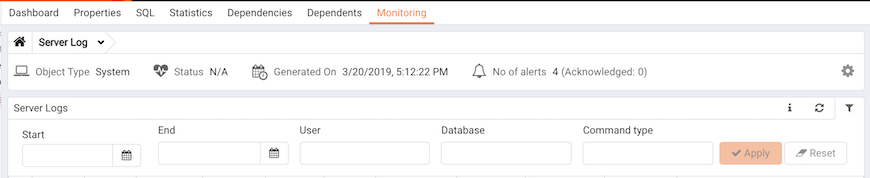
The Server Log Analysis dashboard allows you to filter and review the contents of server logs that are stored on the PEM server.
The Session Activity Analysis dashboard provides information about the session workload and lock activity for the selected server
The Session Waits Analysis dashboard provides an overview of the current DRITA wait events for an Advanced Server session.
The Storage Analysis dashboard displays space-related metrics for tablespaces and objects.
The System Waits Analysis dashboard displays a graphical analysis of system wait information for an Advanced Server session.
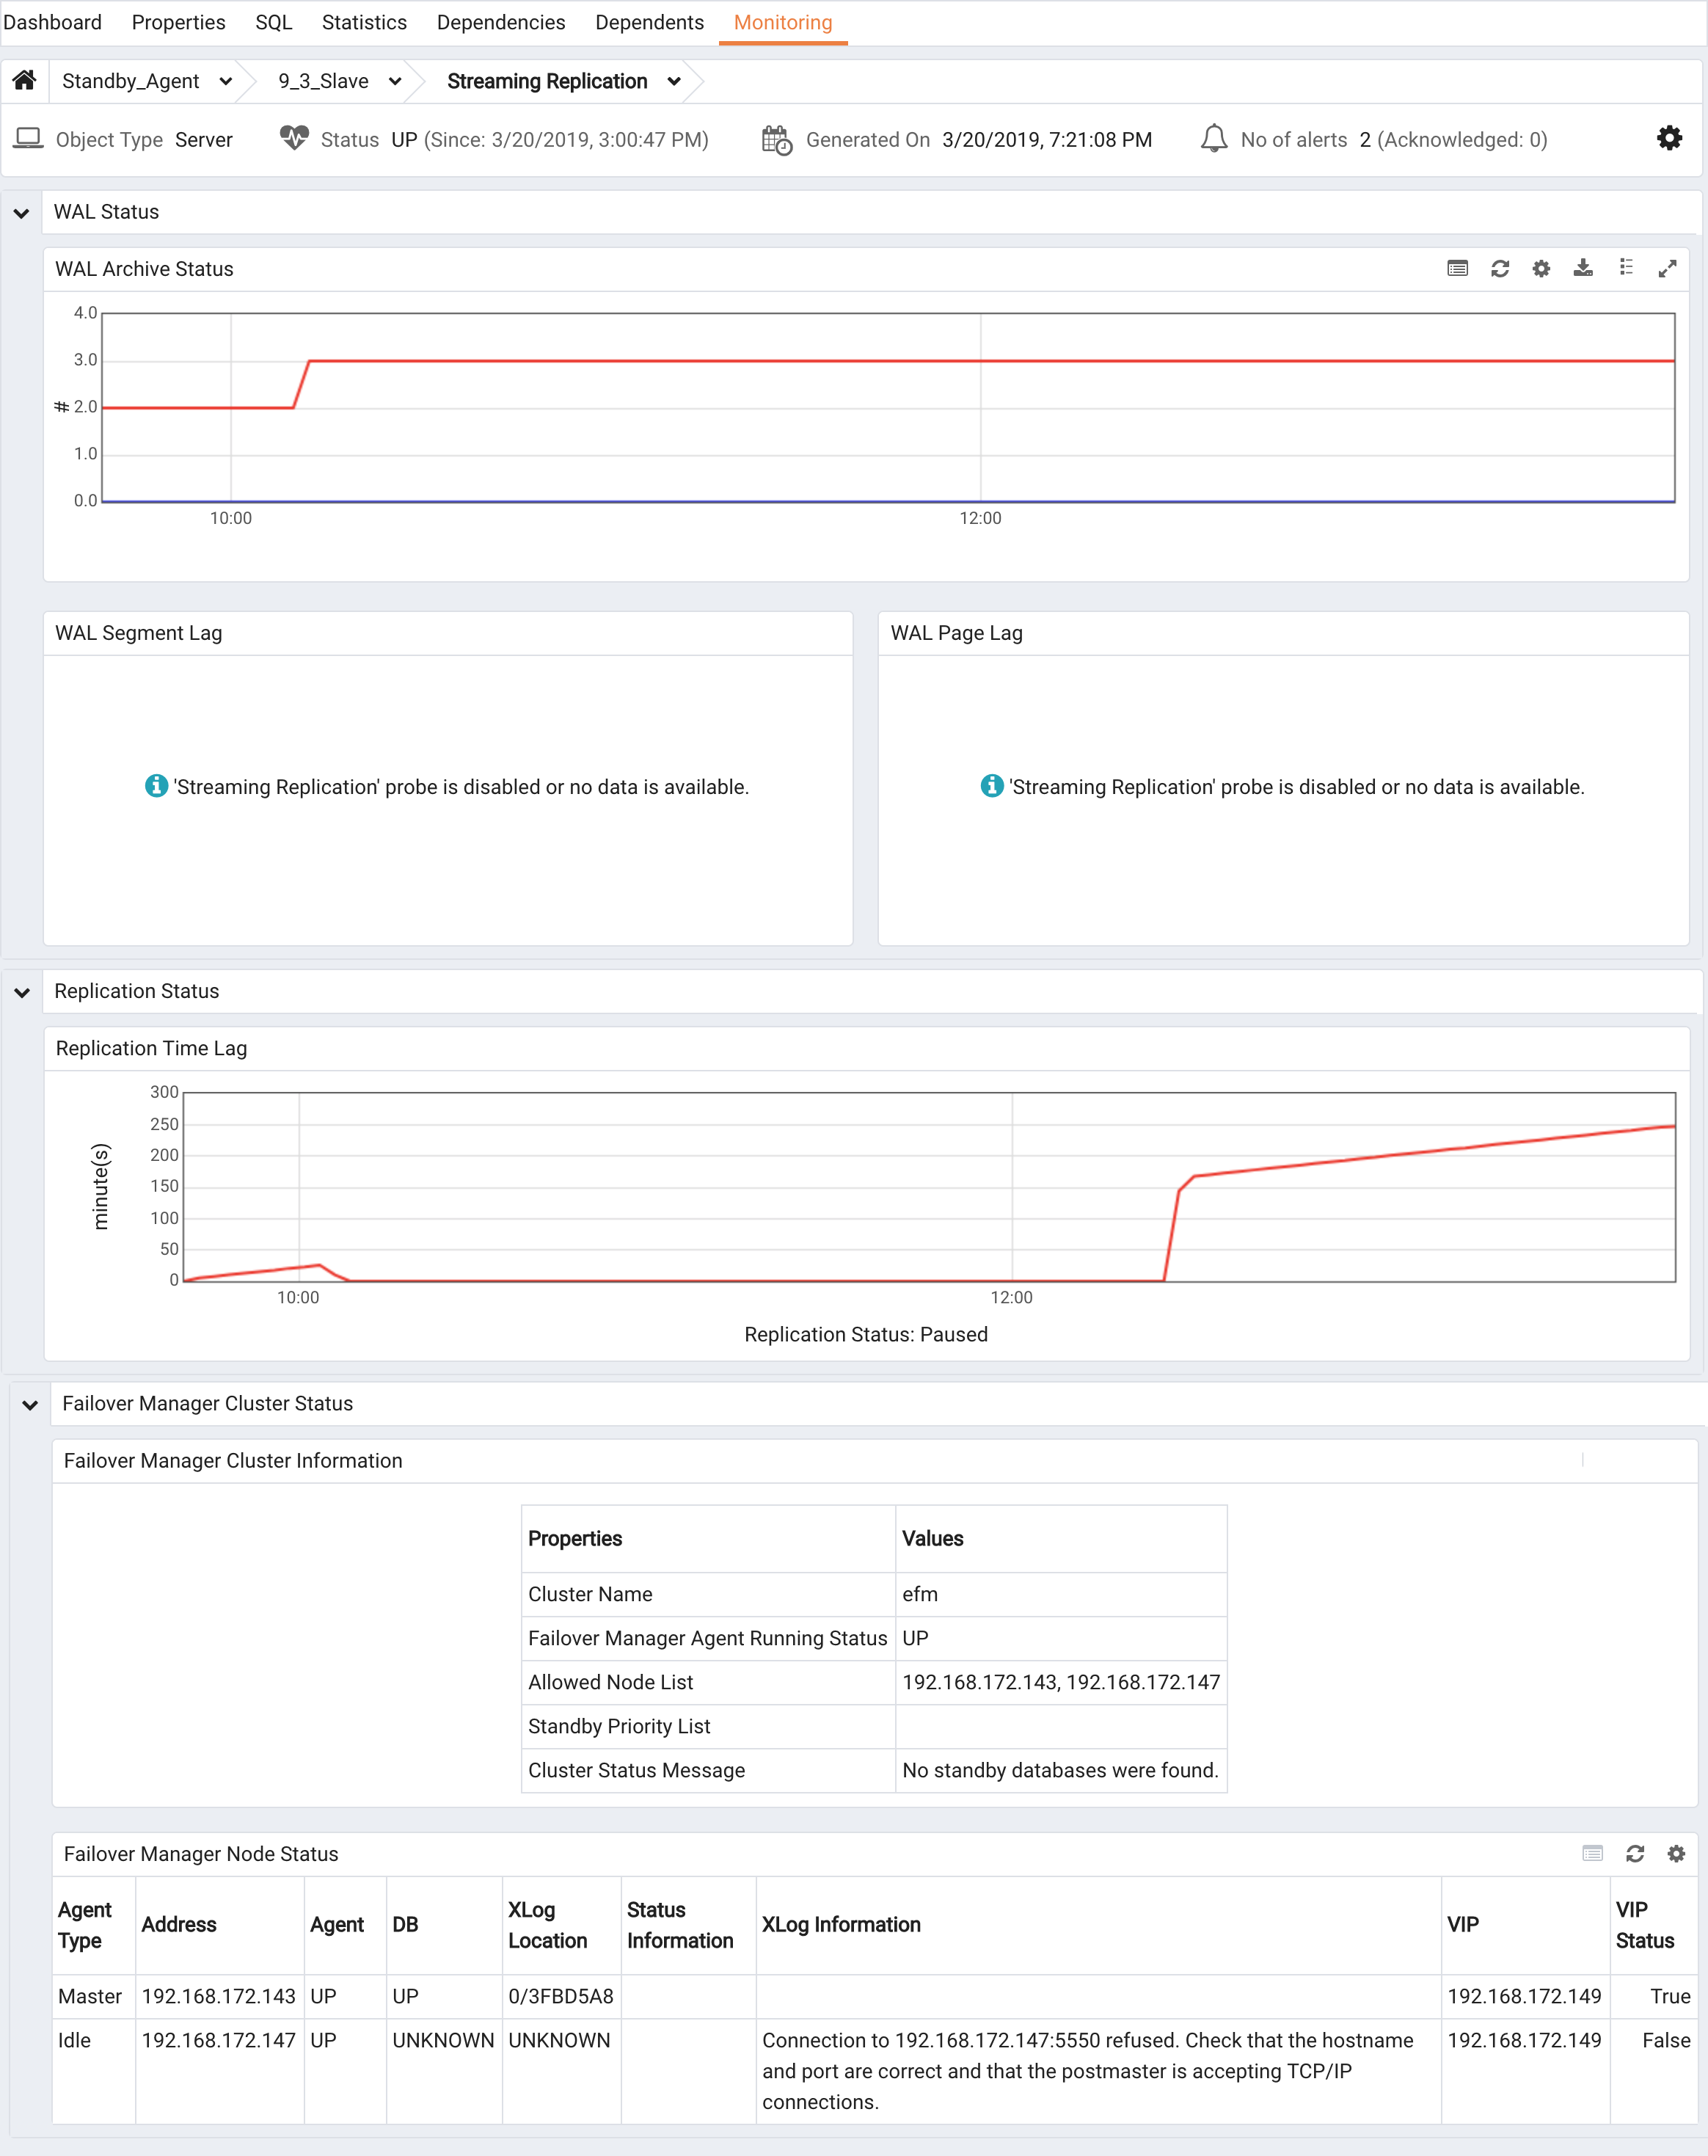
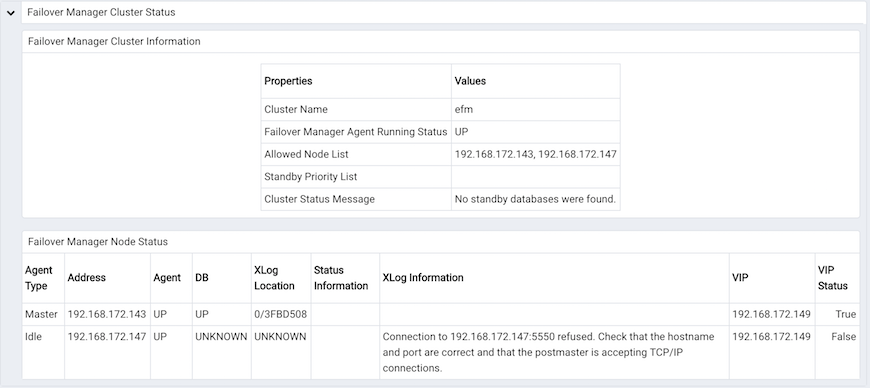
The Streaming Replication Analysis dashboard displays statistical information about WAL activity for a monitored server and allows you to monitor the status of Failover Manager clusters.
|
•
|
Right click on the name of a monitored object in the tree control and select the name of the dashboard you would like to review from the Dashboards menu.
|
Each dashboard is displayed on the Monitoring tab in the main panel of the client window. After opening a dashboard, you can navigate to other dashboards within the same tab.
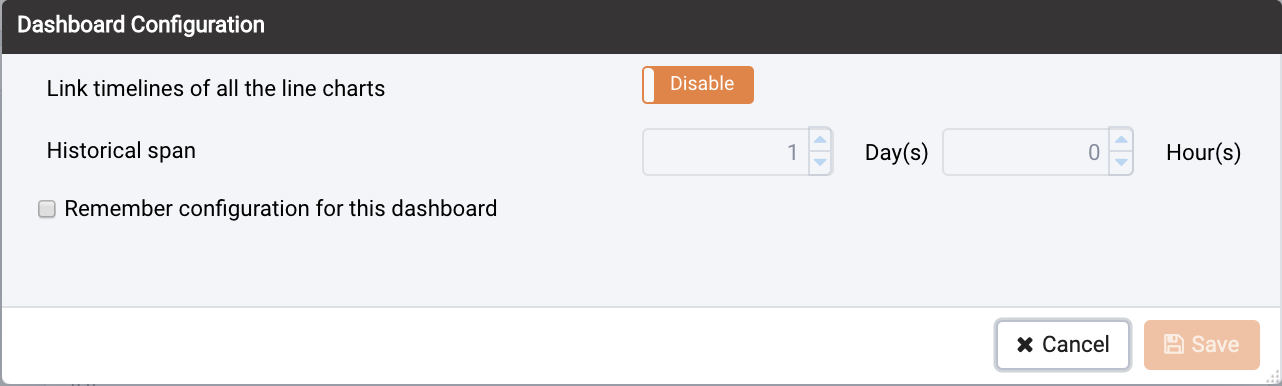
Options on the Dashboard Configuration dialog allow you to link the time lines of all of the line graphs on the dashboard. To open the
Dashboard Configuration dialog (see Figure 4.2), click the Settings icon displayed in the dashboard header.
|
•
|
Set the Link timelines of all the line charts slider to Enable to indicate that the specified timeline should be applied to line graphs displayed on the dashboard; if set to Disable, your preferences will be preserved for later use, but will not modify the amount of data displayed.
|
|
•
|
Use the Days selector to specify the number of days of gathered data that should be displayed on line graphs.
|
|
•
|
Use the Hour(s) selector to specify the number of hours of gathered data that should be displayed on line graphs.
|
|
•
|
Check the box next to Remember configuration for this dashboard to indicate that the customized time span should be applied to the current dashboard only; if left unchecked, the time span will be applied globally to line graphs on all dashboards.
|
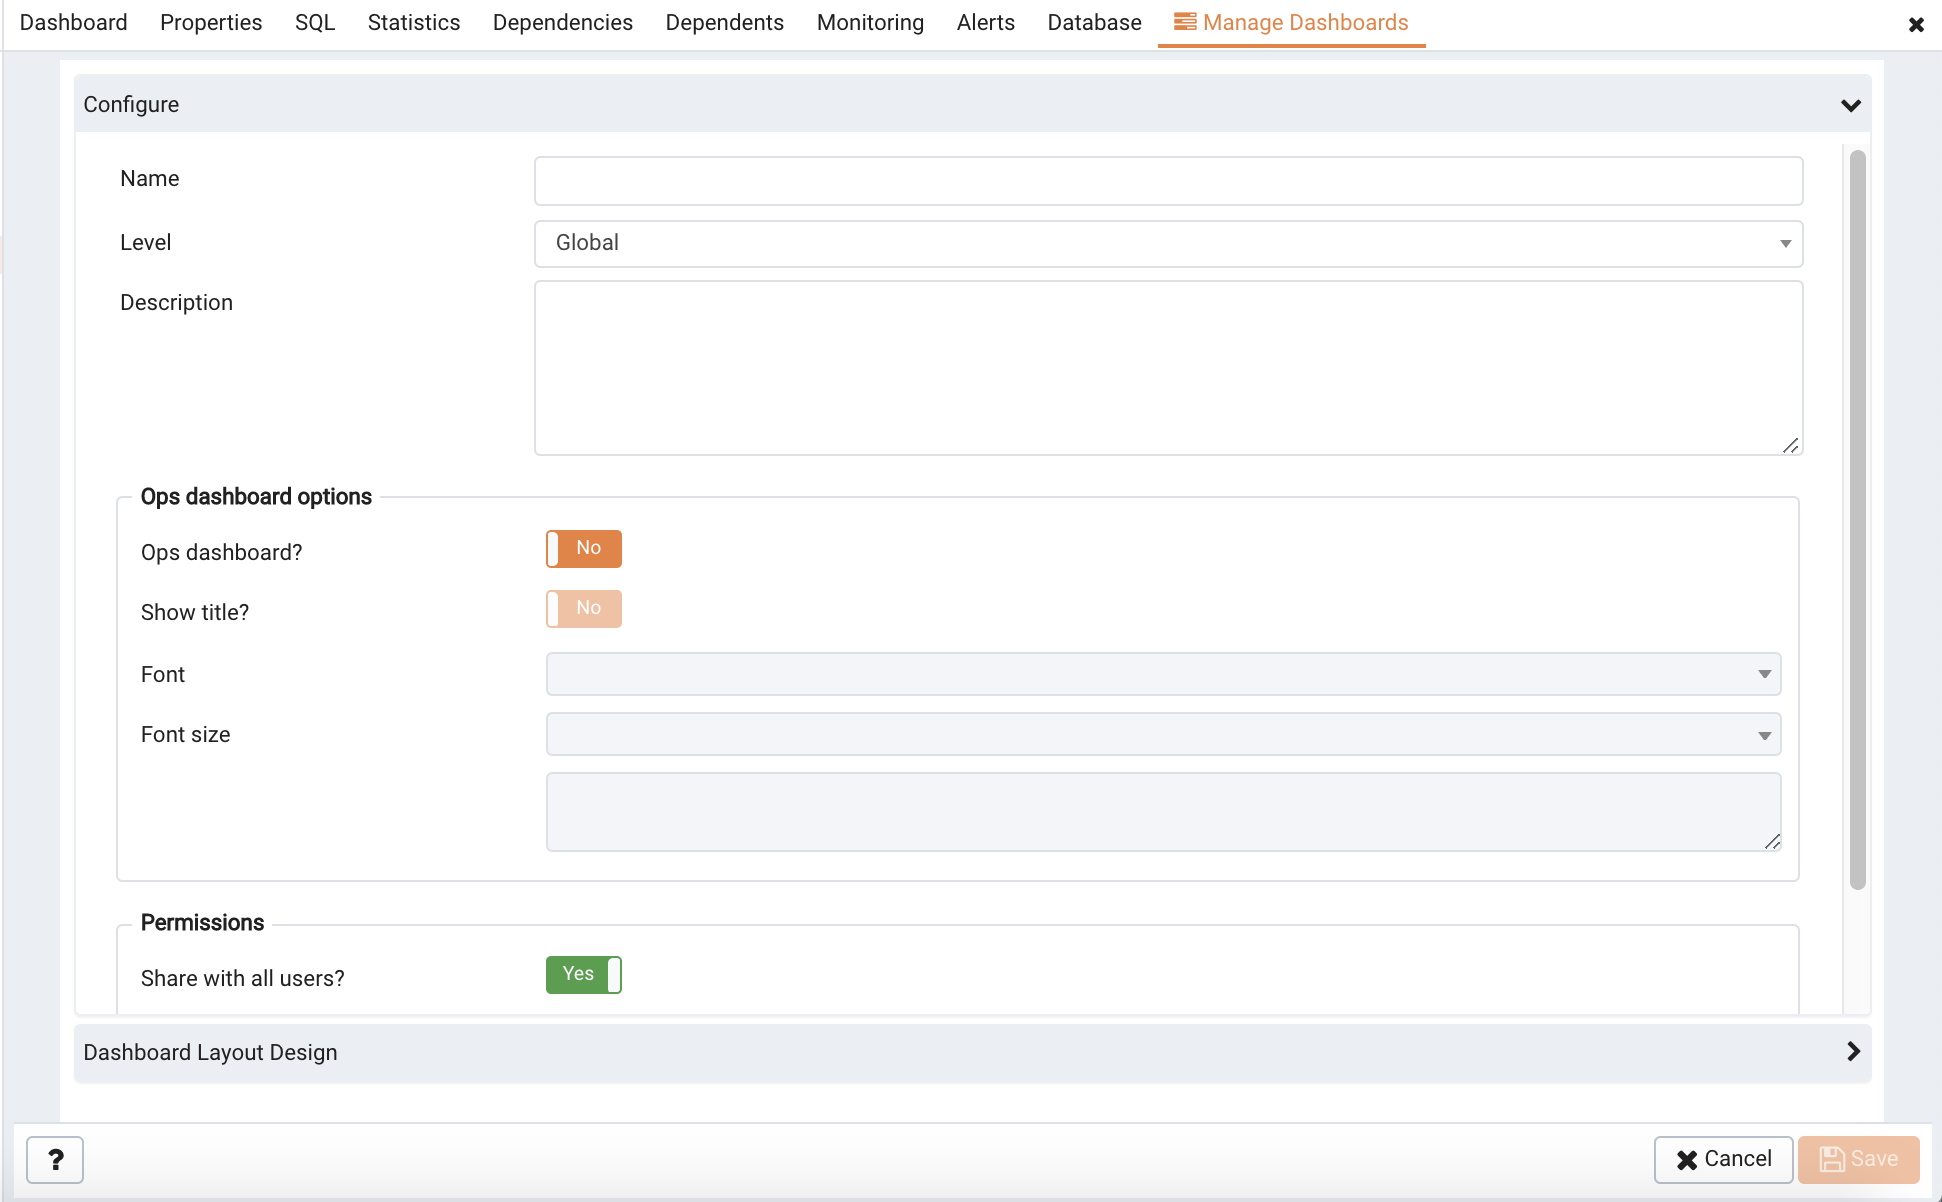
Use the fields in the Configure section (see Figure 4.4) to specify general information about the dashboard:
|
•
|
Use the Level drop-down listbox to specify the level of the PEM hierarchy within the PEM client on which the dashboard will be displayed. A dashboard may be accessed via the Dashboards menu on a Global level, an Agent level, the Server level or the Database level. Each selected level within the list will expose a different set of metrics on which the custom dashboard's charts may be based.
|
|
•
|
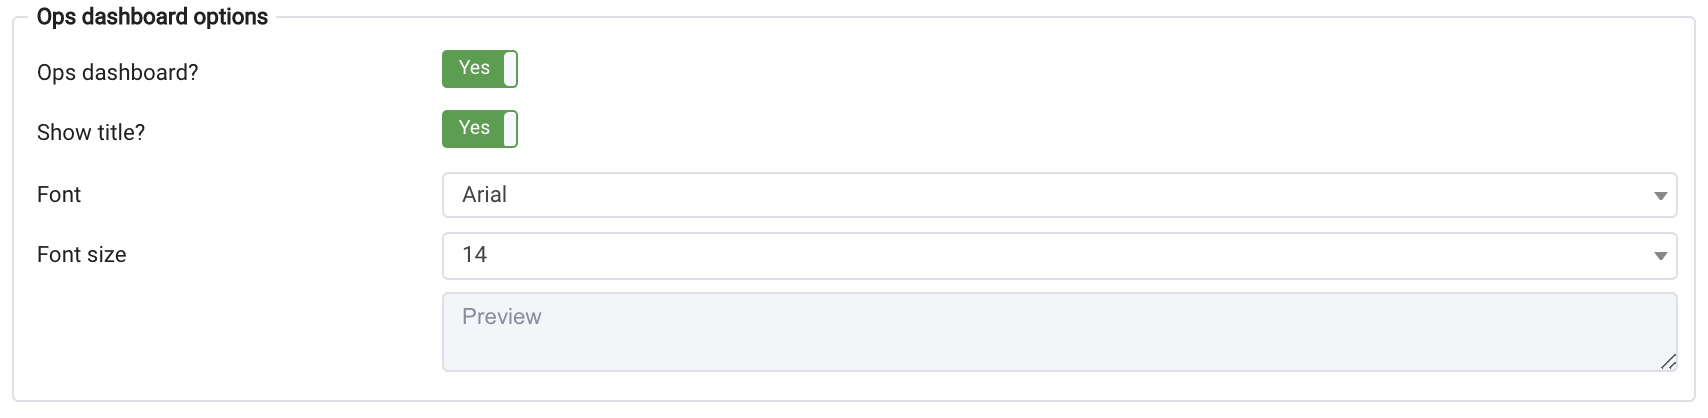
Set the Ops Dashboard? field to Yes to instruct the server to create a dashboard that is formatted for display on an Ops monitor.
|
|
•
|
Set the Show Title? field to Yes to display the dashboard name at the top of the Ops dashboard.
|
|
•
|
Use the Font drop-down list box to select a custom font style for the title. The selected font style will be displayed in the Preview box.
|
|
•
|
Use the Font size drop-down list box to select a custom font size for the title. The selected font style will be displayed in the Preview box.
|
Use the Permissions box to specify the users that will be able to view the new dashboard:
|
•
|
Set the Share with all slider to Yes to instruct the server to allow all Teams to access the dashboard, or set Share with all to No to enable the Access permissions field.
|
|
•
|
Use the Access permissions field to specify which roles can view the new dashboard. Click in the field, and select from the list of users to add a role to the list of users with dashboard access.
|
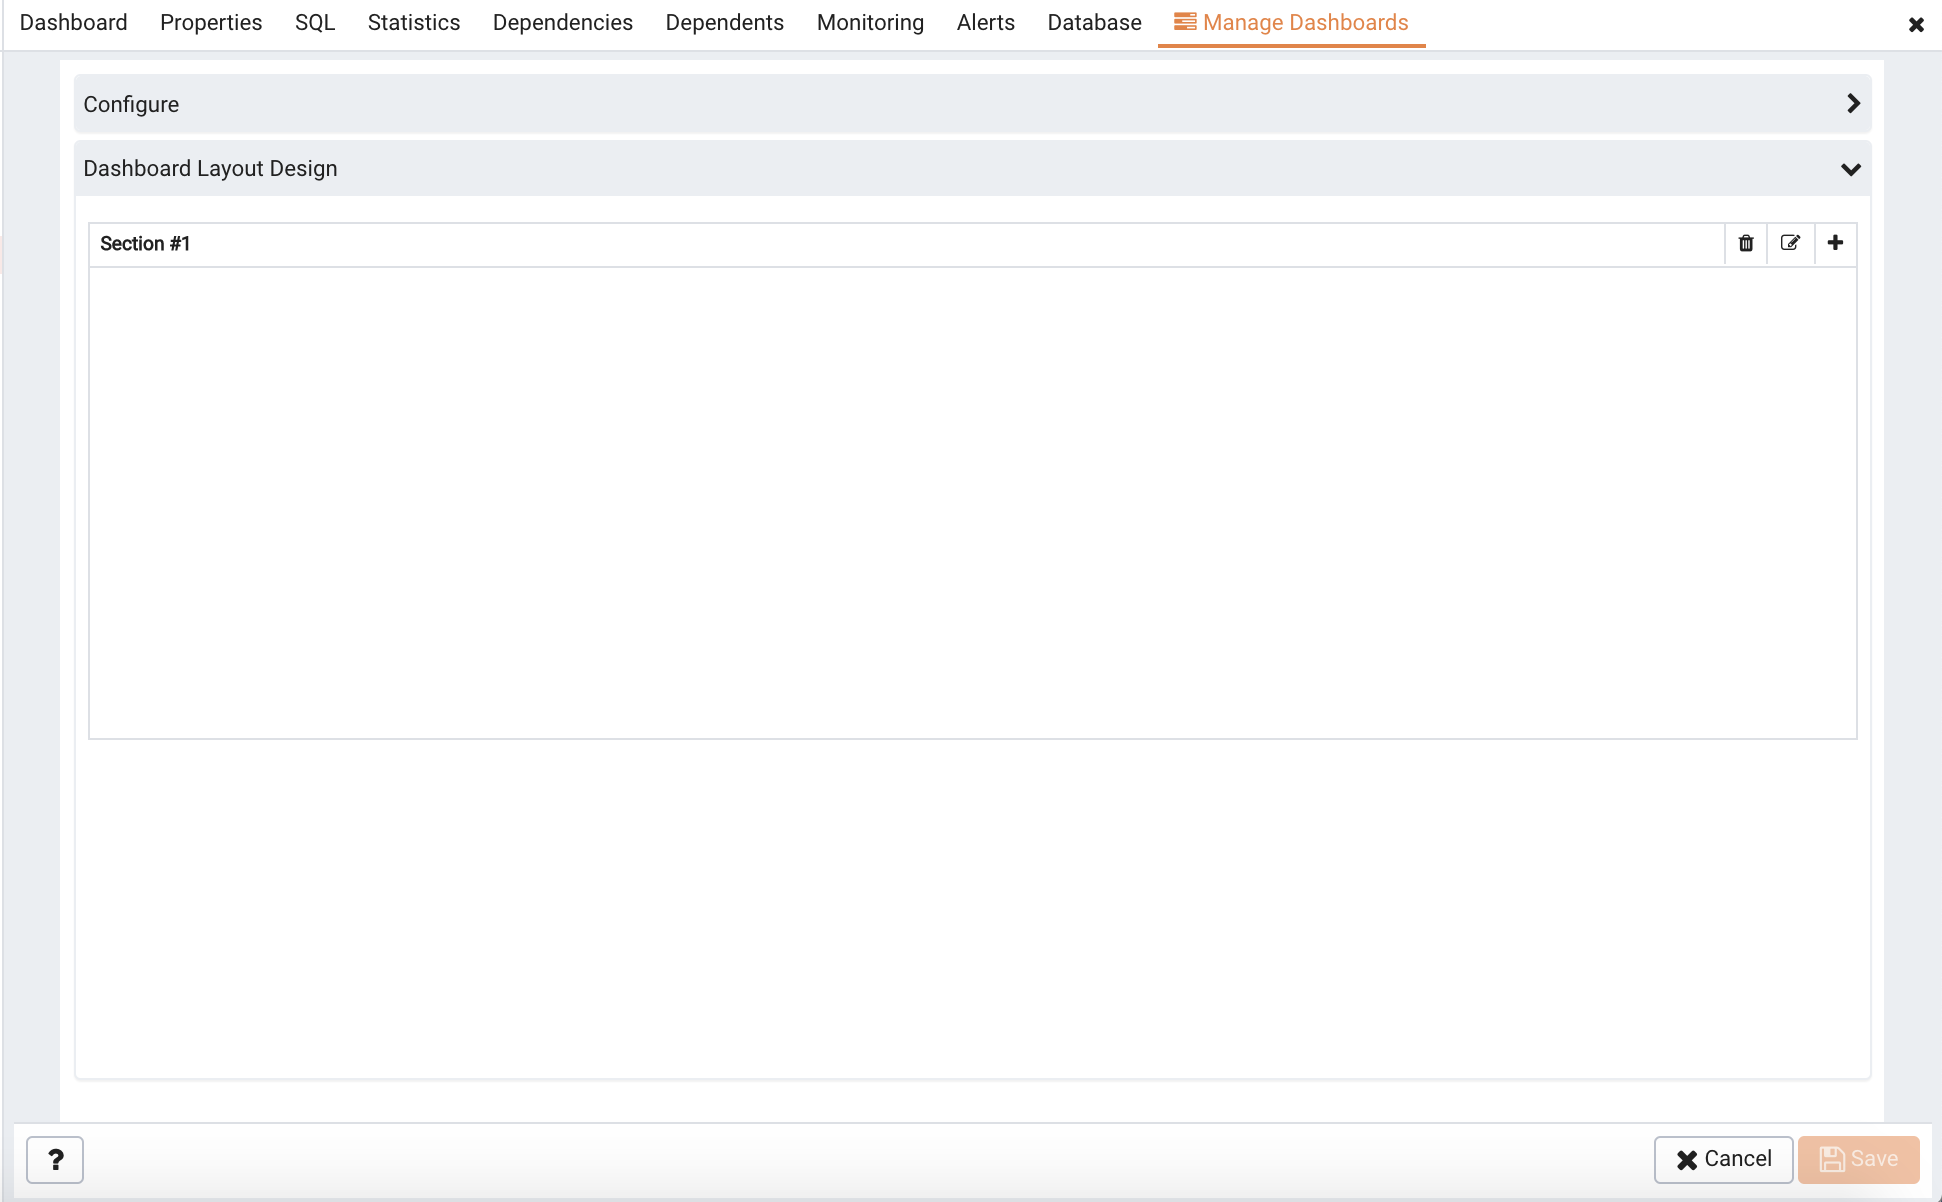
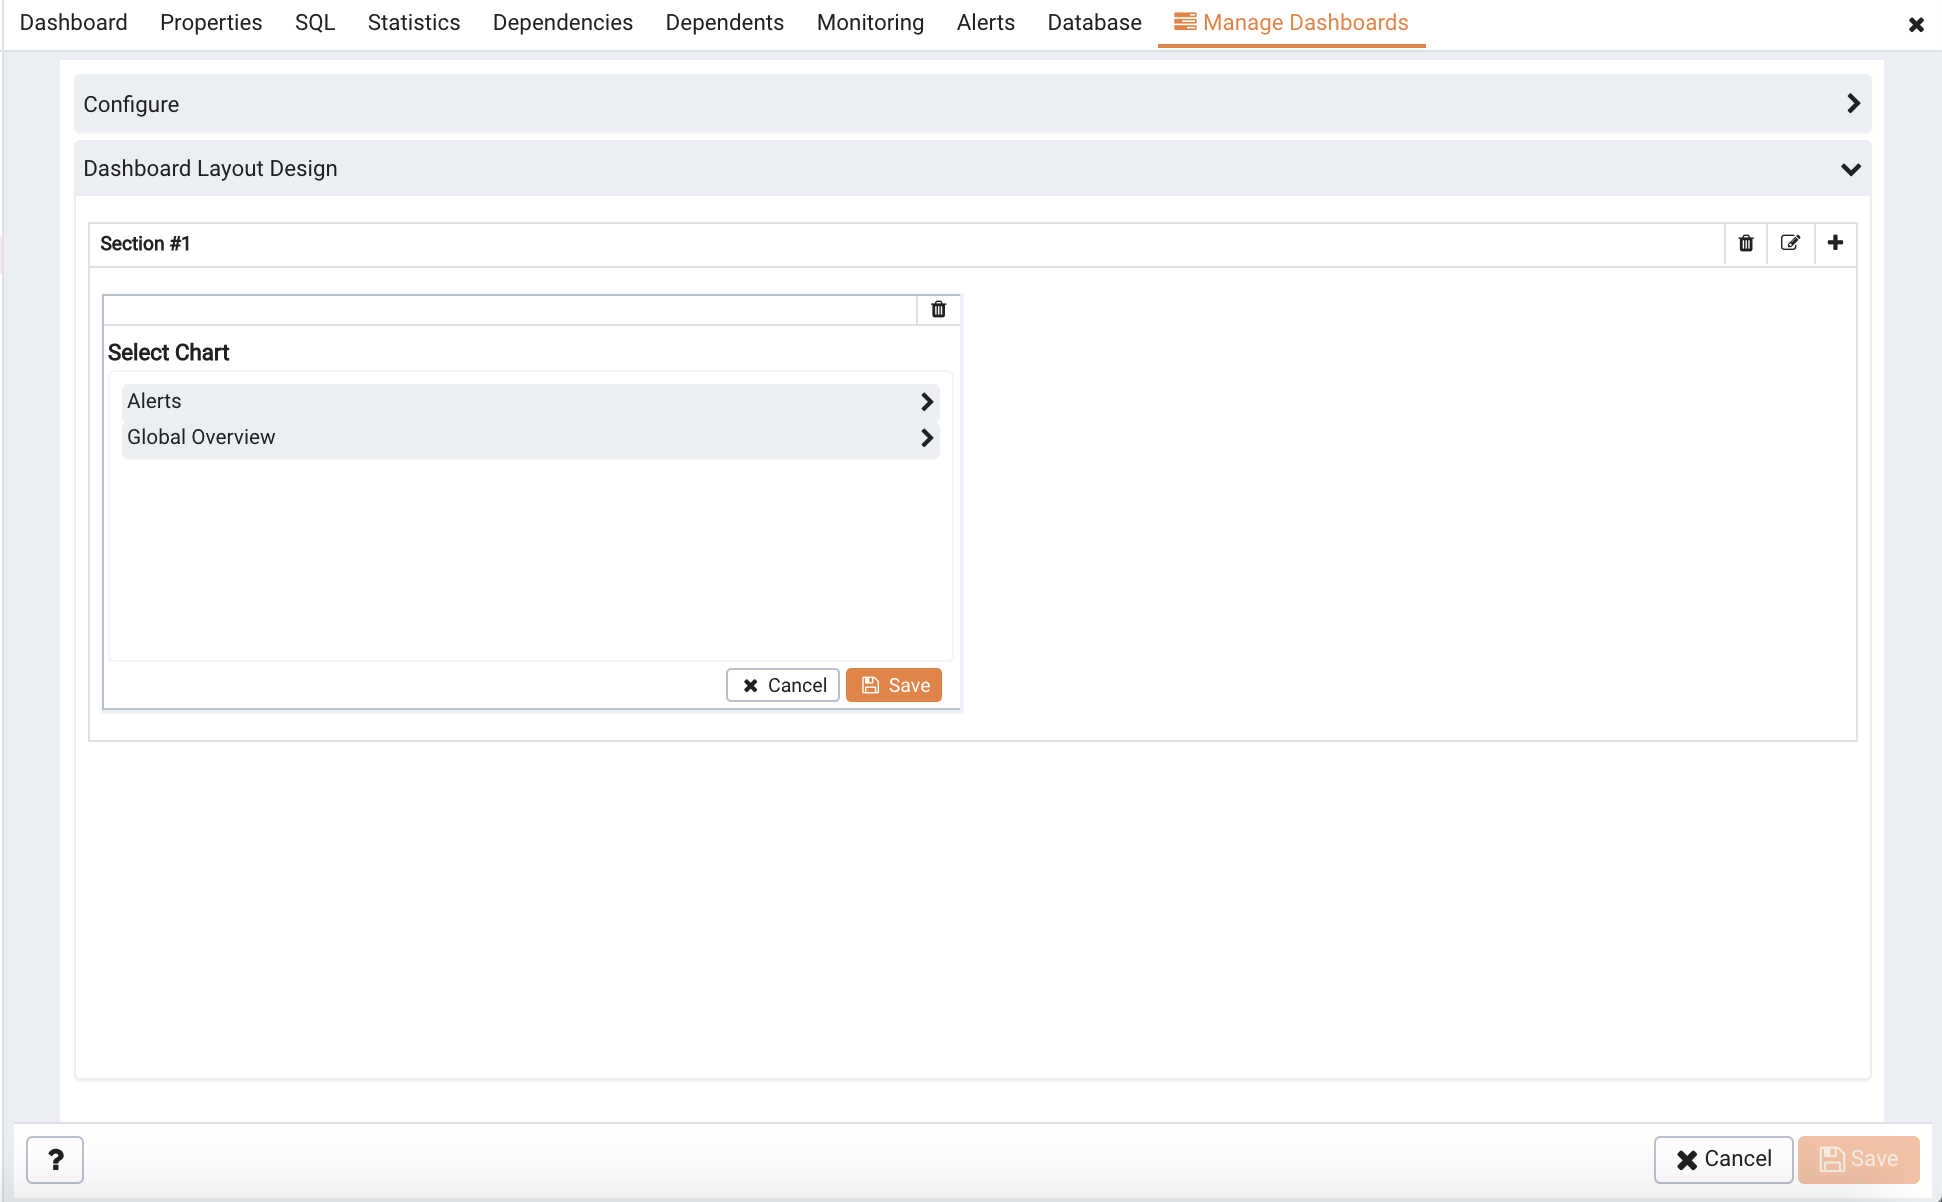
When you've completed the Configure Dashboard section, click the arrow in the upper-right corner to close the section, and access the
Dashboard Layout Design section.
|
•
|
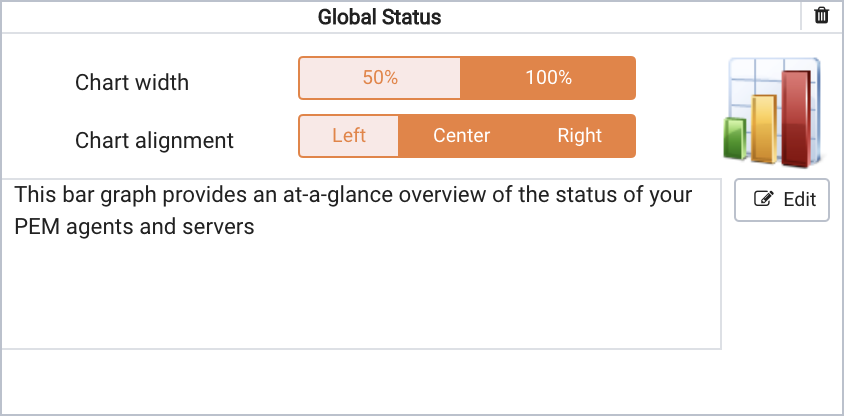
Use the Chart width selector to indicate the width of the chart; select 50% to display the chart in half of the dashboard, or 100% to use the whole dashboard width.
|
|
•
|
Use the Chart alignment selector to indicate the position of the chart within the section:
|
Select Left to indicate that the chart should be left-justified.
Select Center to indicate that the chart should be centered.
Select Right to indicate that the chart should be right-justified.
|
•
|
Set the Ops Dashboard? field to Yes to instruct the server to create a dashboard that is formatted for display on an Ops monitor.
|
|
•
|
Set the Show Title? field to Yes to display the dashboard name at the top of the Ops dashboard.
|
|
•
|
Use the Font drop-down list box to select a custom font style for the title. The selected font style will be displayed in the Preview box.
|
|
•
|
Use the Font size drop-down list box to select a custom font size for the title. The selected font style will be displayed in the Preview box.
|
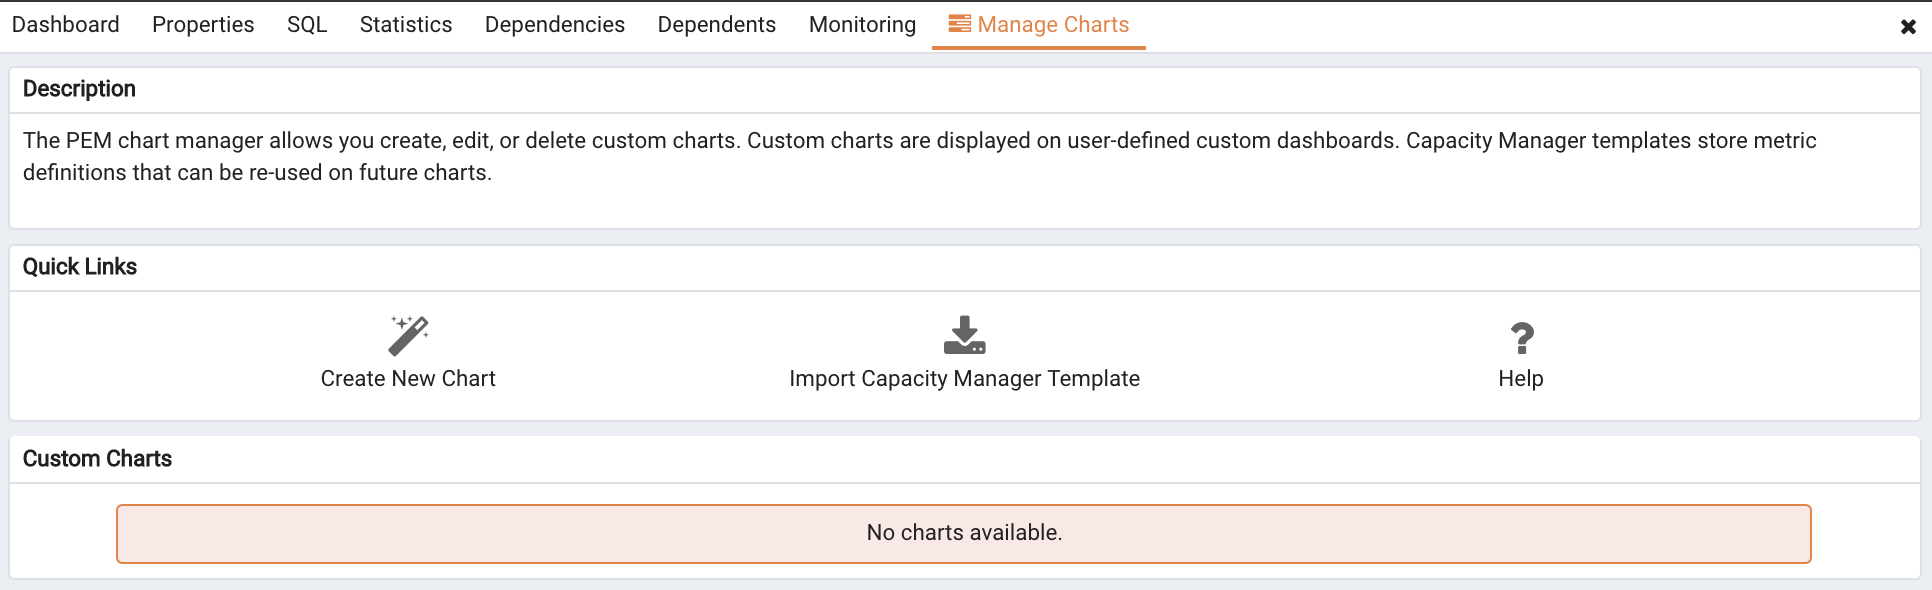
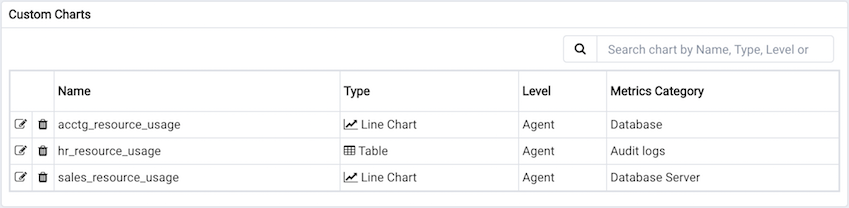
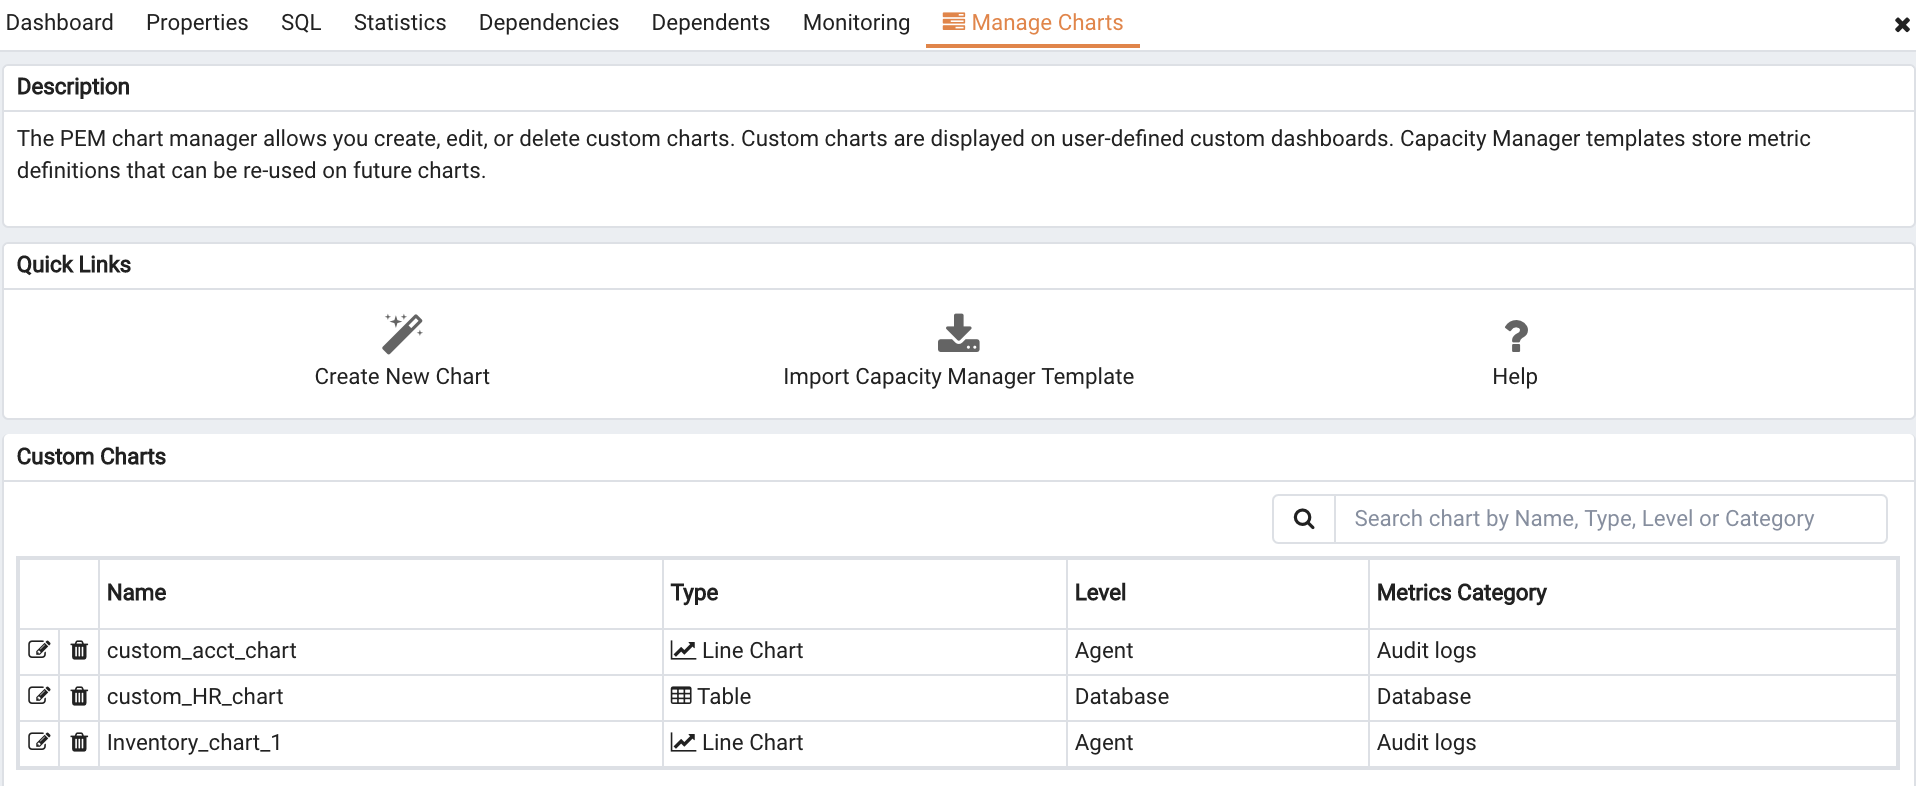
Click the Create New Chart icon in the
Quick Links section of the
Manage Charts tab to open the
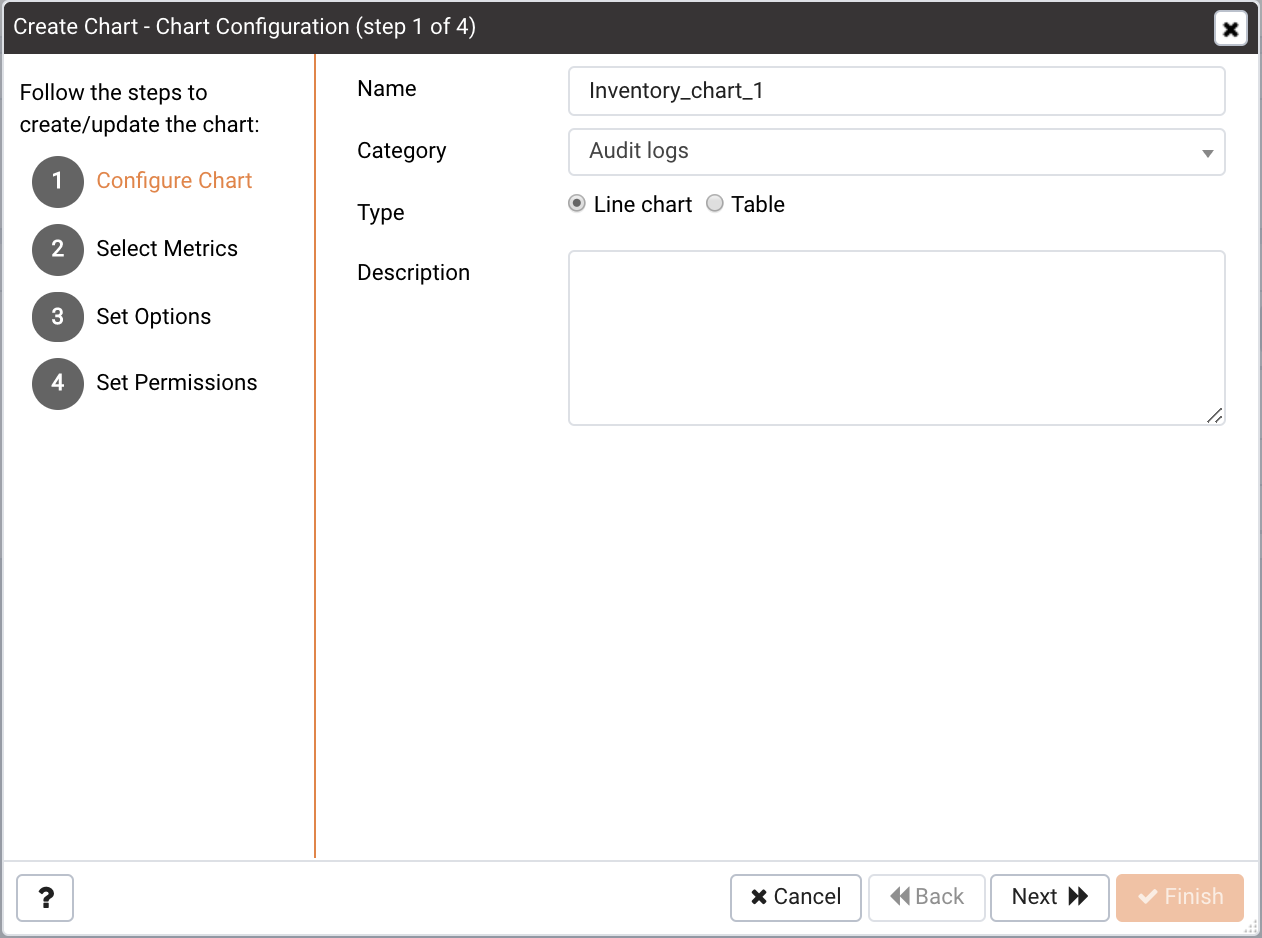
Create Chart wizard. The wizard will walk you through the steps required to define a new chart.
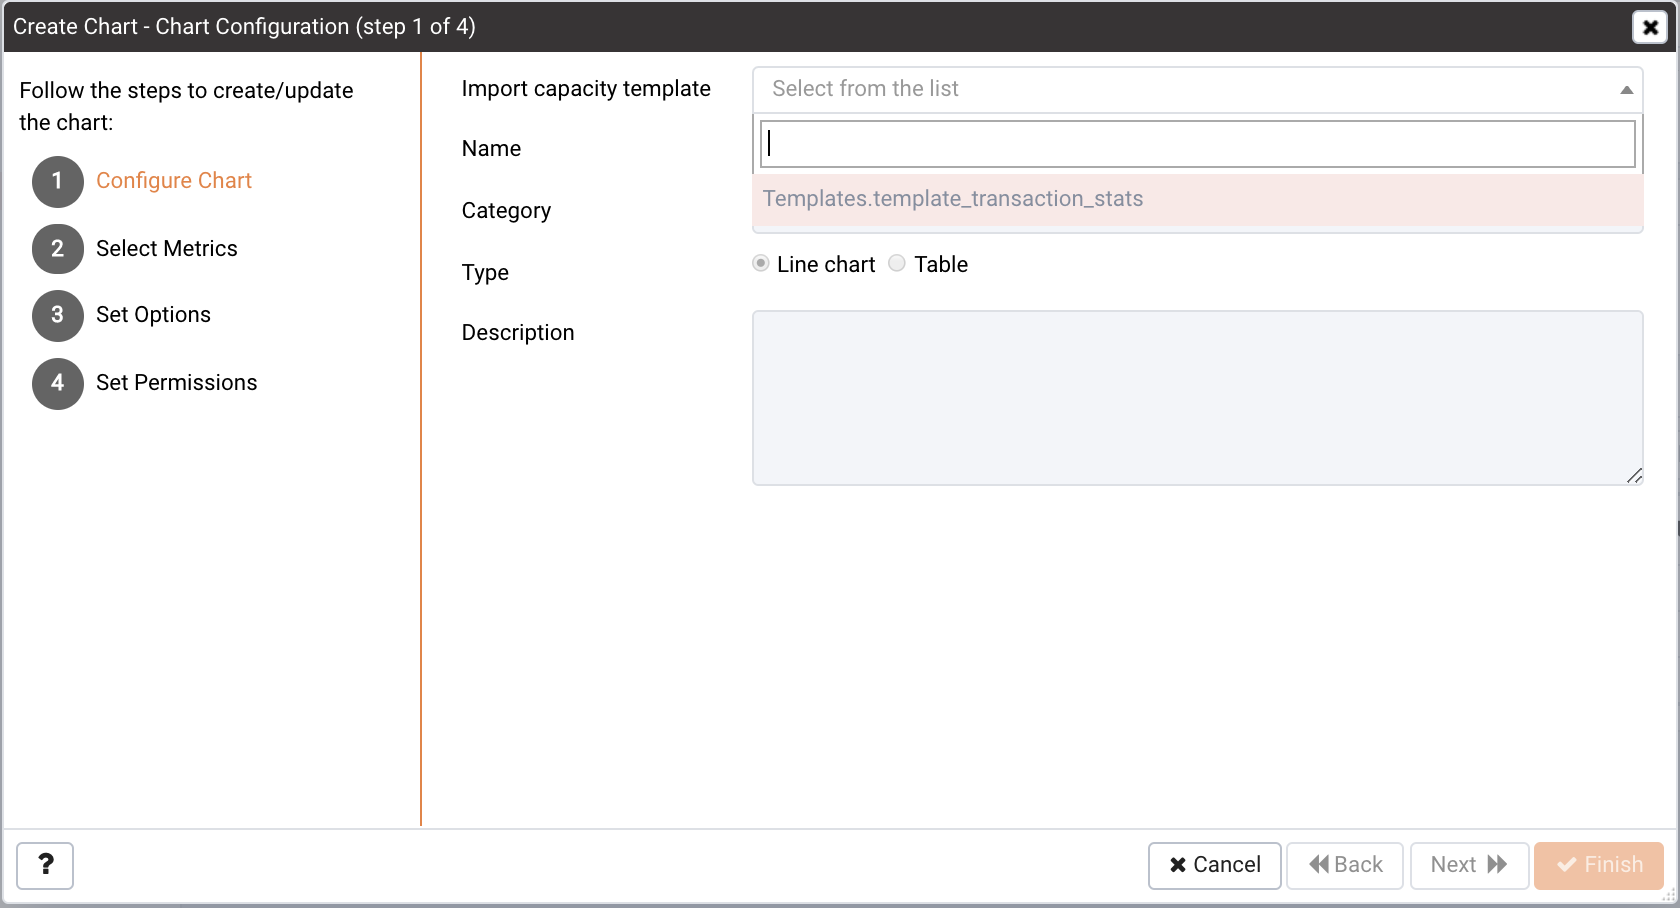
Use the fields on the Configure Chart dialog (shown in Figure 4.11) to specify general information about the chart:
|
•
|
Use the drop-down listbox in the Category field to specify the category in which this chart will be displayed; when adding a custom chart to a custom dashboard, the chart will be displayed for selection in the category specified.
|
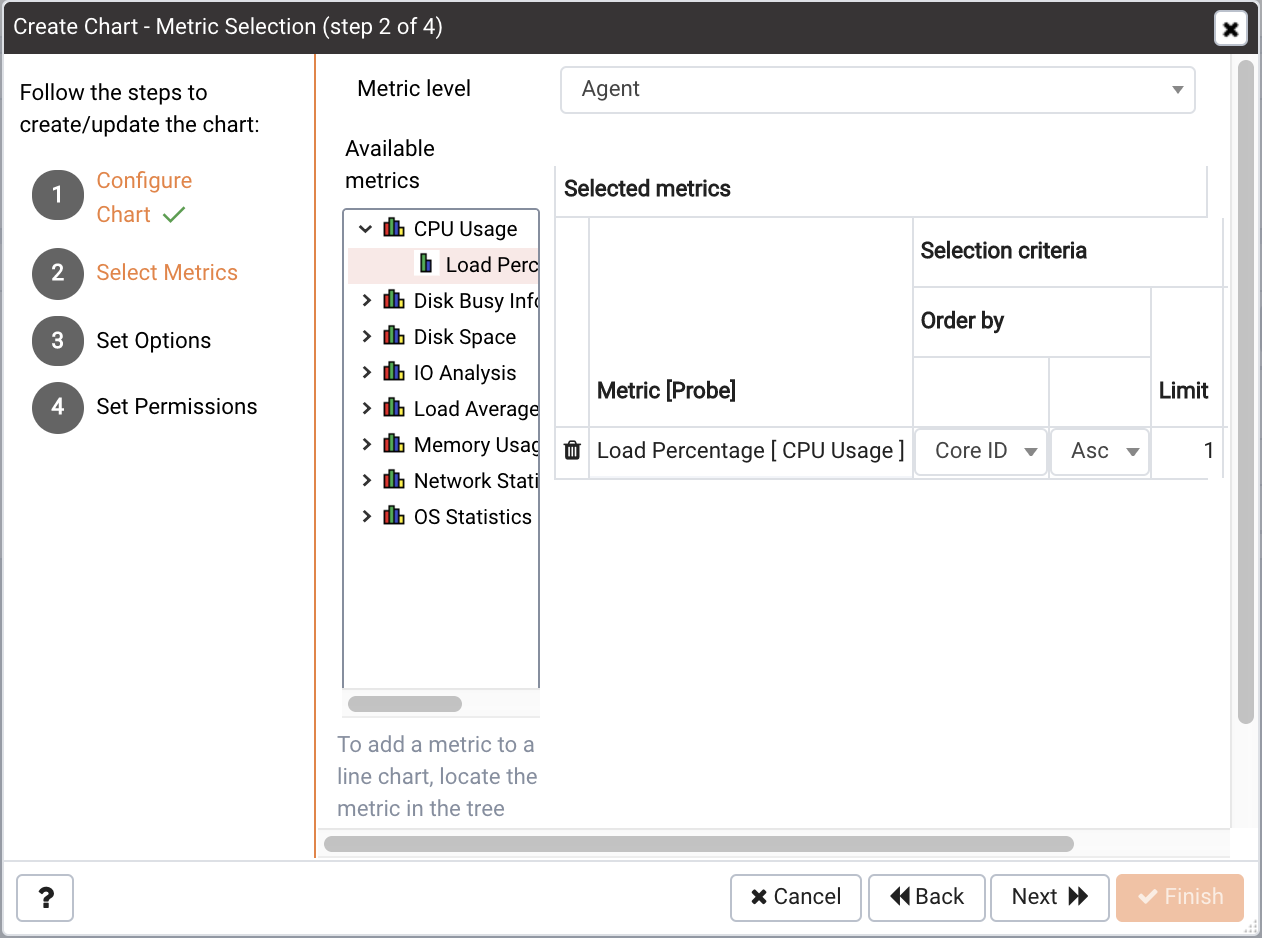
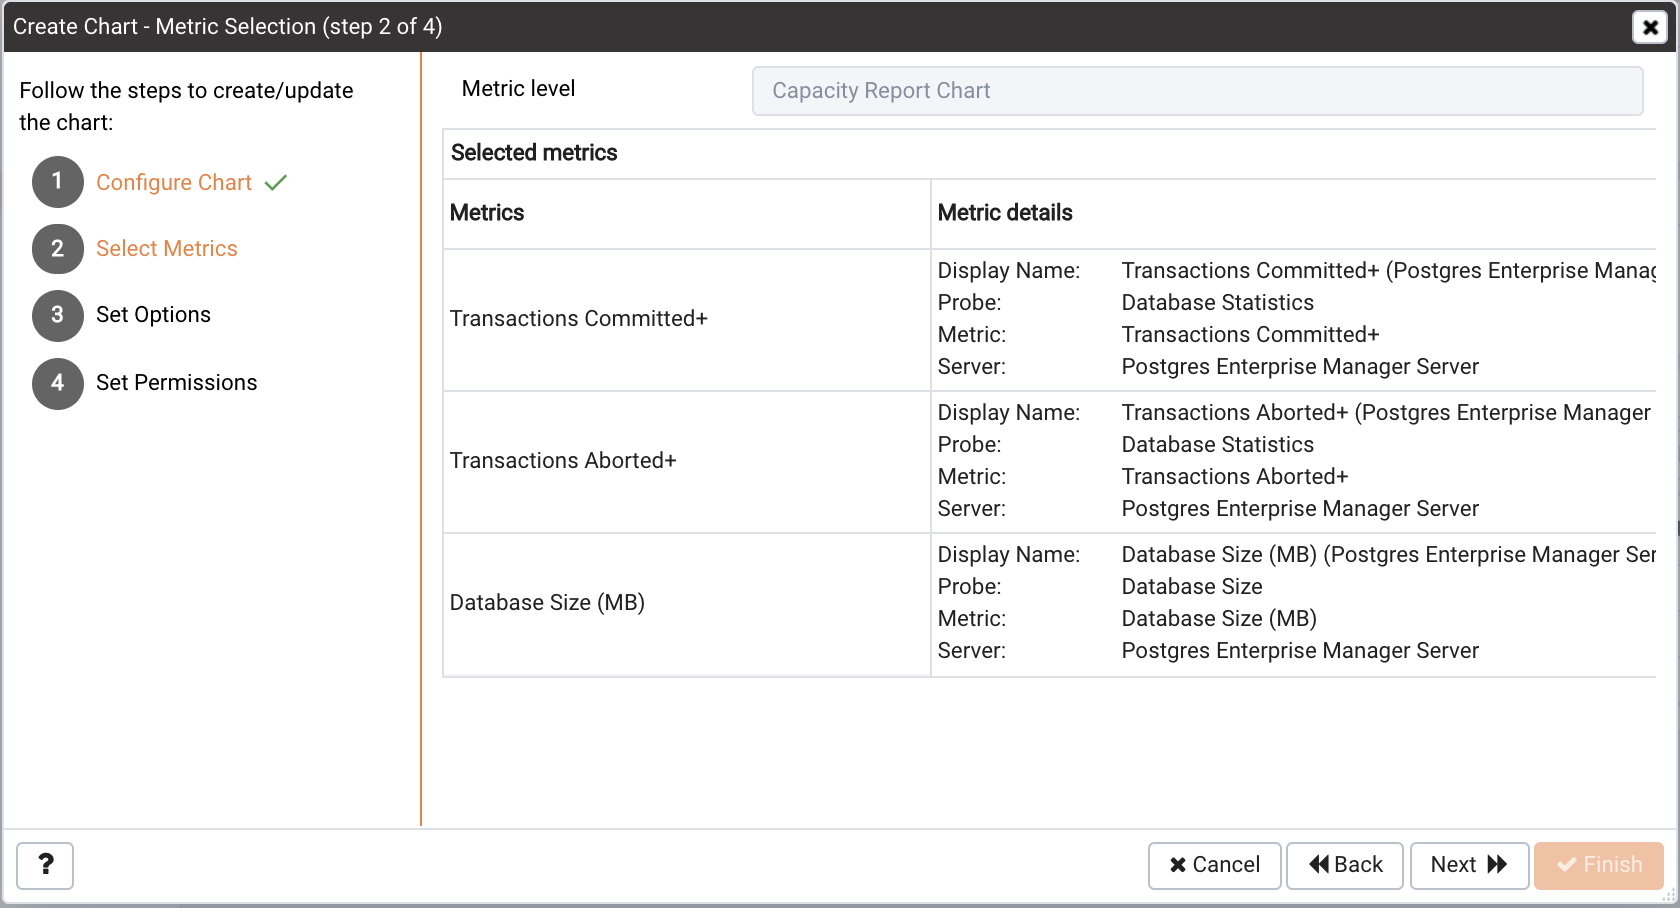
Use the fields on the Select Metrics dialog (shown in Figure 4.12) to select the metrics that will be displayed on the chart.
|
•
|
Use the Metric level drop-down listbox to specify the level of the PEM hierarchy from which you wish to select metrics. You can specify Agent, Database, or Server. Each level offers access to a unique set of probes and metrics.
|
|
•
|
Use the fields in the Selected metrics panel to specify how the metric data will be displayed in your chart. The selection panel displays the name of the metric in the (non-modifiable) Metric [Probe] column. You can:
|
|
o
|
Use the Limit field to specify the number of rows in a table or lines in a chart:
|
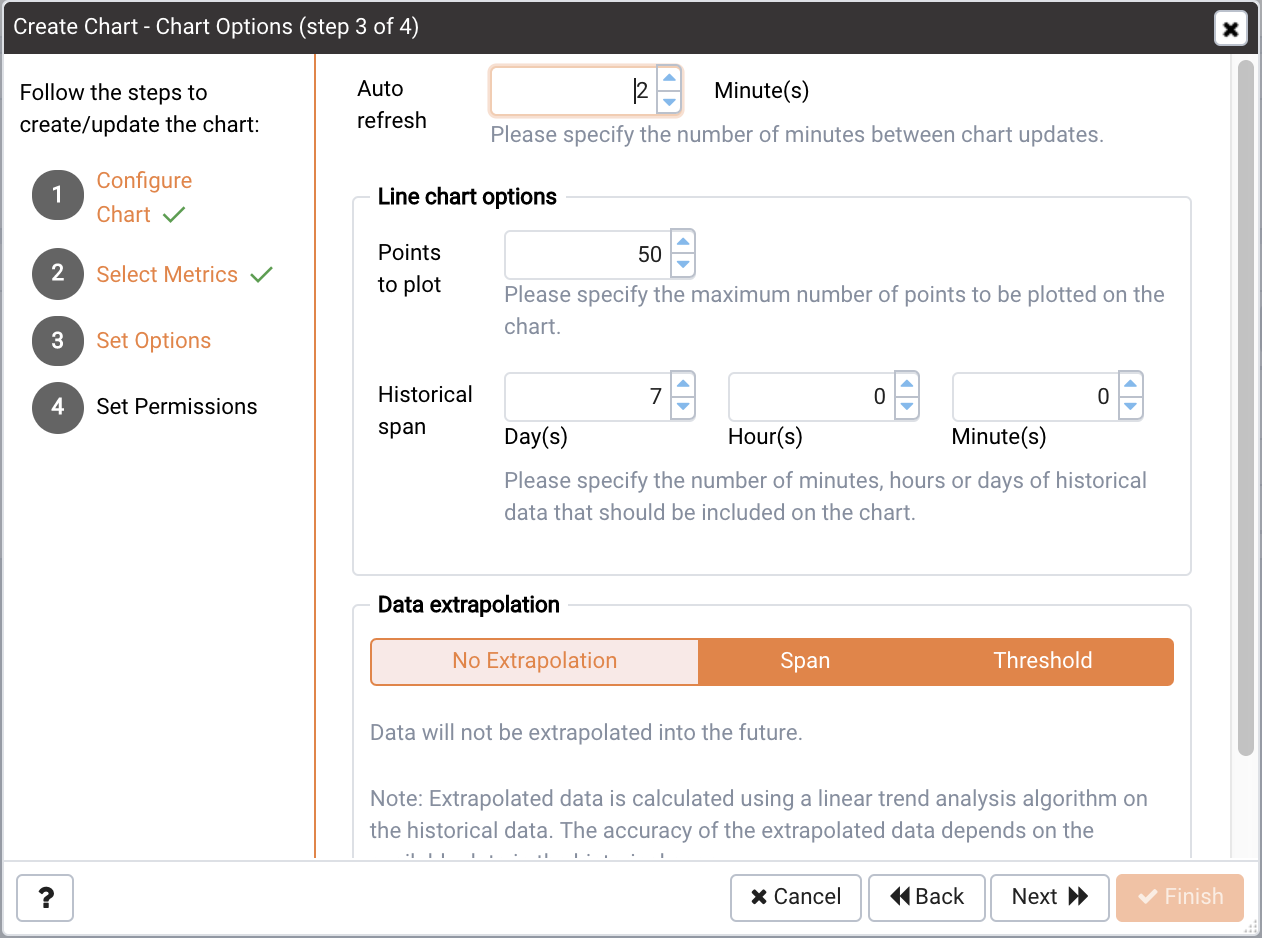
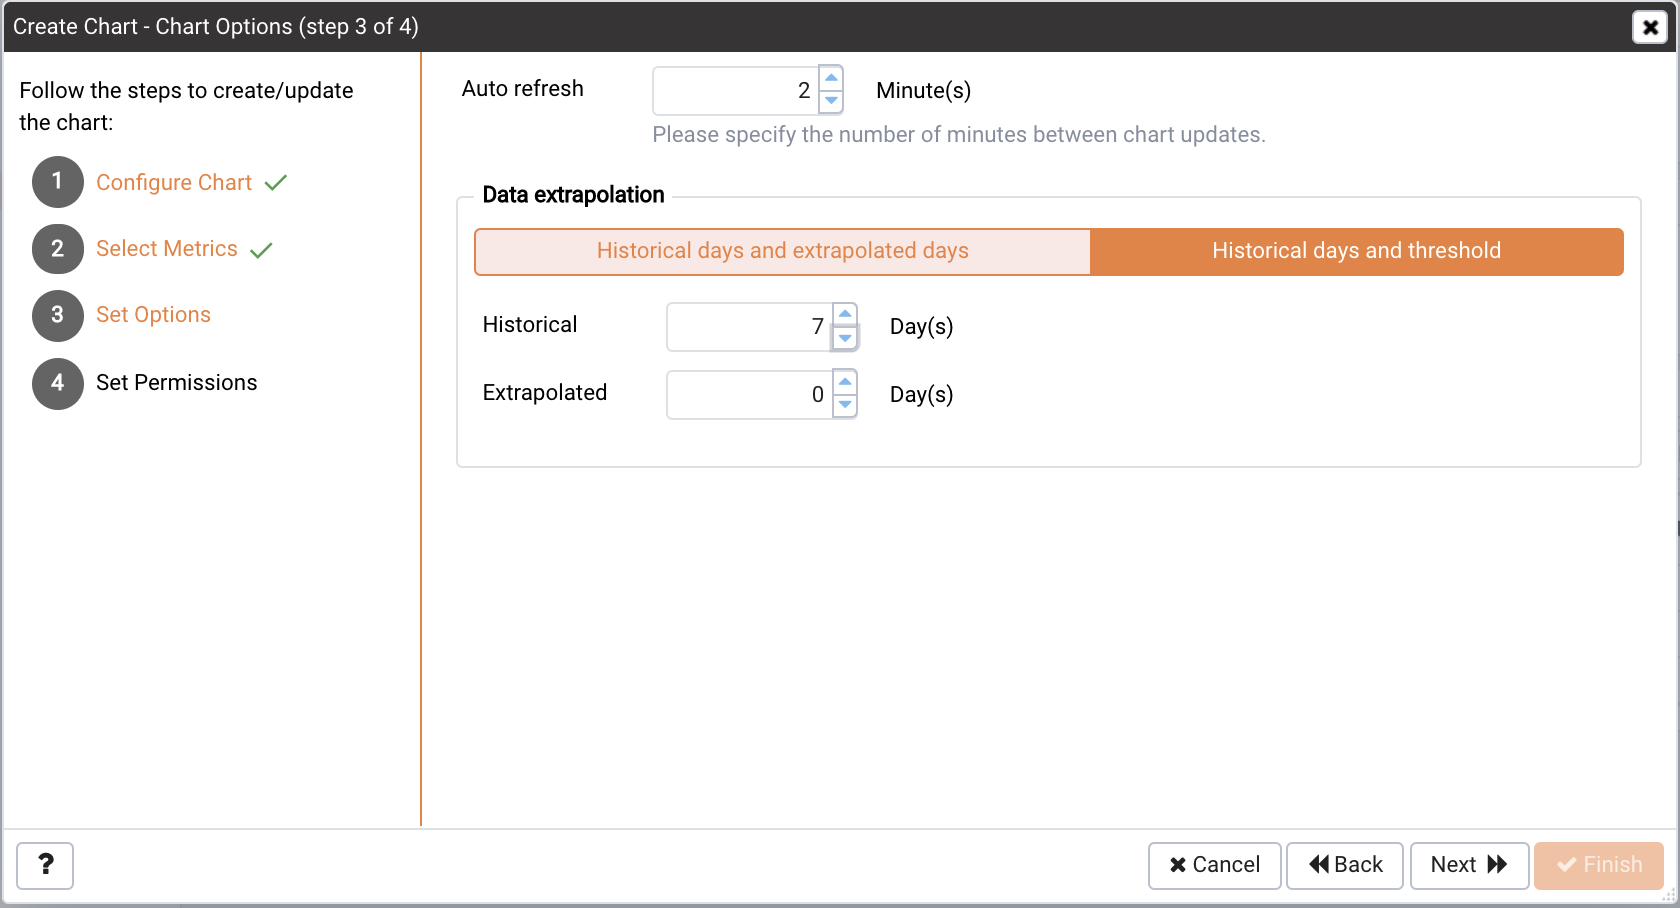
Use the fields on the Set Options dialog (shown in Figure 4.13) to specify display options for your chart:
|
•
|
Use the Auto Refresh field to specify the number of minutes between chart updates - choose a value from 1 to 120. The default auto refresh rate is 2 minutes.
|
|
•
|
Use the Points to plot field to specify the maximum number of points that will be plotted on the chart.
|
Use the Day(s) field to specify the number of days of historical data that should be included on the chart.
Use the Hour(s) field to specify the number of hours of historical data that should be included on the chart.
Use the Minute(s) field to specify the number of minutes of historical data that should be included on the chart.
Use the fields in the Data extrapolation box to specify if PEM should generate extrapolated data based on historical data:
|
•
|
Click the No Extrapolation label to omit extrapolated data from the chart.
|
|
•
|
Click the Span label to use the Days and Hours selectors to specify the period of time spanned by the metrics on the chart.
|
|
•
|
Click the Threshold label to use threshold selectors to specify a maximum or minimum value for the chart.
|
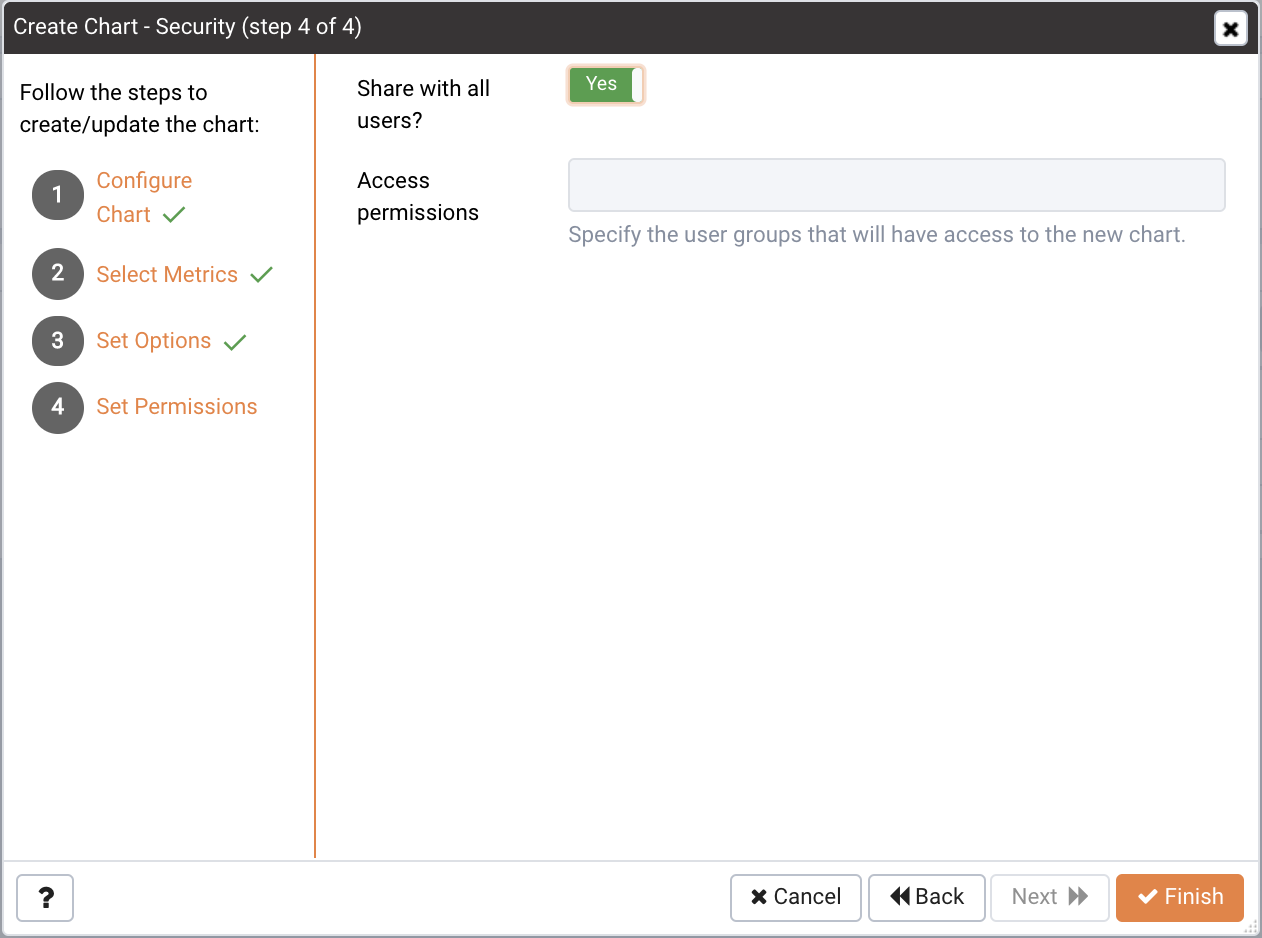
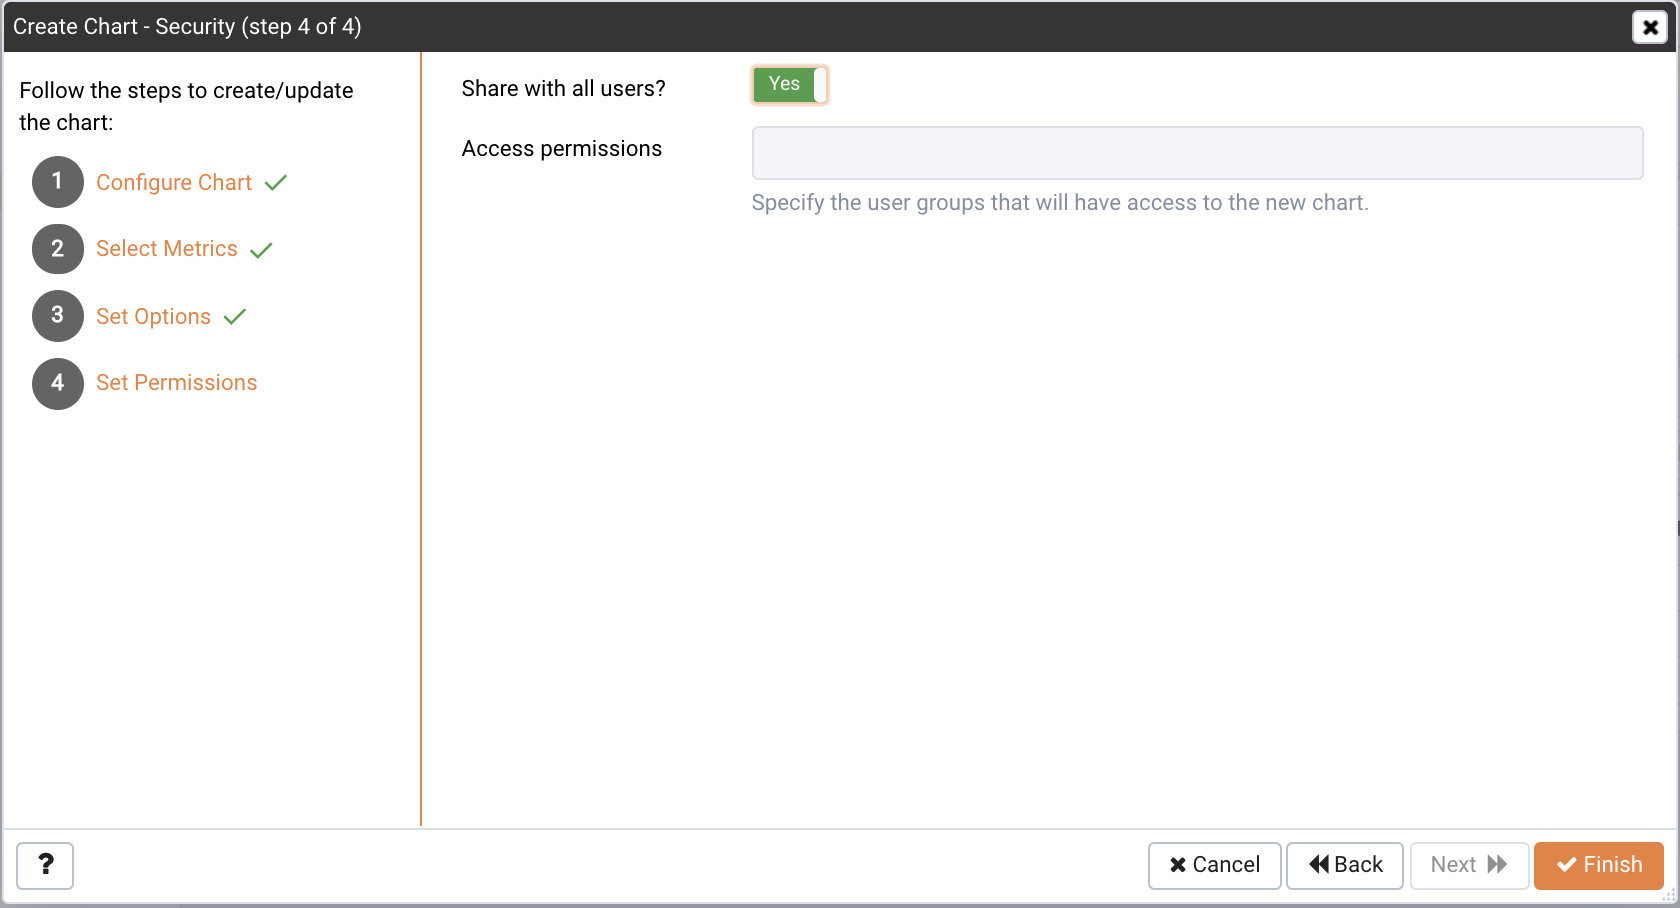
Figure 4.14 – Specifying access permissions.
Use the fields on the Set Permissions dialog (shown in Figure 4.14) to specify display options for your chart.
|
•
|
Set the Share with all slider to Yes to indicate that the chart will be available to all authorized users, or No to restrict access to the users or groups specified in the Access permissions field.
|
|
•
|
Use the Access permissions field to select the group or groups that will have access to the chart.
|
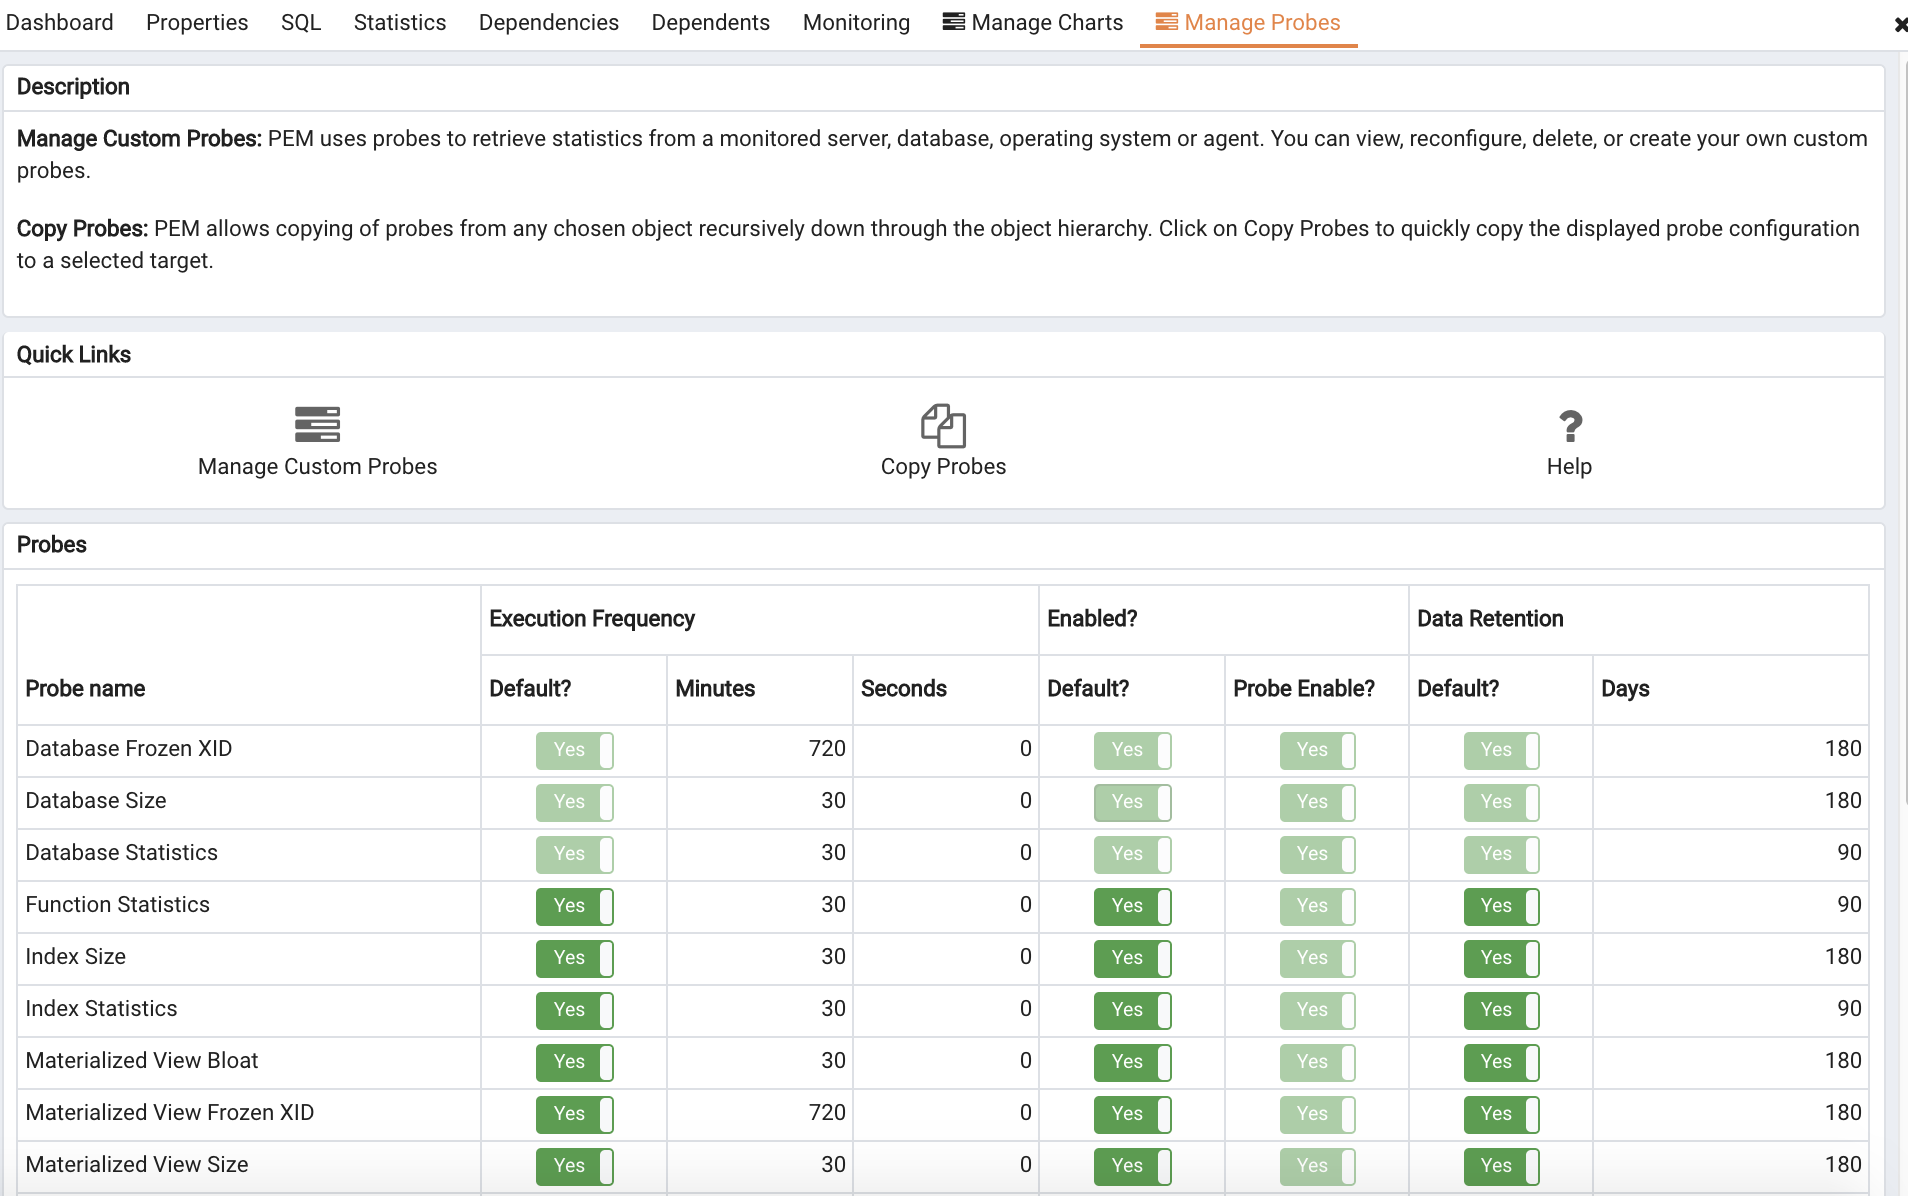
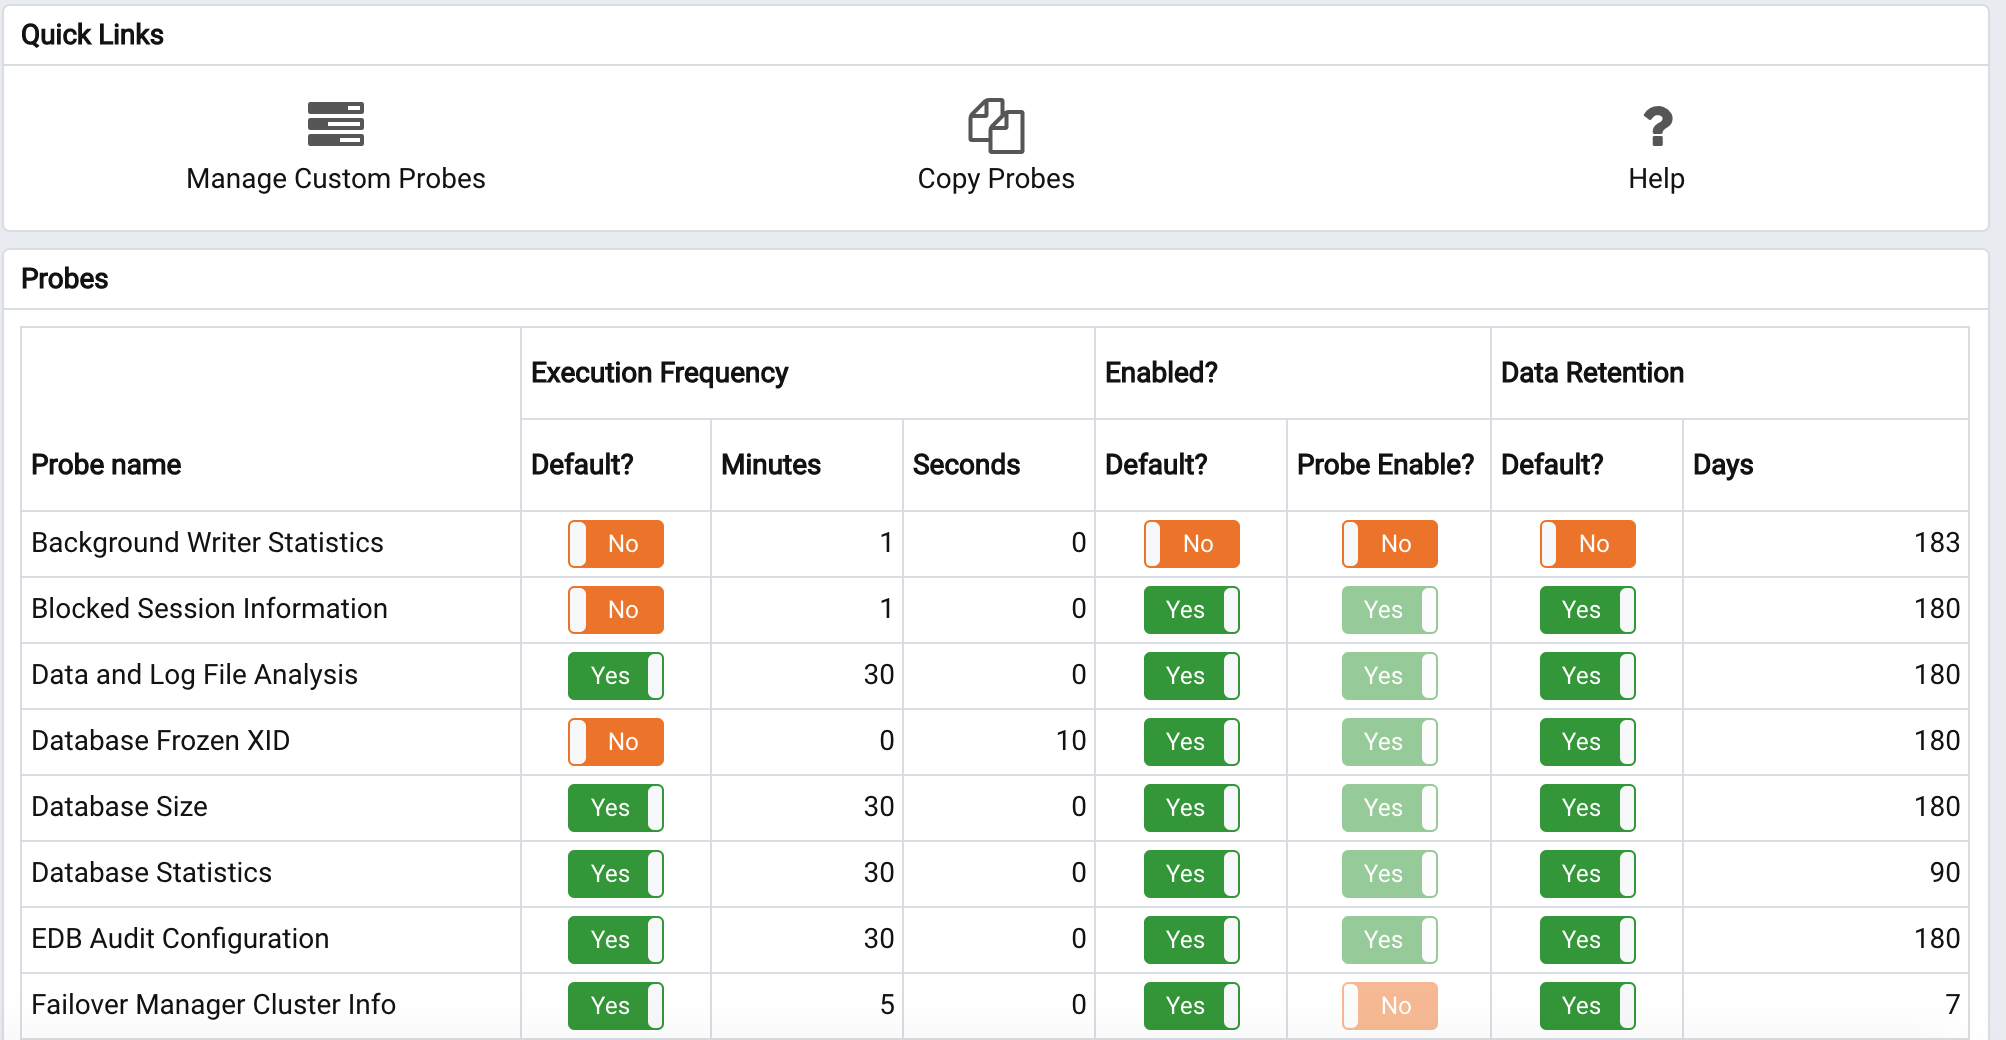
A probe is a scheduled task that returns a set of performance metrics about a specific monitored object. A probe retrieves statistics from a monitored server, database, operating system or agent. You can use the
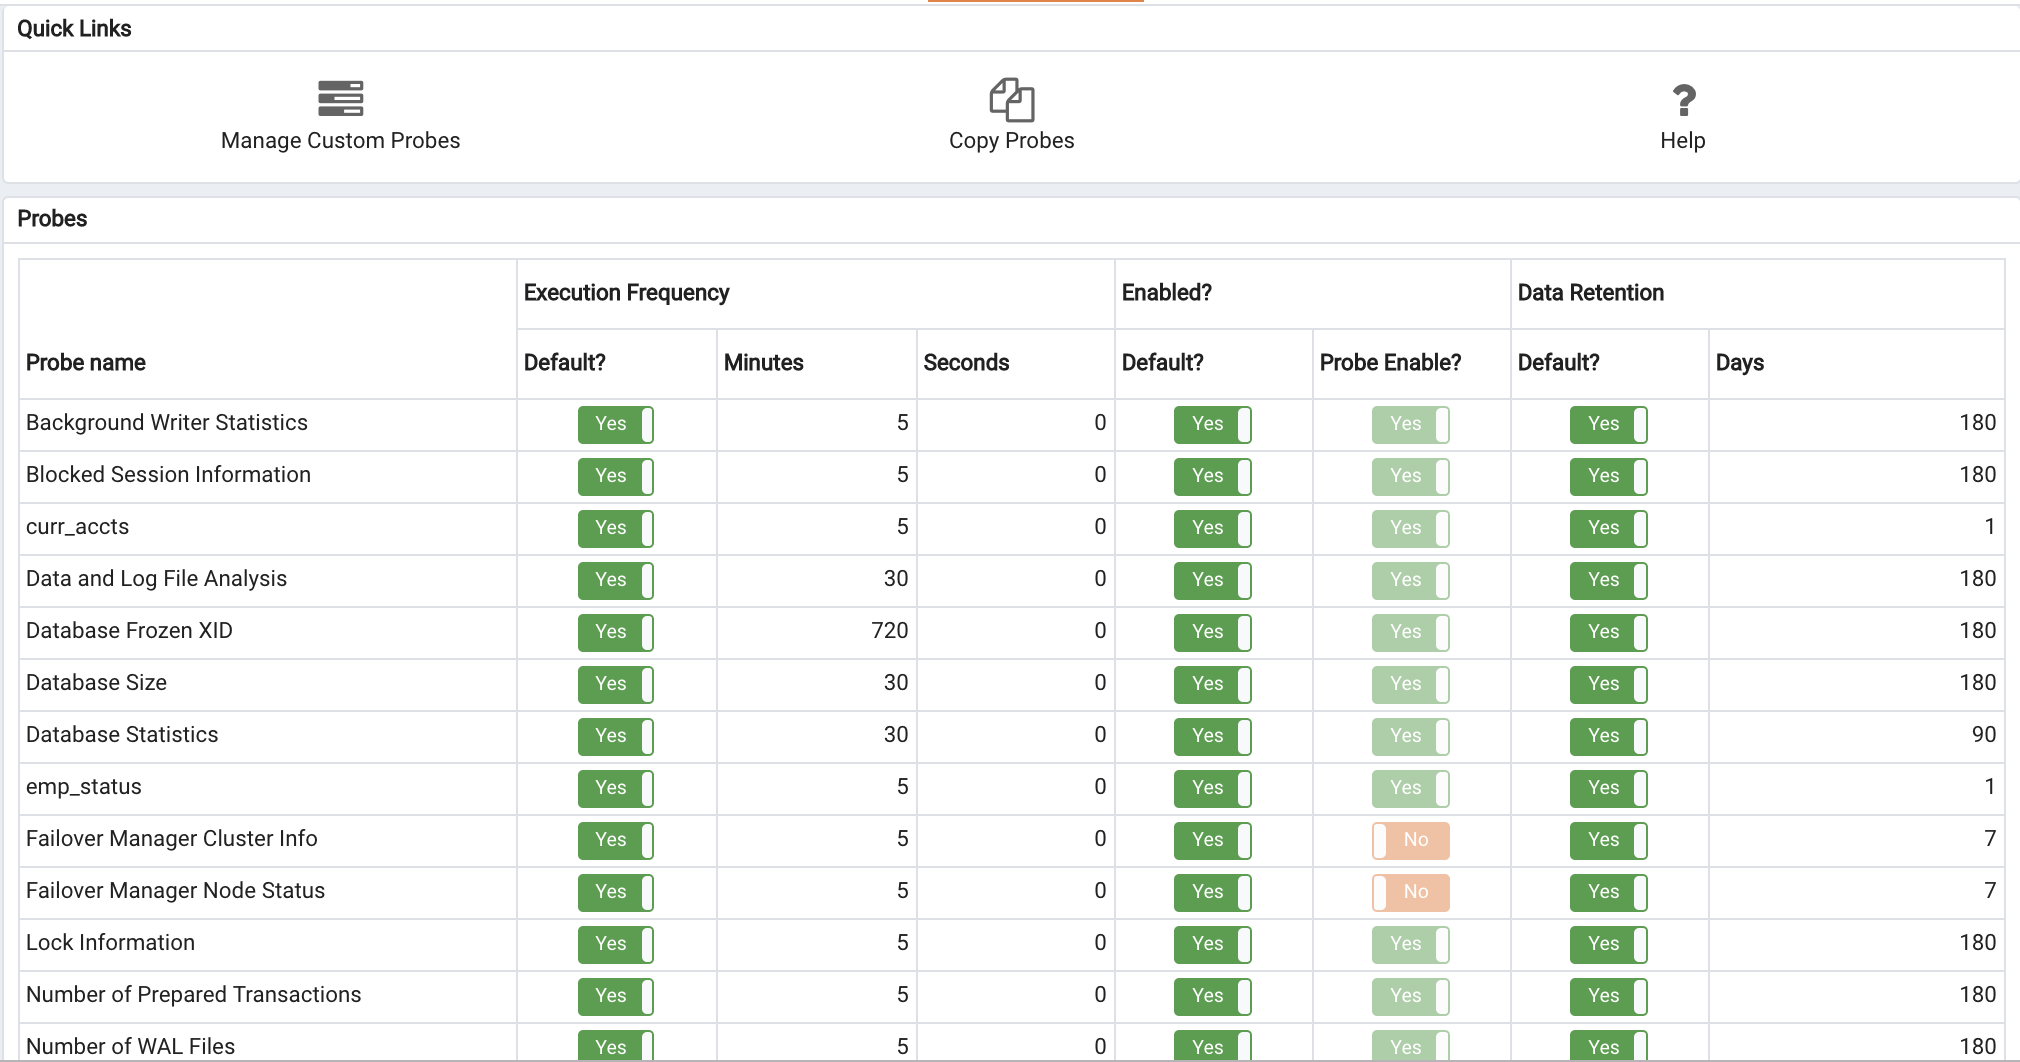
Manage Probes tab (shown in Figure 6.13) to override the default configuration and customize the behavior of each probe.
To open the Manage Probes tab, select
Manage Probes… from the
Management menu. The
Manage Probes tab opens in the PEM client (see Figure
4.20).
The Manage Probes tab provides a set of
Quick Links that you can use to create and manage probes:
|
•
|
Click the Manage Custom Probes icon to open the Custom Probes tab and create or modify a custom probe.
|
|
•
|
Click the Copy Probes icon to open the Copy Probe dialog, and copy the probe configurations from the currently selected object to one or more monitored objects.
|
|
•
|
Move the Default switch in the Execution Frequency columns to N to enable the Minutes and Seconds selectors, and specify a non-default value for the length of time between executions of the probe.
|
|
•
|
Move the Default switch in the Enabled? column to No to change the state of the probe, and indicate if the probe is active or not active.
|
Please note: If data from a Disabled probe is used in a chart, the chart will display an information icon in the upper-left corner that allows you to enable the probe by clicking the provided link.
|
•
|
Move the Default switch in the Data Retention column to No to enable the Day(s) field and specify the number of days that information gathered by the probe is stored on the PEM server.
|
The Manage Probes tab may display information about probes that cannot be modified from the current node. If a probe cannot be modified from the current dialog, the switches are disabled. Generally, a disabled probe can be modified from a node that is higher in the hierarchy of the PEM client tree control; select another object in the tree control to modify which probes are displayed or enabled in the
Manage Probes tab.
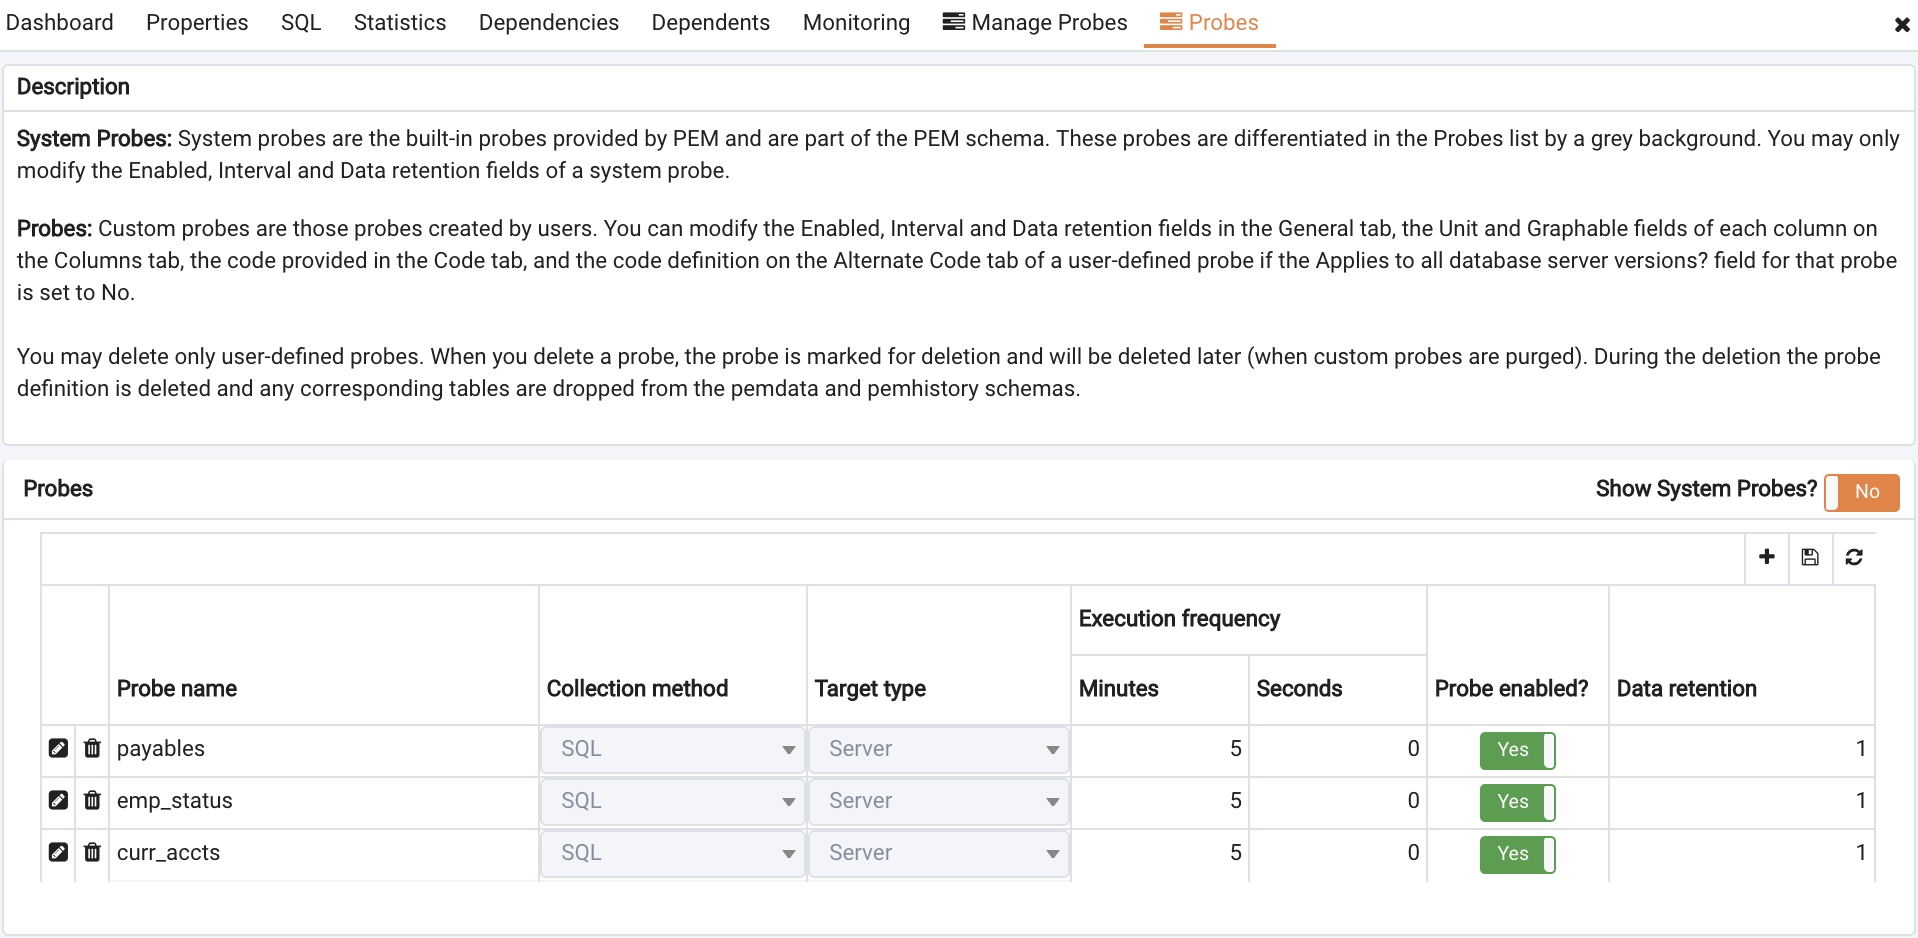
You can use the PEM Custom Probes tab to create a new probe or modify an existing user-defined probe. To open the
Custom Probes tab (see Figure 4.21), select the
Manage Custom Probes… icon from the
Manage Probes tab.
Use the Show System Probes? switch to display or conceal the system probes on the
Custom Probes tab.
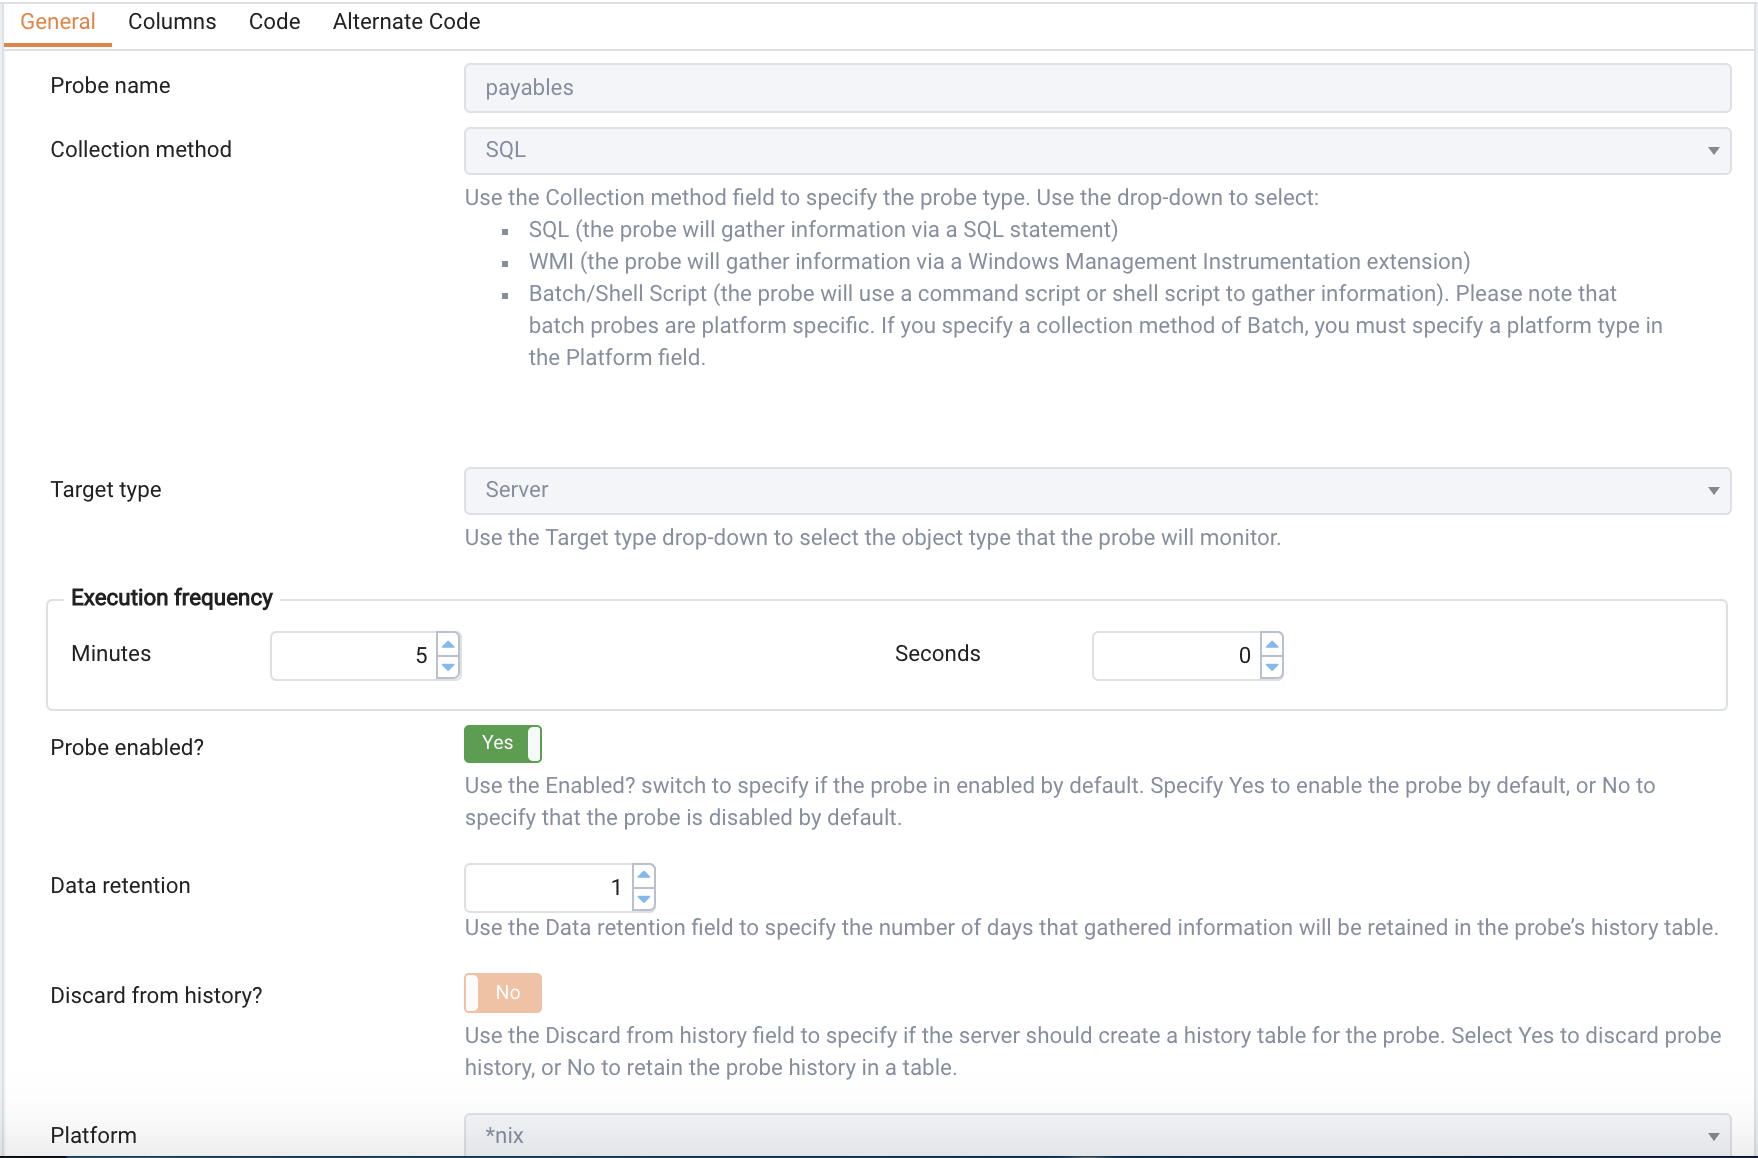
Use the fields on the General tab (see Figure 4.22) to modify the definition of an existing probe or to specify the properties of a new probe:
|
•
|
Use the Probe Name field to provide a name for a new probe.
|
|
•
|
Use the Collection method field to specify the probe type. Use the drop-down listbox to select:
|
|
•
|
SQL - the probe will gather information via a SQL statement.
|
|
•
|
WMI - the probe will gather information via a Windows Management Instrumentation extension.
|
|
•
|
Batch - the probe will use a command-script or shell-script to gather information.
|
|
•
|
Use the Target Type drop-down listbox to select the object type that the probe will monitor. Target type is disabled if Collection method is WMI.
|
|
•
|
Use the Minutes and Seconds selectors to specify how often the probe will collect data.
|
|
•
|
Use the Probe Enable? switch to specify if the probe in enabled by default. Specify Yes to enable the probe by default, or No to specify that the probe is disabled by default.
|
|
•
|
Use the Data Retention field to specify the number of days that gathered information will be retained in the probe's history table.
|
|
•
|
Use the switch next to Discard from history to specify if the server should create a history table for the probe. Select Yes to discard probe history, or No to retain the probe history in a table.
|
|
•
|
Use the Platform drop-down listbox to specify the type of platform that the probe will monitor. This field is enabled only when the Collection method is Batch.
|
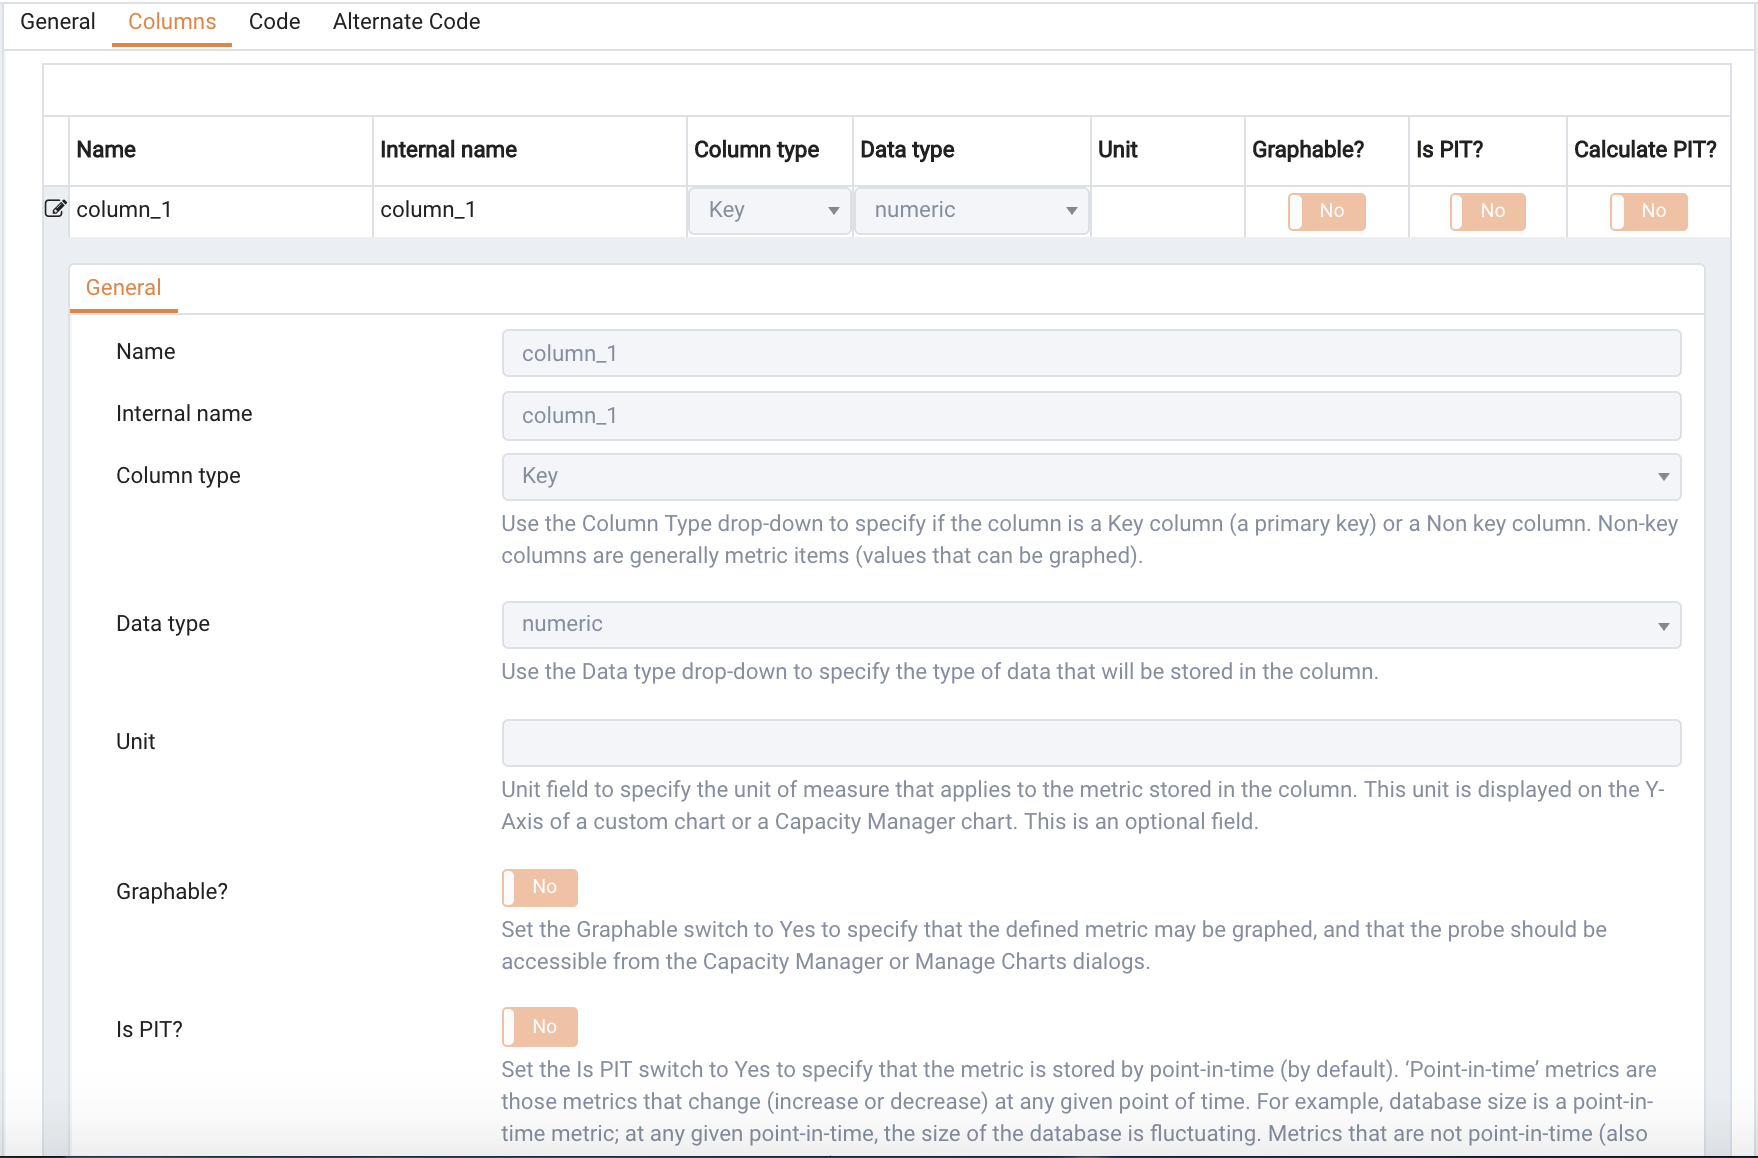
Use the Columns tab (see Figure 4.23) to define the columns in which the probe data will be stored. Navigate to the
Columns tab, and click the
Add button (in the upper-right corner) to define a new column. After a providing a column name in the
Name field, click the
Edit button (to the left of the new column name) to provide information about the column:
|
•
|
The Internal Name field is not enabled for user-defined probes.
|
|
•
|
Use the Column Type drop-down listbox to specify if the column is a Key column (a primary key) or a Non key column. Non-key columns are generally metric items (values that can be graphed).
|
|
•
|
Use the Data Type drop-down listbox to specify the type of data that will be stored in the column.
|
|
•
|
Use the Unit field to specify the unit of measure that applies to the metric stored in the column. This unit is displayed on the Y-Axis of a custom chart or a Capacity Manager chart. This is an optional field.
|
|
•
|
Use the Graphable switch to specify if the defined metric may be graphed, and that the probe should be accessible from the Capacity Manager or Manage Charts dialogs.
|
|
•
|
Use the Is PIT switch to specify if the metric should be stored by point-in-time.
|
|
•
|
Use the Calculate PIT switch to specify that the server should calculate a point-in-time value for the metric data. Calculate PIT is disabled if Is PIT is Yes.
|
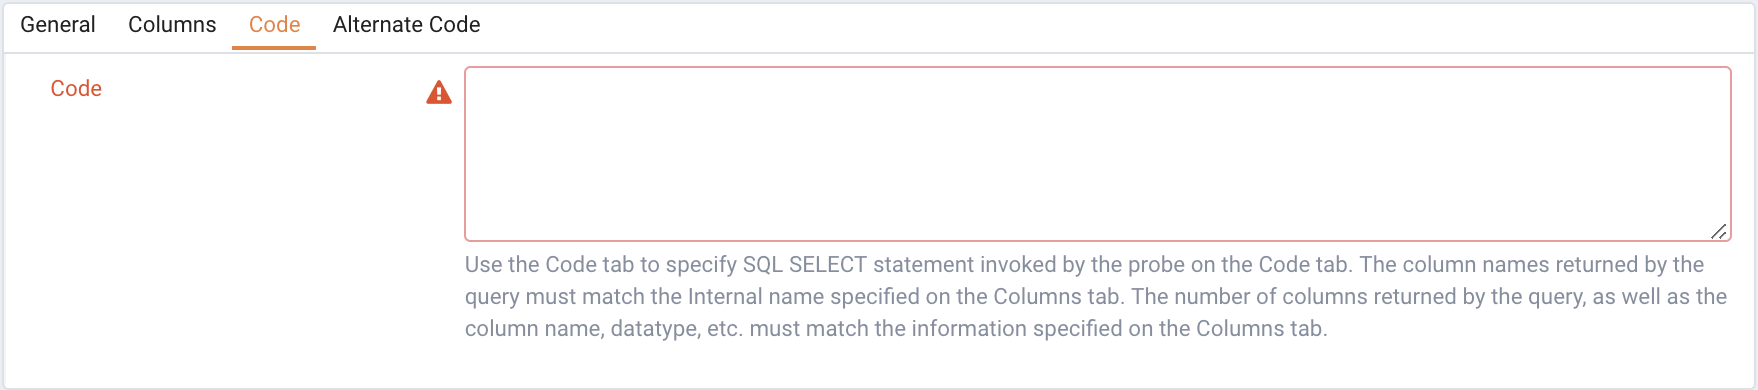
Use the Code tab (see Figure 4.24) to specify the default code that will be executed by the probe:
|
•
|
If the probe is a SQL probe, you must specify the SQL SELECT statement invoked by the probe on the Code tab. The column names returned by the query must match the Internal Name specified on the Column tab. The number of columns returned by the query, as well as the column name, data type, etc. must match the information specified on the Columns tab.
|
|
•
|
If the probe is a WMI probe, you must specify the WMI query as a SELECT WMI query. The column name referenced in the SELECT statement should be same as the name of the corresponding column specified on the Column tab. The column names returned by the query must match the Internal Name specified on the Column tab. The number of columns returned by the query, as well as the column name, data type, etc. must match the information specified on the Columns tab.
|
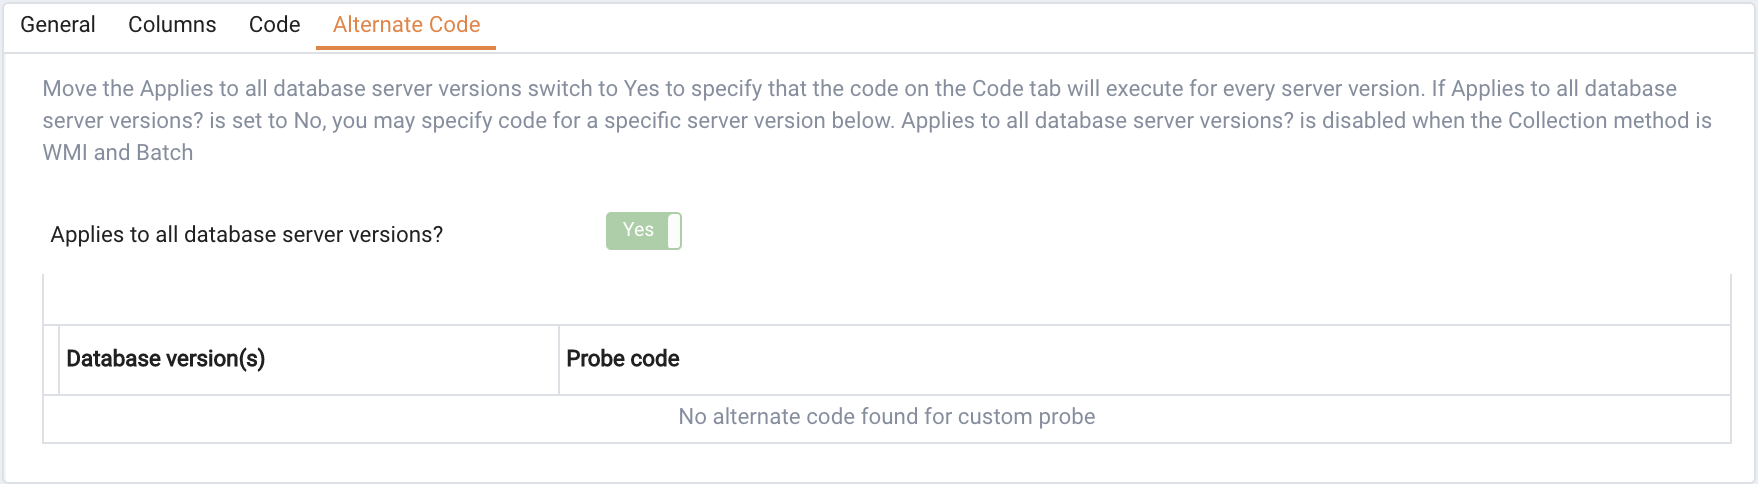
Use the Alternate Code tab (see Figure 4.25) to provide code that will be invoked if the probe fires on a specific version of the server. To provide version-specific code, move the
Applies to any server version? switch to
No, and click the
Add button. Then, select a version with the
Database Version(s) drop-down listbox; click the
Edit button (to the left of the version name) to provide the code that will execute when the probe fires.
You can use the Copy Probe Configuration… dialog to copy probe definitions from one monitored object to one or more monitored objects of the same type. To open the
Copy Probe Configuration... dialog, highlight the object from which you are copying probes in the PEM client tree control, and select
Manage Probes from the
Management menu. When the
Manage Probes tab opens, click on
Copy Probe to open the
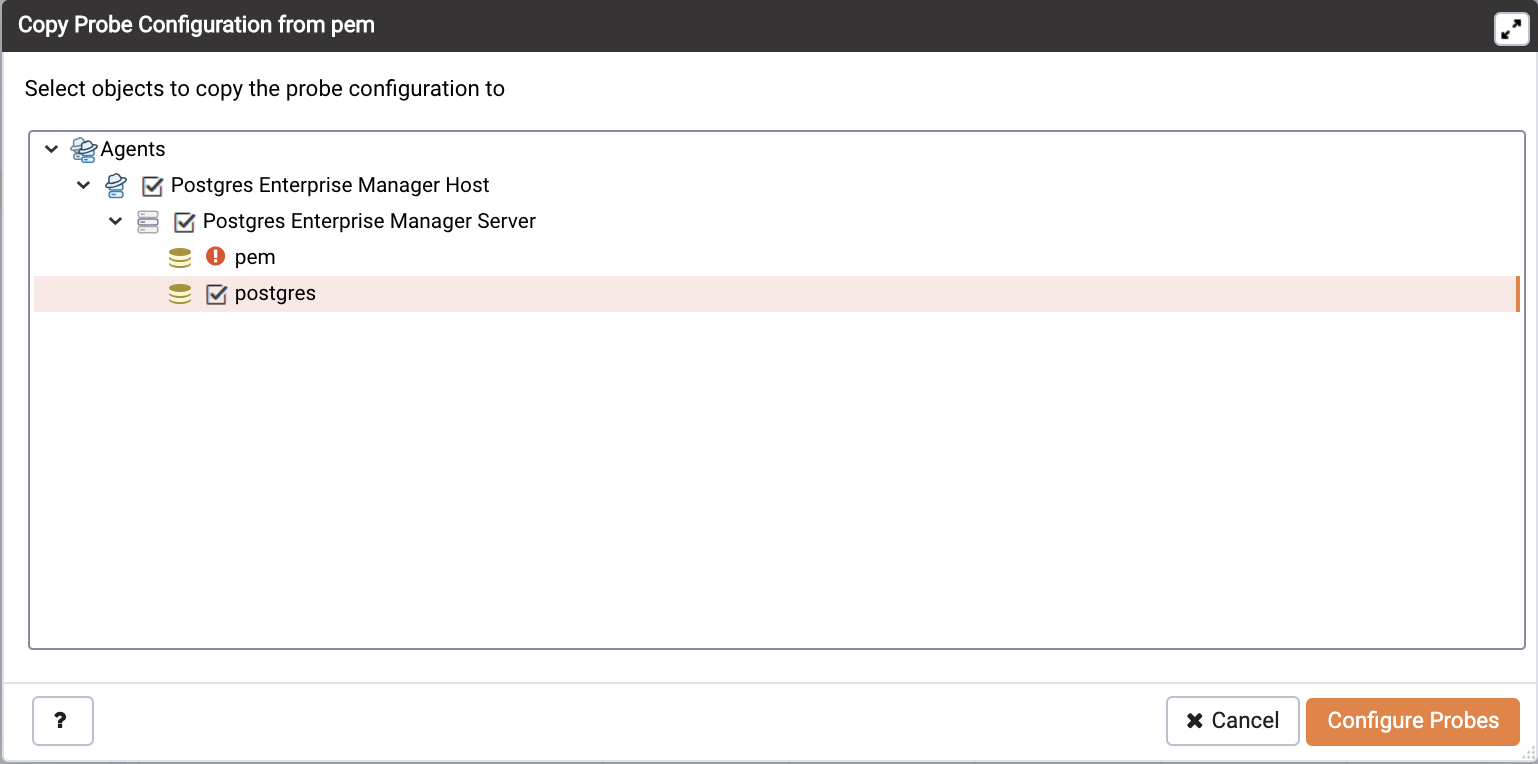
Copy Probe Configuration dialog:
Note that if you specify a parent node in the Copy Probe Configuration tree control, PEM will copy the probe configurations to each object (of the same type) that resides under that node in the tree control. For example, to copy the probe definitions from one schema to all schemas that reside within a database, select only the parent database of the target schemas. Please note that a red warning symbol is displayed to the left of the name of a listed target object if that object is the source of the probe that is being copied.
Use the Dashboards menu (on the
Monitoring tab) to access the
Alerts Dashboard. The
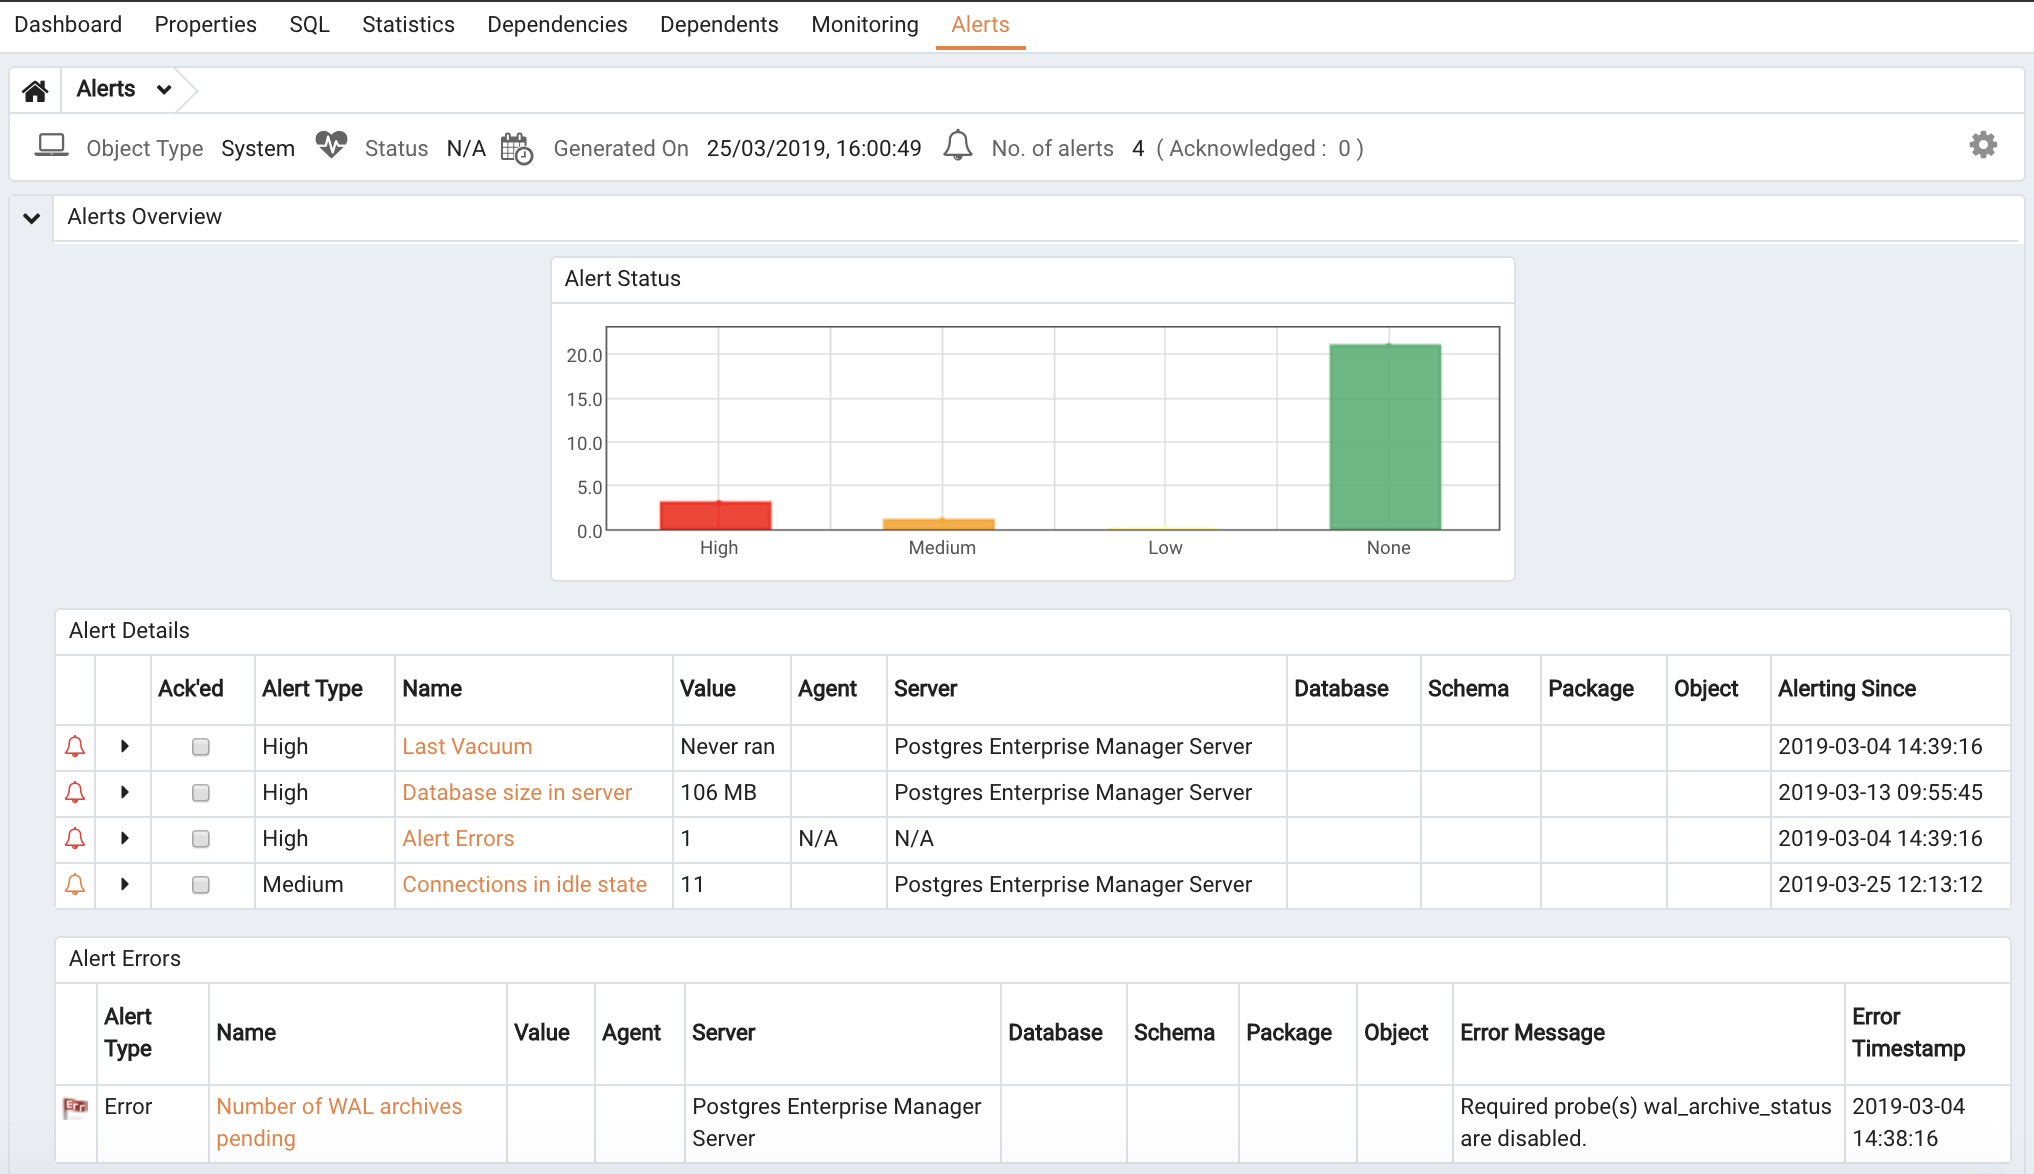
Alerts Dashboard (see Figure 4.31) displays a summary of the active alerts and the status of each alert:
The Alerts Dashboard header displays the date and time that the dashboard was last updated, and the number of current alerts.
The Alerts Overview section displays a graphic representation of the active alerts, as well as a count of the current high, low and medium alerts. The vertical bar on the left of the graph provides the count of the alerts displayed in each column. Hover over a bar to display the alert count for the selected alert severity in the upper-right hand corner of the graph.
The Alert Details table provides a list of the alerts that are currently triggered. The entries are prioritized from high-severity to lower-severity; each entry includes information that will allow you to identify the alert and recognize the condition that triggered the alert. Click the name of an alert to review detailed information about the alert definition.
The Alert Errors table displays configuration-related errors (eg. accidentally disabling a required probe, or improperly configuring an alert parameter). You can use the information provided in the
Error Message column to identify and resolve the conflict that is causing the error.
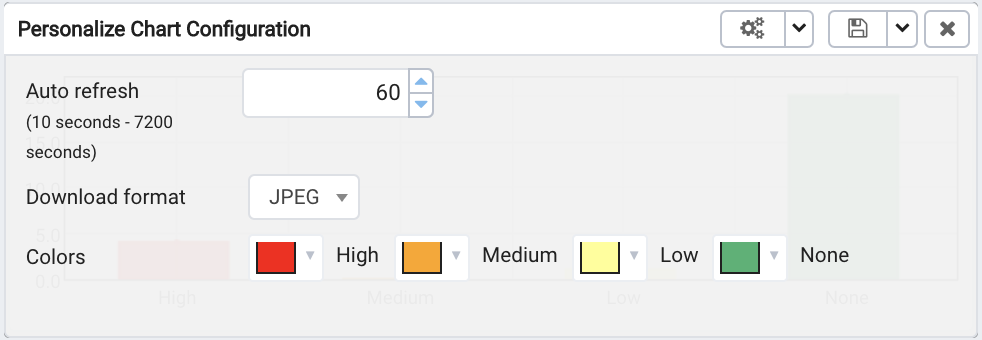
Figure 4.32 - Customizing a chart.
Use fields on the Personalize chart configuration dialog (Figure 4.32) to provide your display preferences:
|
•
|
Use the Auto Refresh field to specify the number of seconds between updates of the data displayed in the table or chart.
|
|
•
|
If applicable, use the Download as field to indicate if you would like a chart to be downloaded as a JPEG image or a PNG image.
|
|
•
|
If applicable, set the Show Acknowledged Alerts switch to Yes indicate that you would like the table to display alerts that you have acknowledged with a checkbox in the Ack'ed column. Set the field to No to indicate that the table should hide any acknowledged alerts. The switch acts as a toggle; acknowledged alerts are not purged from the table content until the time specified in the alert definition passes.
|
To save your customizations, click the Save icon (a check mark) in the upper-right corner; to delete any previous changes and revert to the default values, click the
Delete icon. The
Save and
Delete drop-down menus allow you to specify if your preferences should be applied to
All Dashboards, or to a selected server or database.
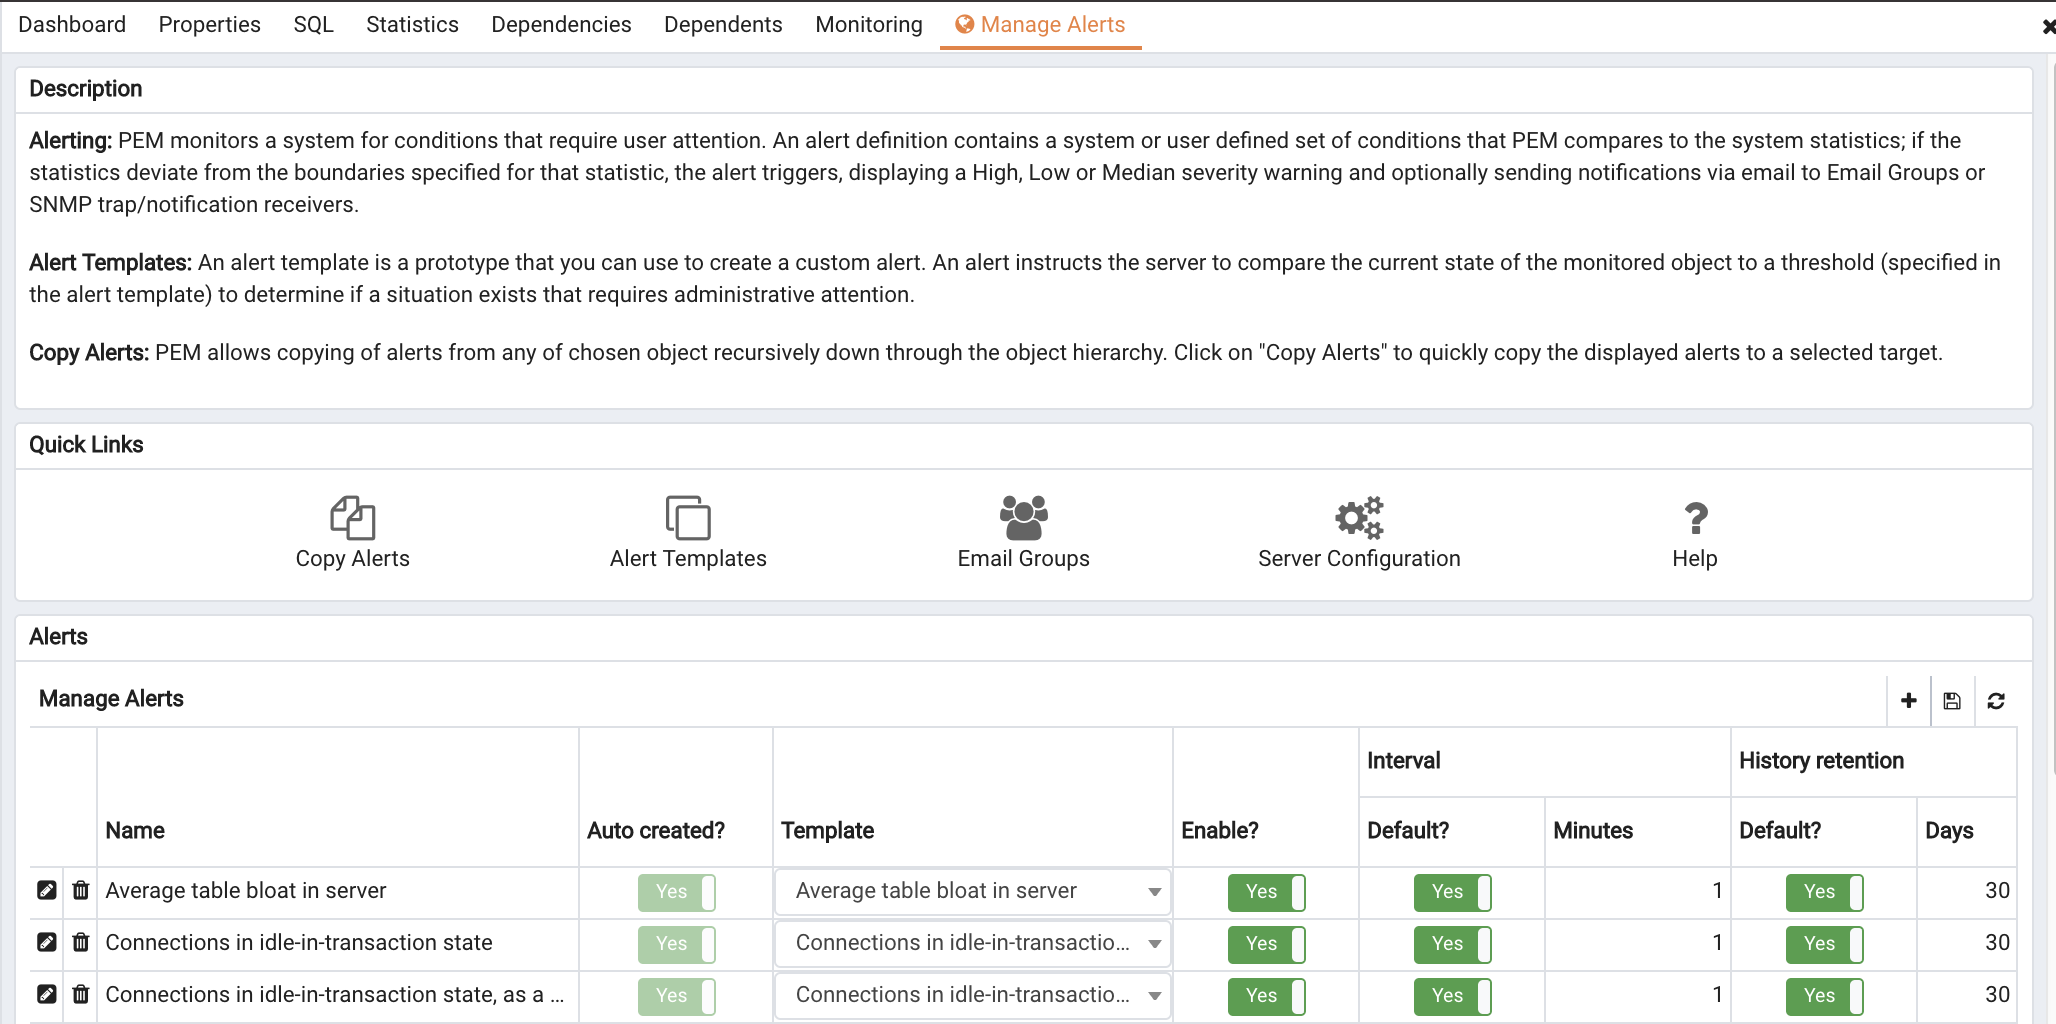
Use the PEM Client's Manage Alerts tab to define, copy, or manage alerts. To open the
Manage Alerts tab (shown in Figure 4.33), select
Manage Alerts from the
Management menu.
Use the Quick Links toolbar to open dialogs and tabs that will assist you when managing alerts:
|
•
|
Click Copy Alerts to open the Copy Alert Configuration dialog and copy an alert definition.
|
|
•
|
Click Alert Templates to open the Alert Template tab, and modify or create an alert template.
|
|
•
|
Click Email Groups to open the Email Groups tab, and modify or create an email group.
|
|
•
|
Click Server Configurations to open the Server configuration dialog and review or modify server configuration settings.
|
Use the table in the Alerts section of the
Manage Alerts tab to create new alerts or manage existing alerts.
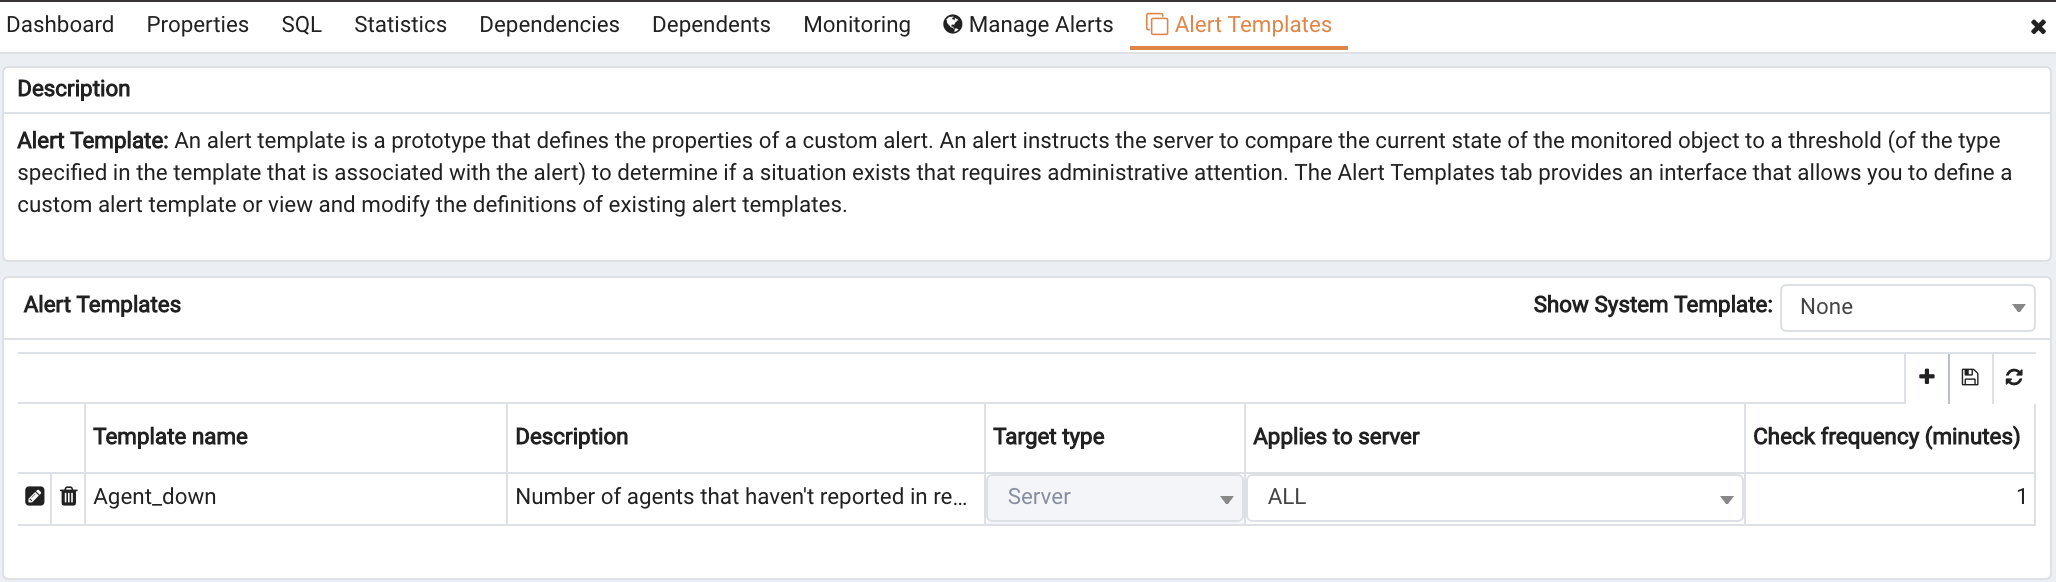
You can use the Alert Templates tab (shown in Figure 4.34) to define a custom alert template or view the definitions of existing alert templates. To open the
Alert Templates tab, select the
Manage Alerts... menu option from the
Management menu. When the
Manage Alerts tab opens, select
Alert Templates from the
Quick Links toolbar.
Use the Show System Template drop-down listbox to filter the alert templates that are displayed in the
Alert Templates table. Use the listbox to select a level of the PEM hierarchy to view all of the templates for the selected level.
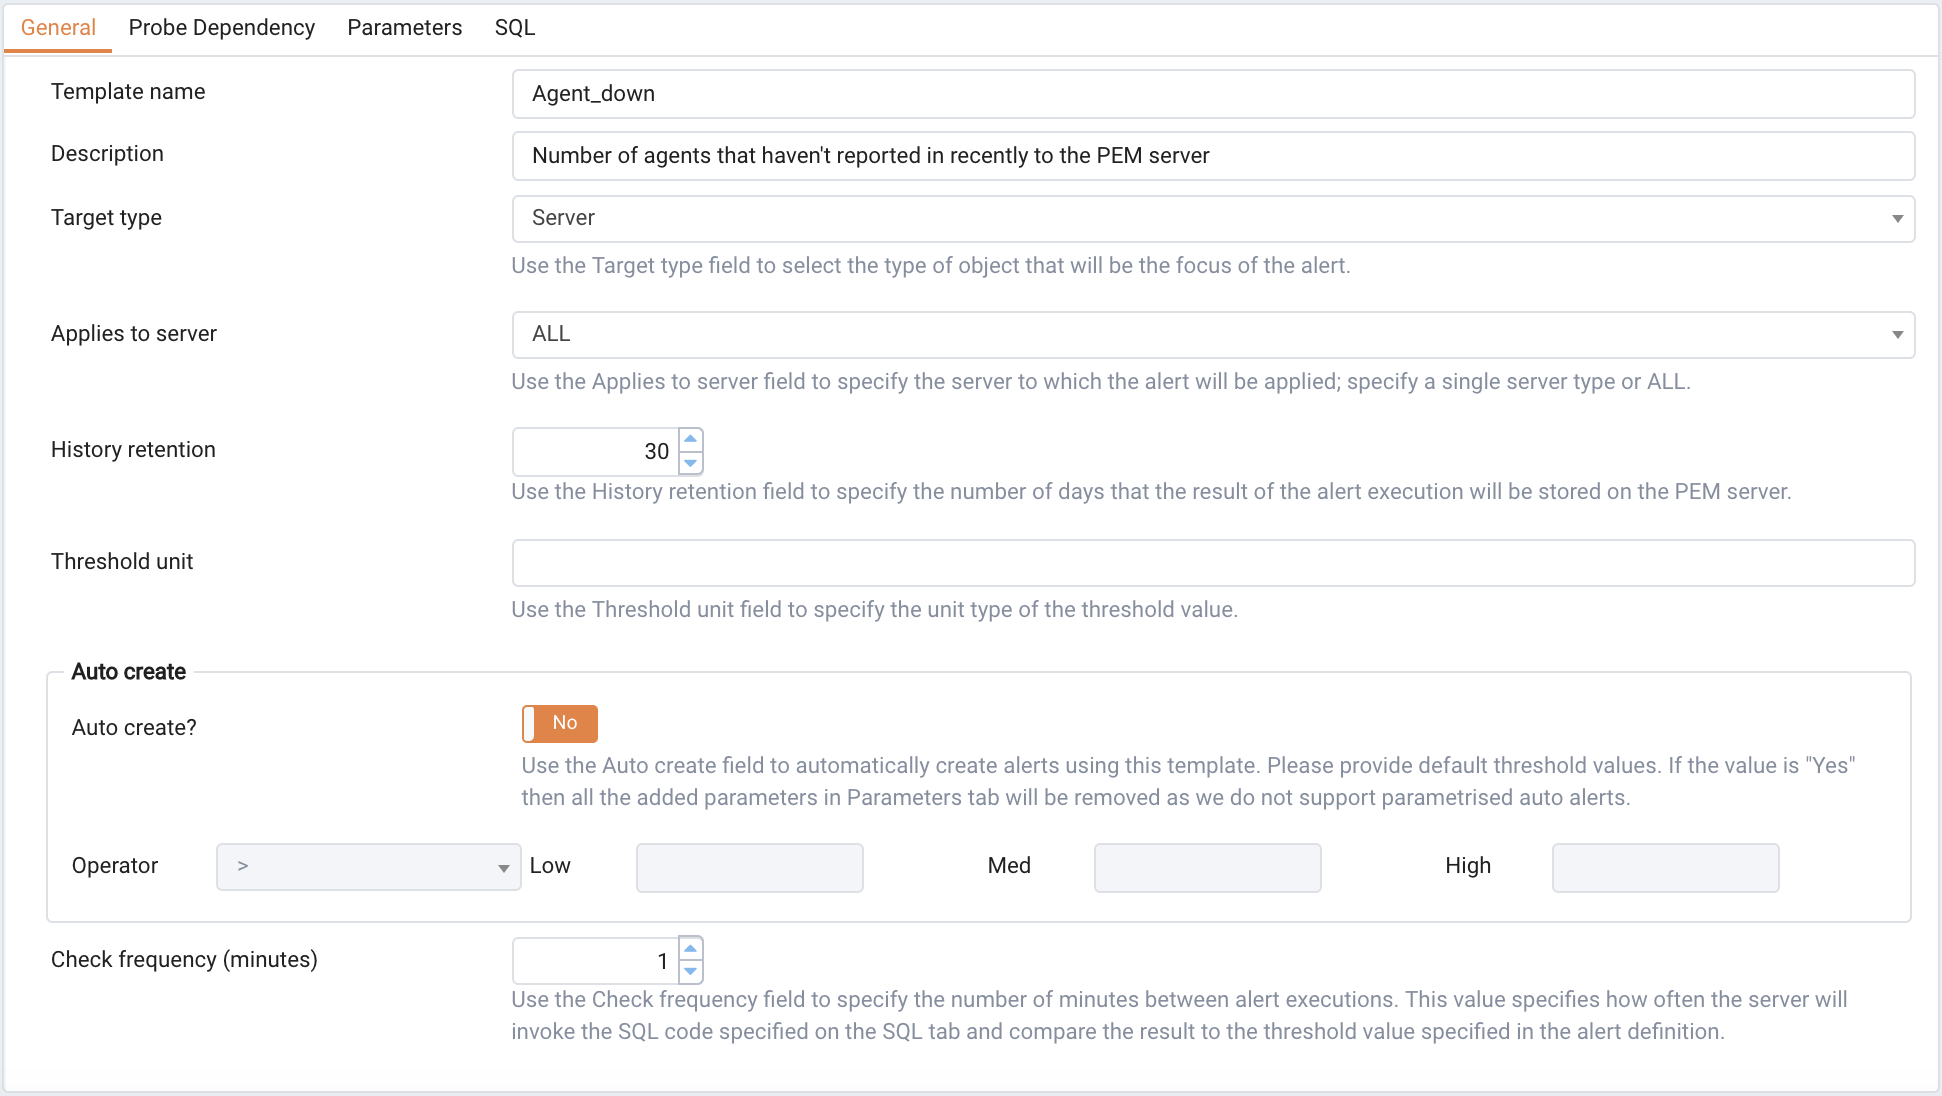
To define a new alert template, use the Show System Template drop-down listbox to select
None, and click the
Add icon (
+) located in the upper-right corner of the alert
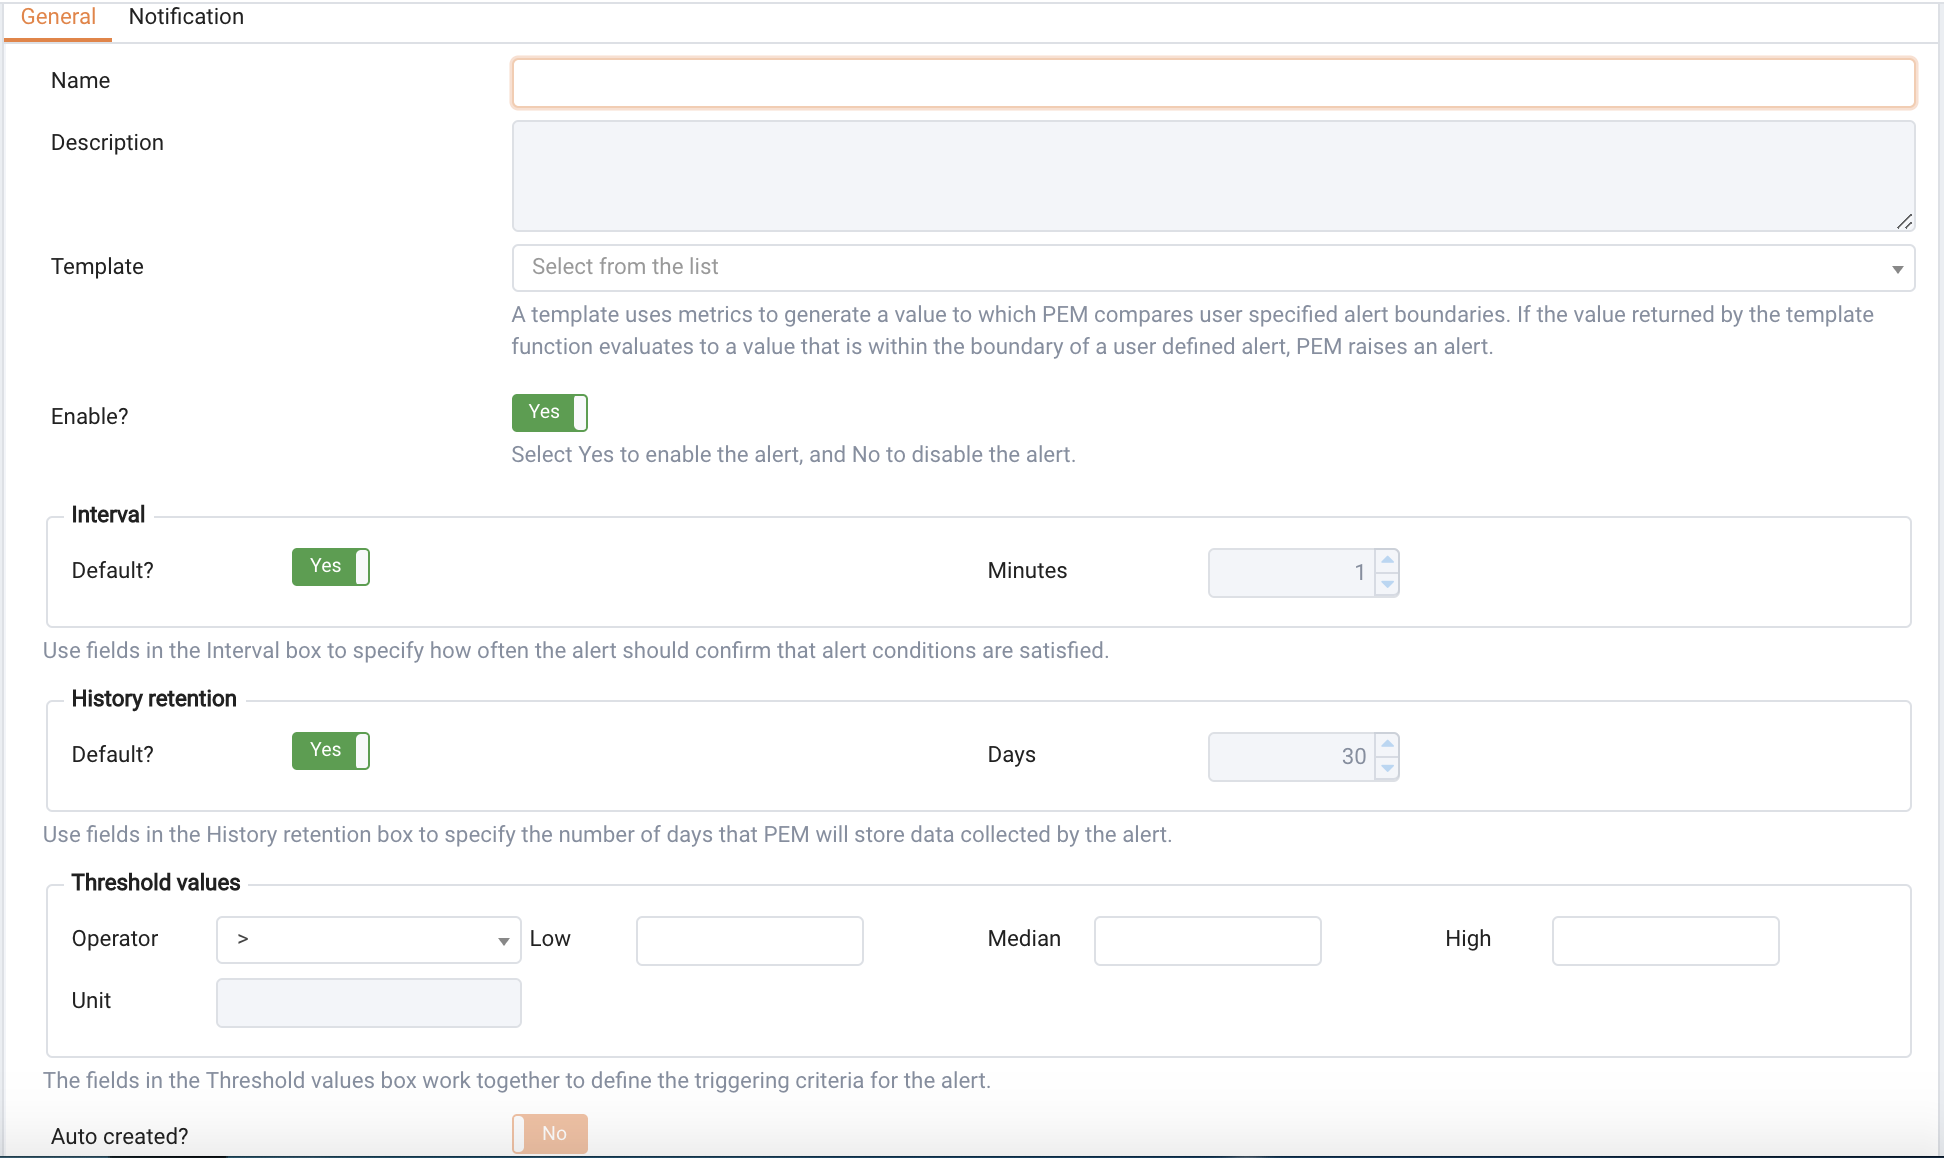
template table. The alert template editor opens as shown in Figure 4.35.
|
•
|
Use the Template name field to specify a name for the new alert template.
|
|
•
|
Use the Description field to provide a description of the alert template.
|
|
•
|
Use the Target type drop-down listbox to select the type of object that will be the focus of the alert.
|
|
•
|
Use the Applies to server drop-down listbox to specify the server type (EDB Postgres Advanced Server or PostgreSQL) to which the alert will be applied; you can specify a single server type, or ALL.
|
|
•
|
Use the History retention field to specify the number of days that the result of the alert execution will be stored on the PEM server.
|
|
•
|
Use the Threshold unit field to specify the unit type of the threshold value.
|
|
•
|
Use fields in the Auto create box to indicate if PEM should use the template to generate an automatic alert. If enabled, PEM will automatically create an alert when a new server or agent (as specified by the Target type drop-down listbox) is added, and delete that alert when the target object is dropped.
|
|
o
|
Move the Auto create? slider to Yes to indicate that PEM should automatically create alerts based on the template. If you modify an existing alert template, changing the Auto create? slider from No to Yes, PEM will create alerts on the existing agents and servers. Please note that if you change the slider from Yes to No, the default threshold values in existing alerts will be erased, and cannot be recovered.
|
|
o
|
Use the Operator drop-down listbox to select the operator that PEM will use when evaluating the current system values.
|
|
•
|
Use the Check frequency field to specify the default number of minutes between alert executions. This value specifies how often the server will invoke the SQL code specified in the definition and compare the result to the threshold value specified in the template.
|
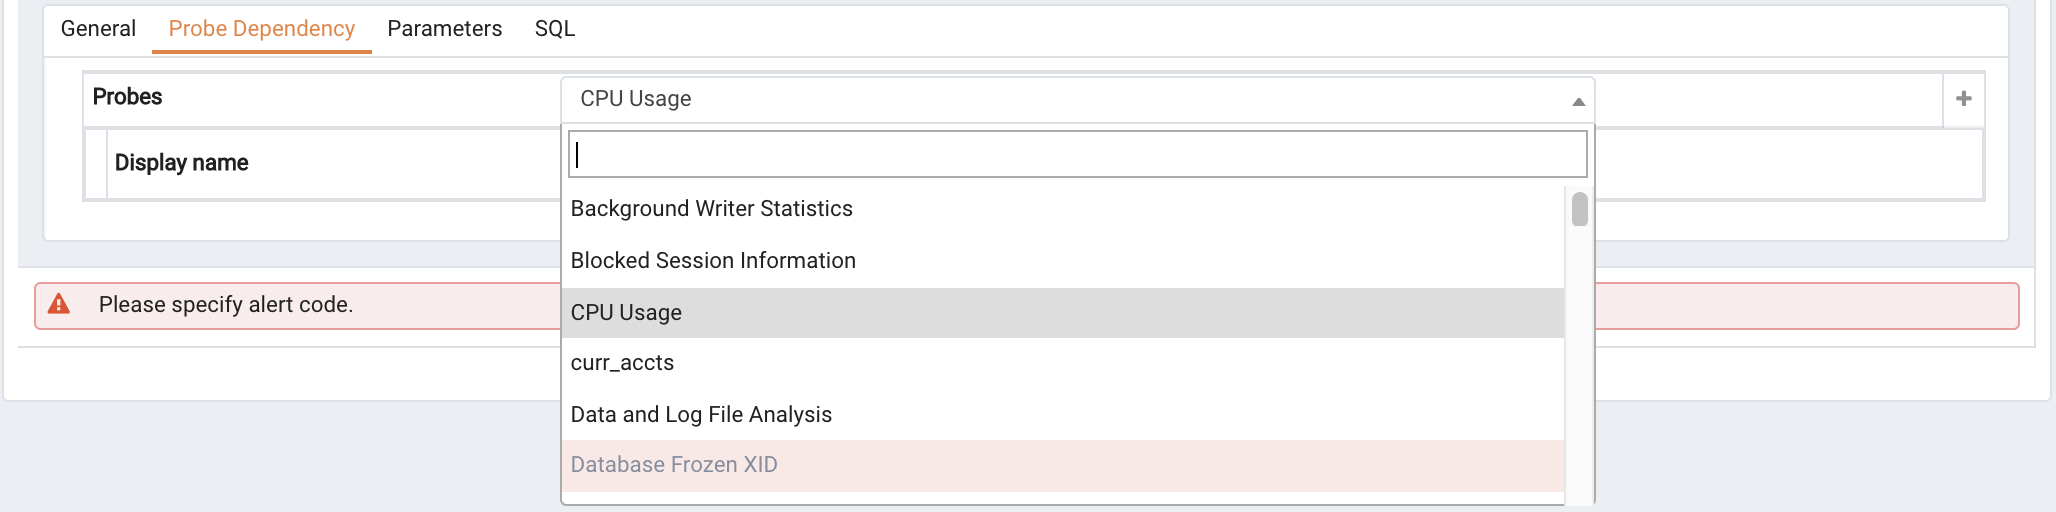
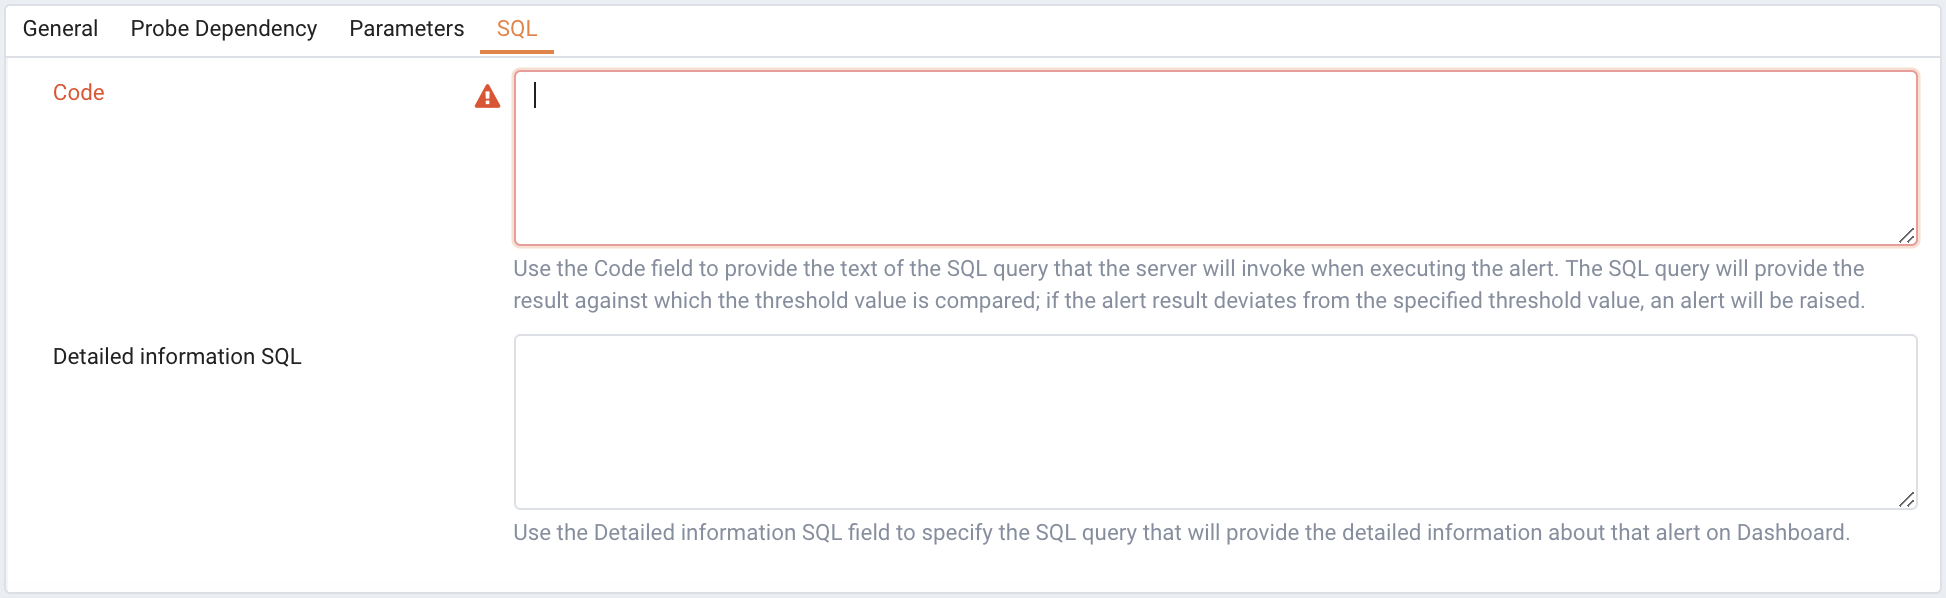
Use the fields on the Probe Dependency tab (see Figure 4.36) to specify the names of probes referred to in the SQL query specified on the
SQL tab:
|
•
|
Use the Probes drop-down listbox to select from a list of the available probes; highlight a probe name, and click the Add button to add the probe to the list of probes used by the alert template. To remove a probe from the selected probes list, highlight the probe name, and click the Delete icon.
|
|
•
|
Use fields on the Parameters tab (see Figure 4.37) to define the parameters that will be used in the SQL code specified on the SQL tab. Click the Add icon ( +) and:
|
Use the Name field to specify the parameter name.
Use the Data type drop-down listbox to specify the type of parameter.
Use the Unit field to specify the type of unit specified by the parameter.
|
•
|
Use the Code field on the SQL tab (shown in Figure 4.38) to provide the text of the SQL query that the server will invoke when executing the alert. The SQL query will provide the result against which the threshold value is compared; if the alert result deviates from the specified threshold value, an alert will be raised.
|
Within the query, parameters defined on the Parameters tab should be referenced sequentially by the variable
param_x, where
x indicates the position of the parameter definition within the parameter list. For example,
param_1 refers to the first parameter in the parameter list,
param_2 refers to the second parameter in the parameter list, and so on.
|
•
|
Use the Detailed Information SQL field to provide a SQL query that will be invoked if the alert is triggered. The result set of the query may be displayed as part of the detailed alert information on the Alerts dashboard or Global Overview dashboard.
|
Click the Save icon to save the alert template definition and add the template name to the
Alert Templates list. After saving a custom alert template, you can use the
Alerting dialog to define an alert based on the template.
Highlight a Template Name in the list, and click the
Edit icon (at the left end of the row) to review the template definition.
Use the tabs on the Alert Templates dialog to view detailed information about the alert template:
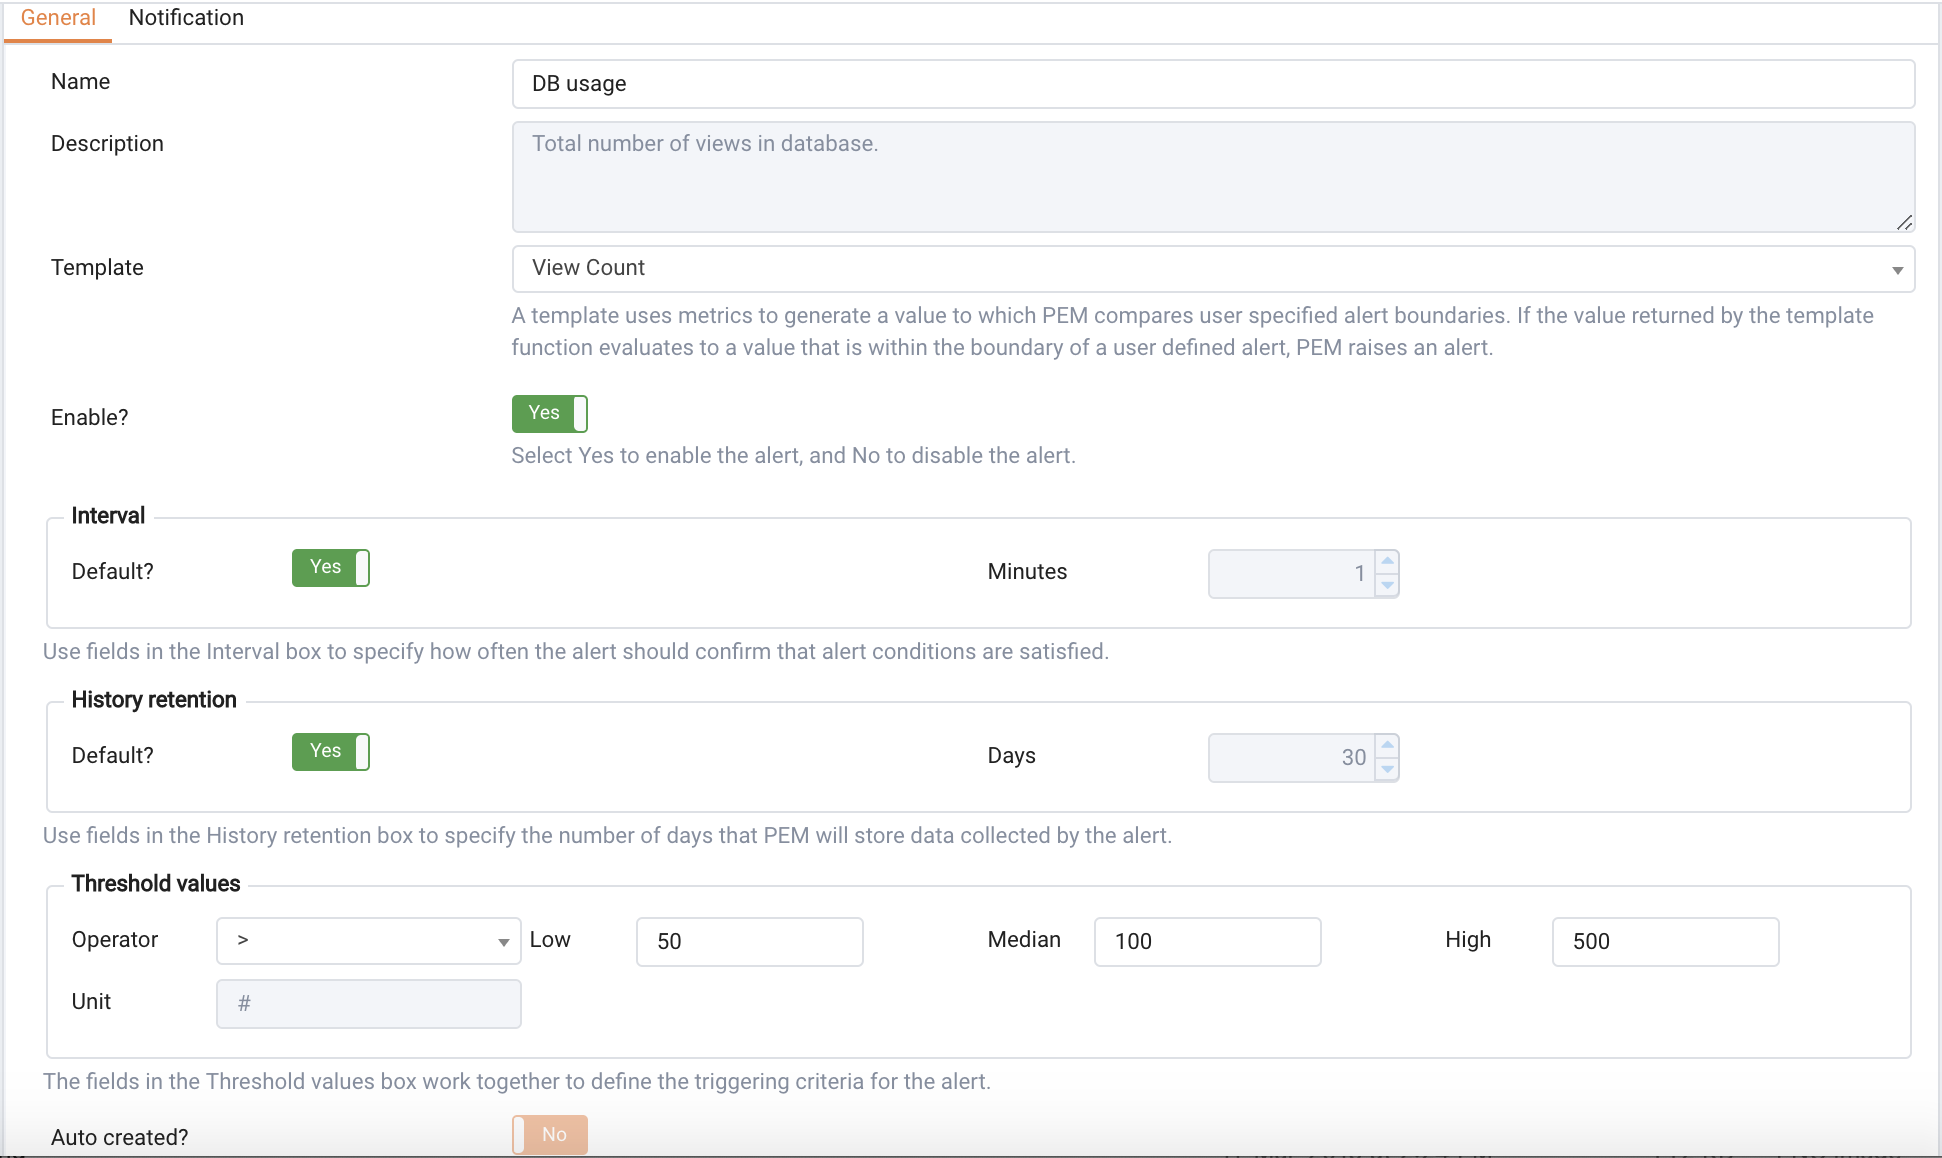
The Manage Alerts tab displays a table of alerts that are defined on the object currently selected in the PEM client tree control. You can use the
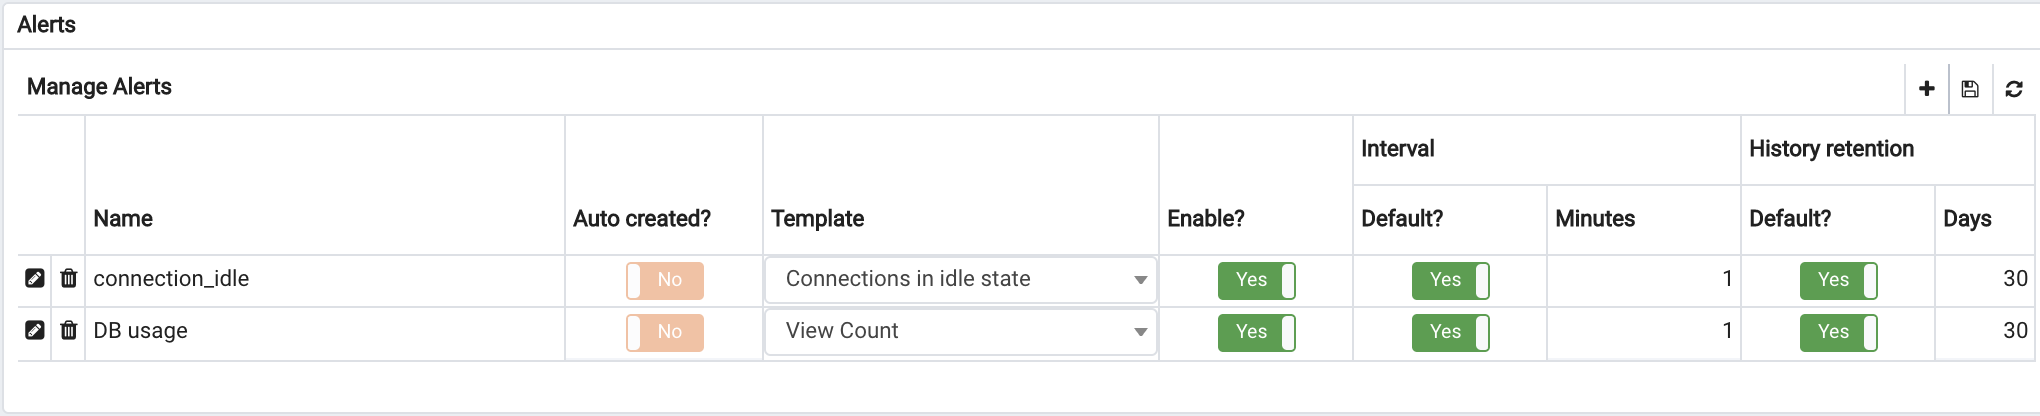
Alerts table to modify an existing alert, or to create a new alert (see Figure 4.39).
|
•
|
Use the drop-down listbox in the Template field to select a template for the alert. An alert template is a function that uses one (or more) metrics or parameters to generate a value to which PEM compares user-specified alert boundaries. If the value returned by the template function evaluates to a value that is within the boundary of a user-defined alert (as specified by the Operator and Threshold values fields), PEM raises an alert, adds a notice to the Alerts overview display, and performs any actions specified on the template.
|
|
•
|
Use the Enable? switch to specify if the alert is enabled ( Yes) or disabled ( No).
|
|
•
|
Use the controls in the Interval box to specify how often the alert should confirm if the alert conditions are satisfied. Use the Minutes selector to specify an interval value. Use the Default switch to set or reset the Minutes value to the default (recommended) value for the selected template.
|
|
•
|
Use controls in the History retention box to specify the number of days that PEM will store data collected by the alert. Use the Days selector to specify the number of days that the data will be stored. Use the Default switch to set or reset the Days value to the default value (30 days).
|
|
•
|
Use controls in the Threshold values box to define the triggering criteria for the alert. When the value specified in the Threshold Values fields evaluates to greater-than or less-than the system value (as specified with the Operator), PEM will raise a Low, Medium or High level alert:
|
|
•
|
Use the Operator drop-down listbox to select the operator that PEM will use when evaluating the current system values:
|
The Parameter Options table contains a list of parameters that are required by the selected template; the table displays both pre-defined parameters, and parameters for which you must specify a value. Please note that you must specify a value for any parameter that displays a prompt in the
Value column.
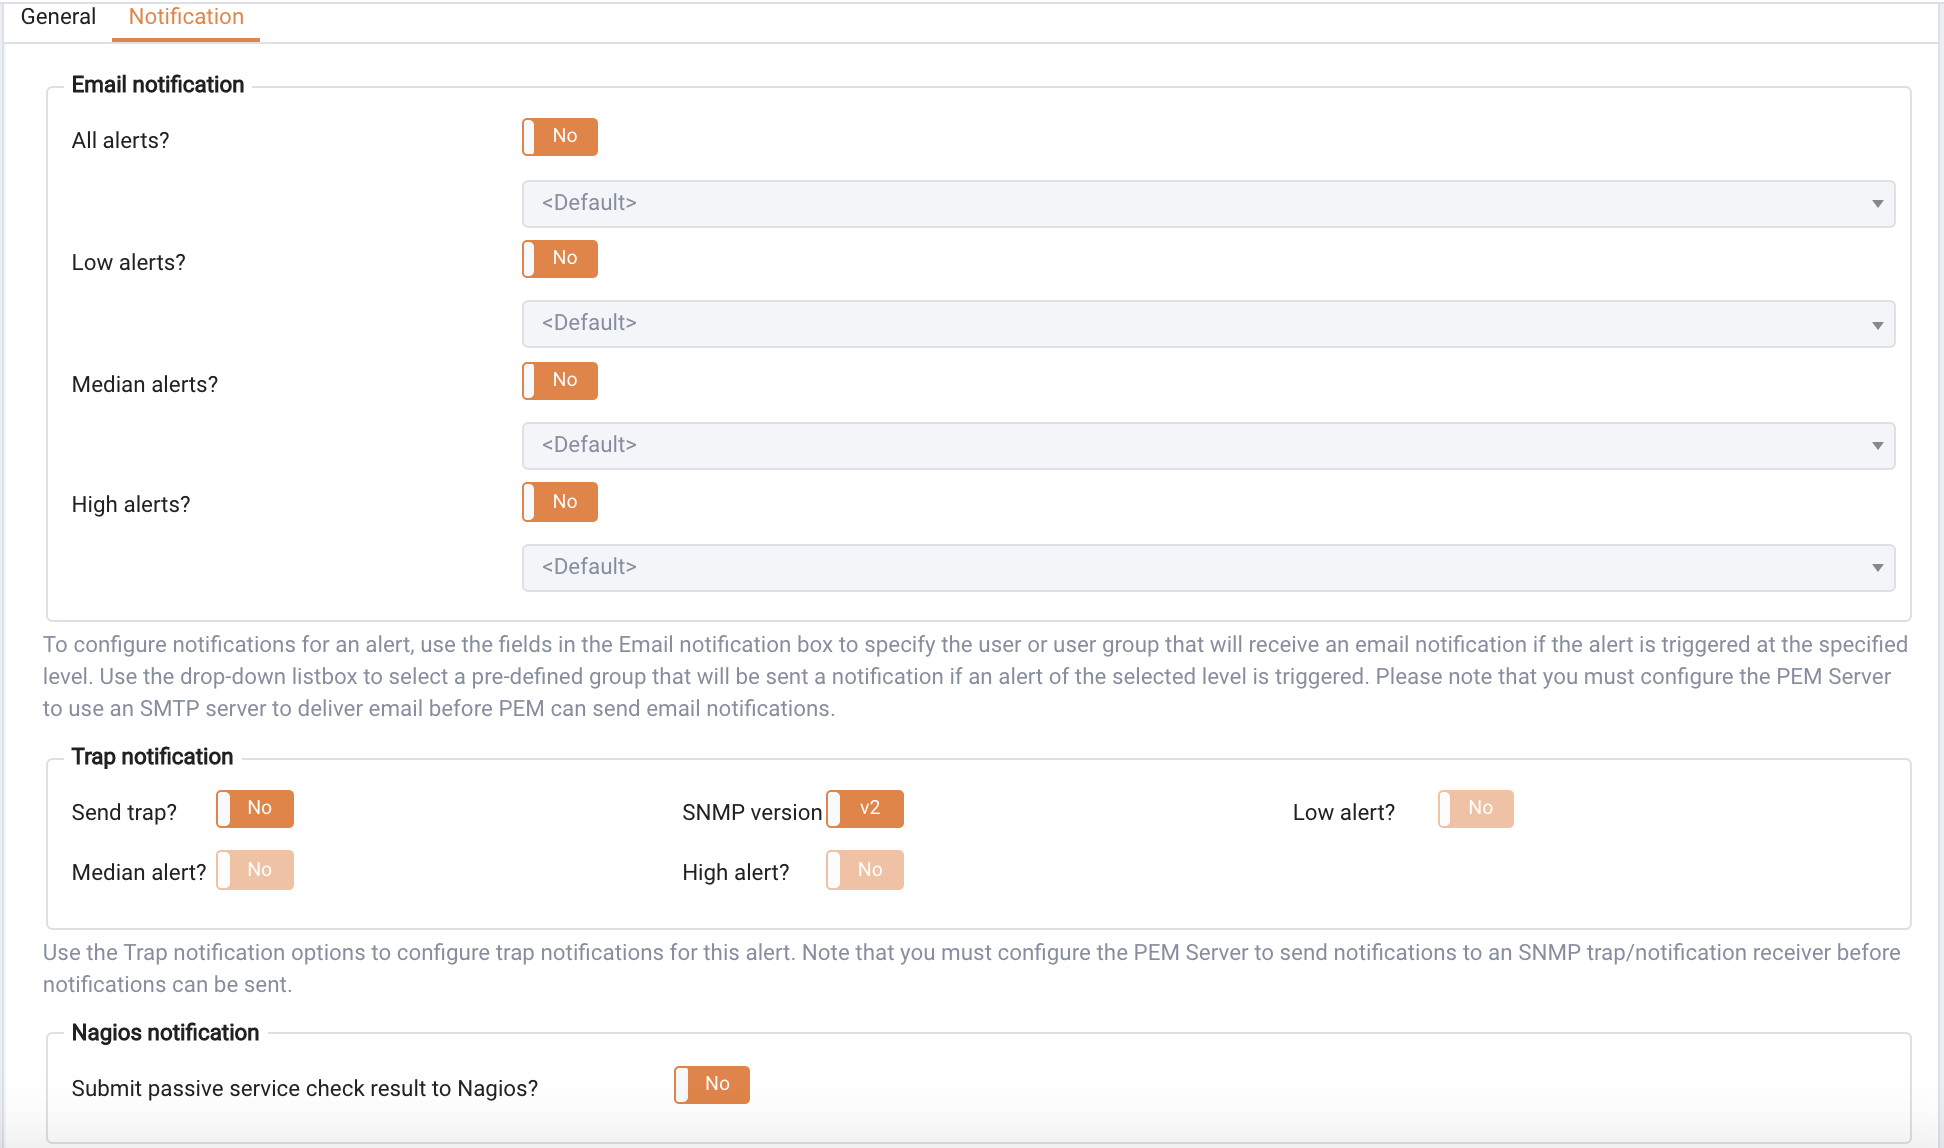
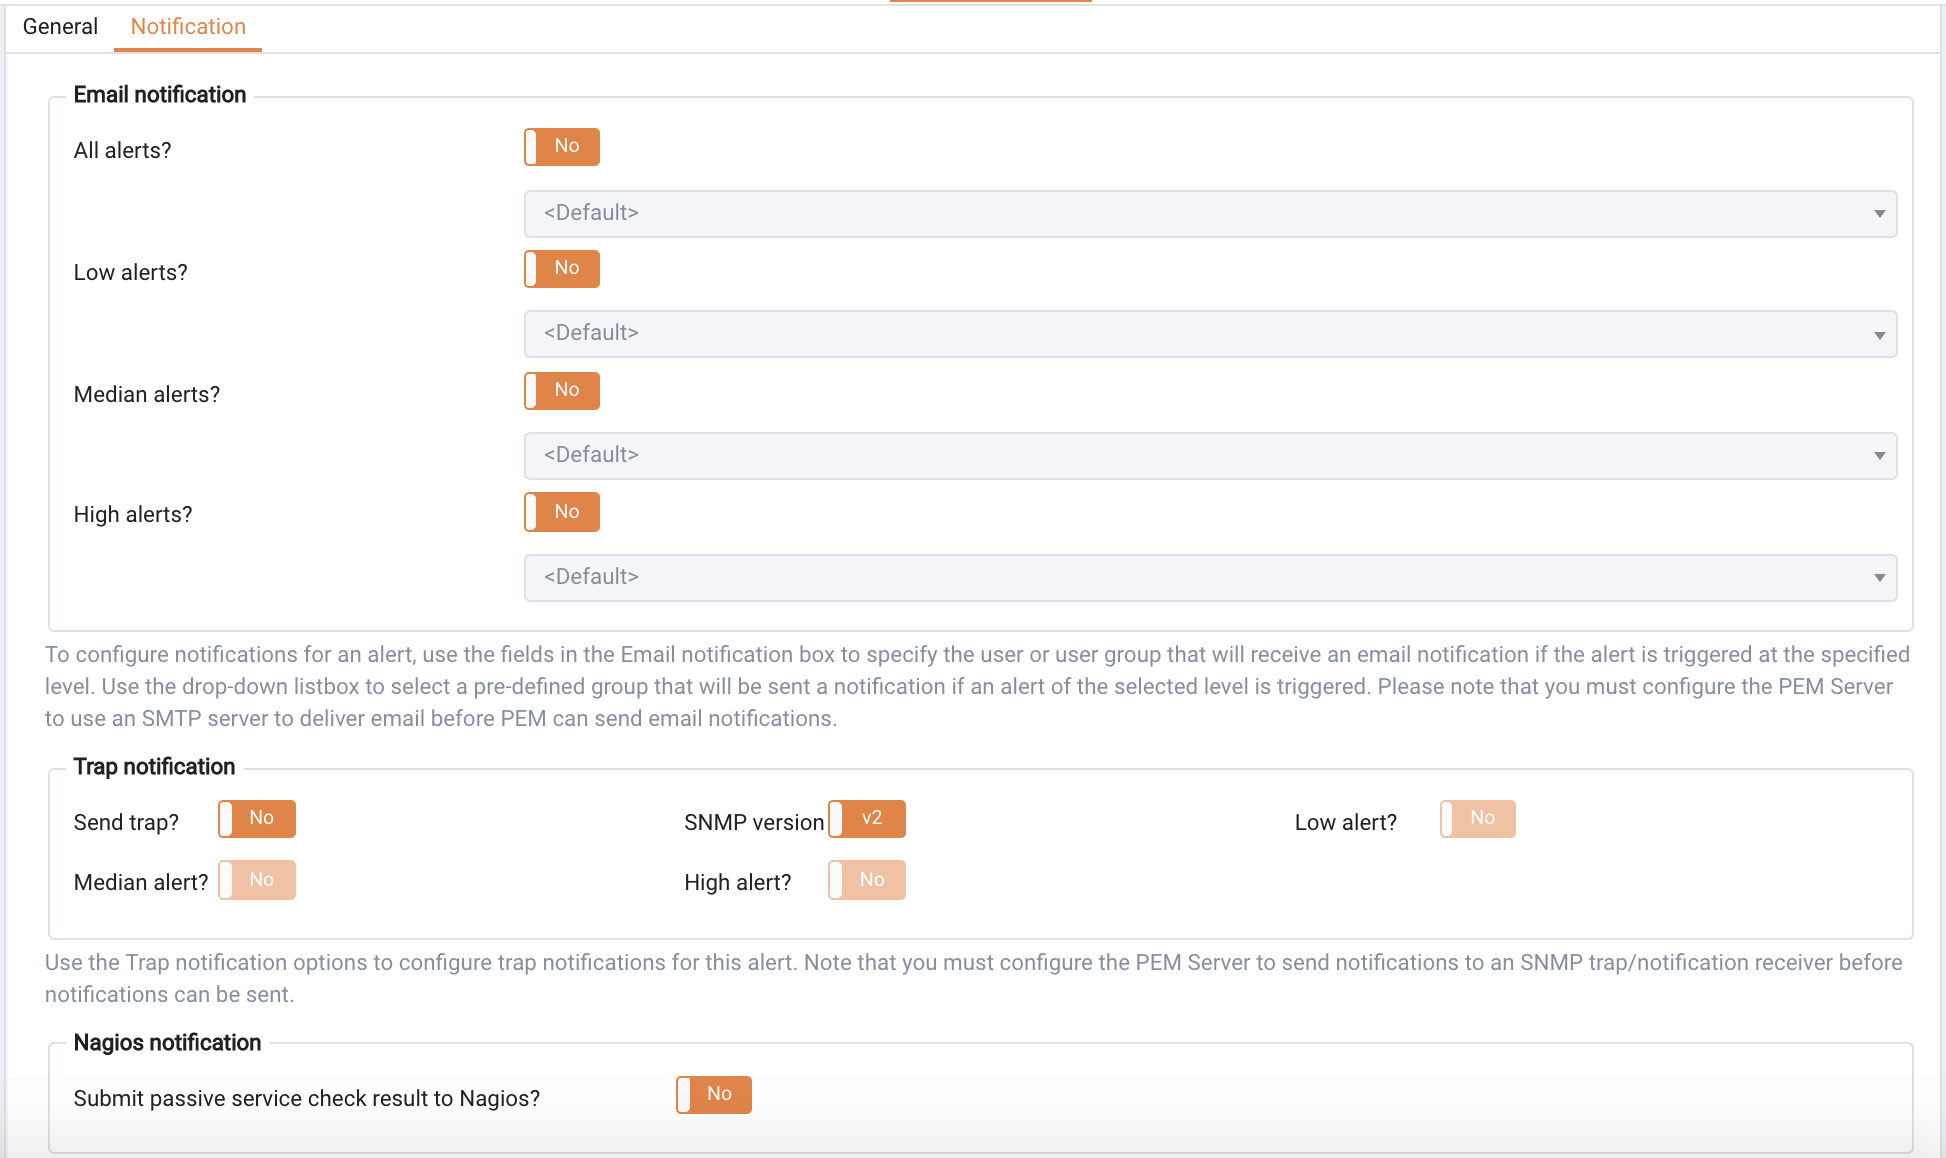
Use the fields in the Email notification box to specify the email group that will receive an email notification if the alert is triggered at the specified level. Use the
Email Groups tab to create an email group that contains the address of the user or users that will be notified when an alert is triggered. To access the
Email Groups tab, click the
Email Groups icon located in the
Quick Links menu of the
Manage Alerts tab.
Use the Trap notification options to configure trap notifications for this alert:
|
•
|
Set the Send trap slider to Yes to send SNMP trap notifications when the state of this alert changes.
|
|
•
|
Set the SNMP Ver slider to v1 or v2 to identify the SNMP version.
|
|
•
|
Use the Low alert, Med alert and High alert sliders to select the level(s) of alert that will trigger the trap. For example, if you set the slider next to High alert to Yes, PEM will send a notification when an alert with a high severity level is triggered.
|
Use the field in the Nagios notification* box to instruct the PEM server to notify Nagios network-alerting software when the alert is triggered or cleared. For detailed information about configuring and using Nagios with PEM, please see Section
4.5.3.
|
•
|
Set the Submit passive service check result to Nagios switch to Yes to instruct the PEM server to notify Nagios when the alert is triggered or cleared.
|
Use the fields in the Script execution box to (optionally) define a script that will be executed if an alert is triggered, and to specify details about the script execution.
|
•
|
Set the Execute script slider to Yes to instruct PEM to execute the provided script if an alert is triggered.
|
|
•
|
Set the Execute on alert cleared slider to Yes to instruct PEM to execute the provided script when the situation that triggered the alert has been resolved.
|
%AlertName% - this placeholder will be replaced with the name of the triggered alert.
%ObjectName% - this placeholder will be replaced with the name of the server or agent on which the alert was triggered.
%ThresholdValue% - this placeholder will be replaced with the threshold value reached by the metric when the alert triggered.
%CurrentValue% - this placeholder will be replaced with the current value of the metric that triggered the alert.
%CurrentState% - this placeholder will be replaced with the current state of the alert.
%OldState% - this placeholder will be replaced with the previous state of the alert.
%AlertRaisedTime% - this placeholder will be replaced with the time that the alert was raised, or the most recent time that the alert state was changed.
Use the Alerts table to manage an existing alert or create a new alert. Highlight an object in the PEM client tree control to view the alerts that monitor that object.
|
•
|
The Alert name column displays the name of the alert; to change the alert name, simply replace the name in the table, and click the save icon.
|
|
•
|
The Alert template column displays the name of the alert template that specifies properties used by the alert. You can use the drop-down listbox to change the alert template associated with an alert.
|
|
•
|
Use the Alert enable? switch to specify if an alert is enabled ( Yes) or disabled ( No).
|
|
•
|
Use the Interval column to specify how often PEM should check to see if the alert conditions are satisfied. Set the Default switch to No and specify an alternate value (in Minutes), or return the Default switch to Yes to reset the value to its default setting. By default, PEM will check the status of each alert once every minute.
|
|
•
|
Use the History retention field to specify the number of days that PEM will store data collected by the alert. Set the Default* switch to No and specify an alternate value (in Days), or return the Default switch to Yes to reset the value to its default setting. By default, PEM will recommend storing historical data for 30 days.
|
Use fields on the Alert details dialog
(see Figure 4.43) to modify the definition of the selected alert. When you've finished modifying the alert definition, click
Save to preserve your changes, or
Cancel to exit the dialog without saving any changes.
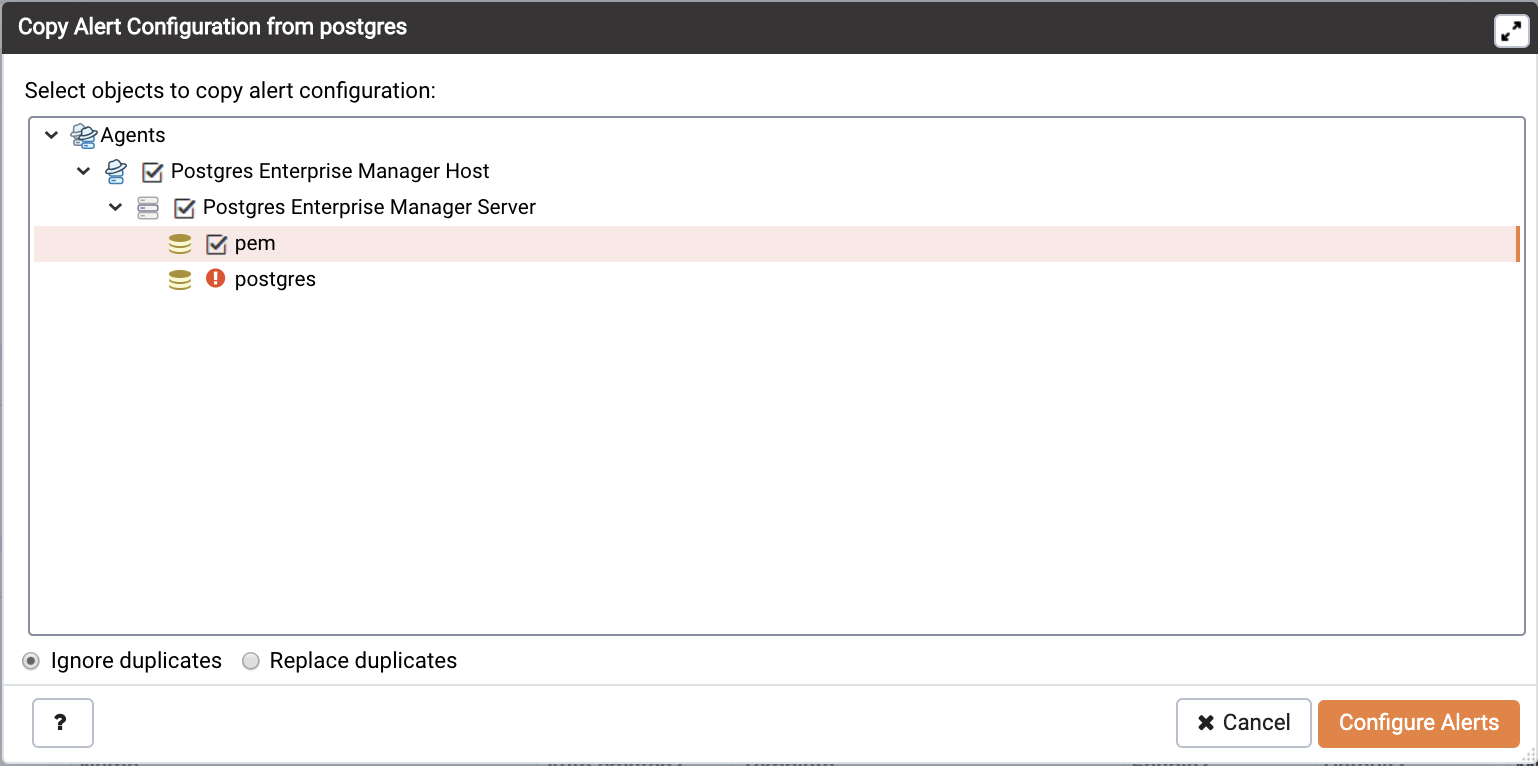
The Copy Alert Configuration dialog copies all alerts from the object highlighted in the PEM client tree control to the object or objects selected on the dialog. Expand the tree control to select a node or nodes to specify the target object(s). The tree control displays a red warning indicator next to the source object.
Check the Ignore duplicates radio button to prevent PEM from updating any existing alerts on the target objects with the same name as those being copied. Use the
Replace duplicates option to replace existing alerts with alerts of the same name from the source object.
Click the Configure Alerts button to proceed to copy the alerts from the source object to all objects of the same type in, or under those objects selected on the
Copy Alert Configuration dialog.
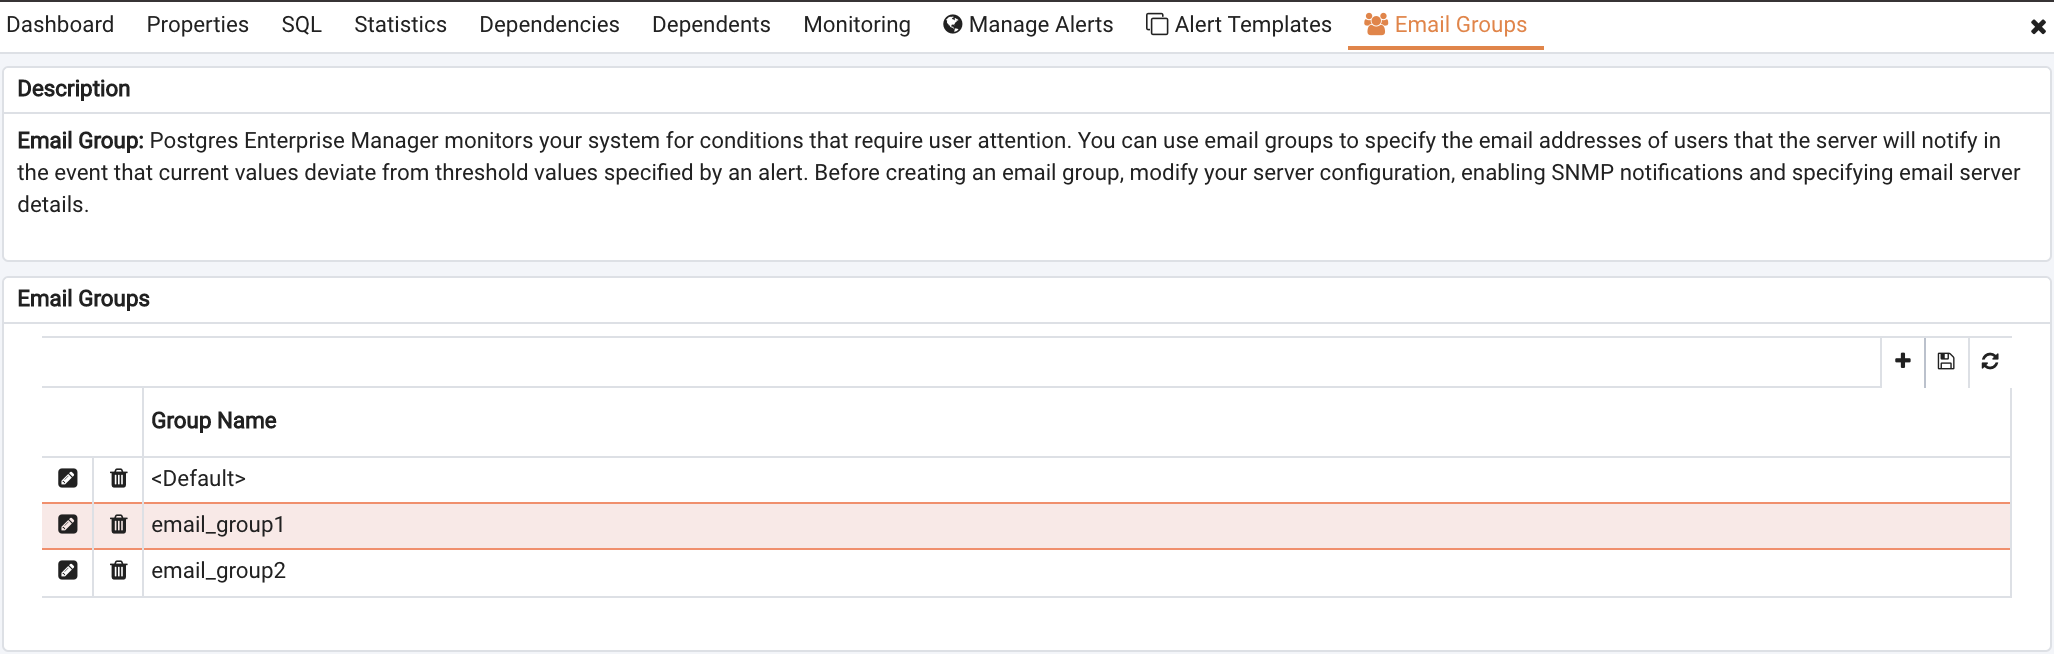
Use the Email Groups tab to configure groups of SMTP email recipients. To access the
Email Groups tab, select
Manage Alerts... from the PEM client's
Management menu; when the
Manage Alerts tab opens, select
Email Groups from the
Quick Links toolbar.
The Email Groups tab displays a list of the currently defined email groups (see Figure
4.46). Highlight a group name and click the Edit icon (at the far left end of the row) to modify an existing group.
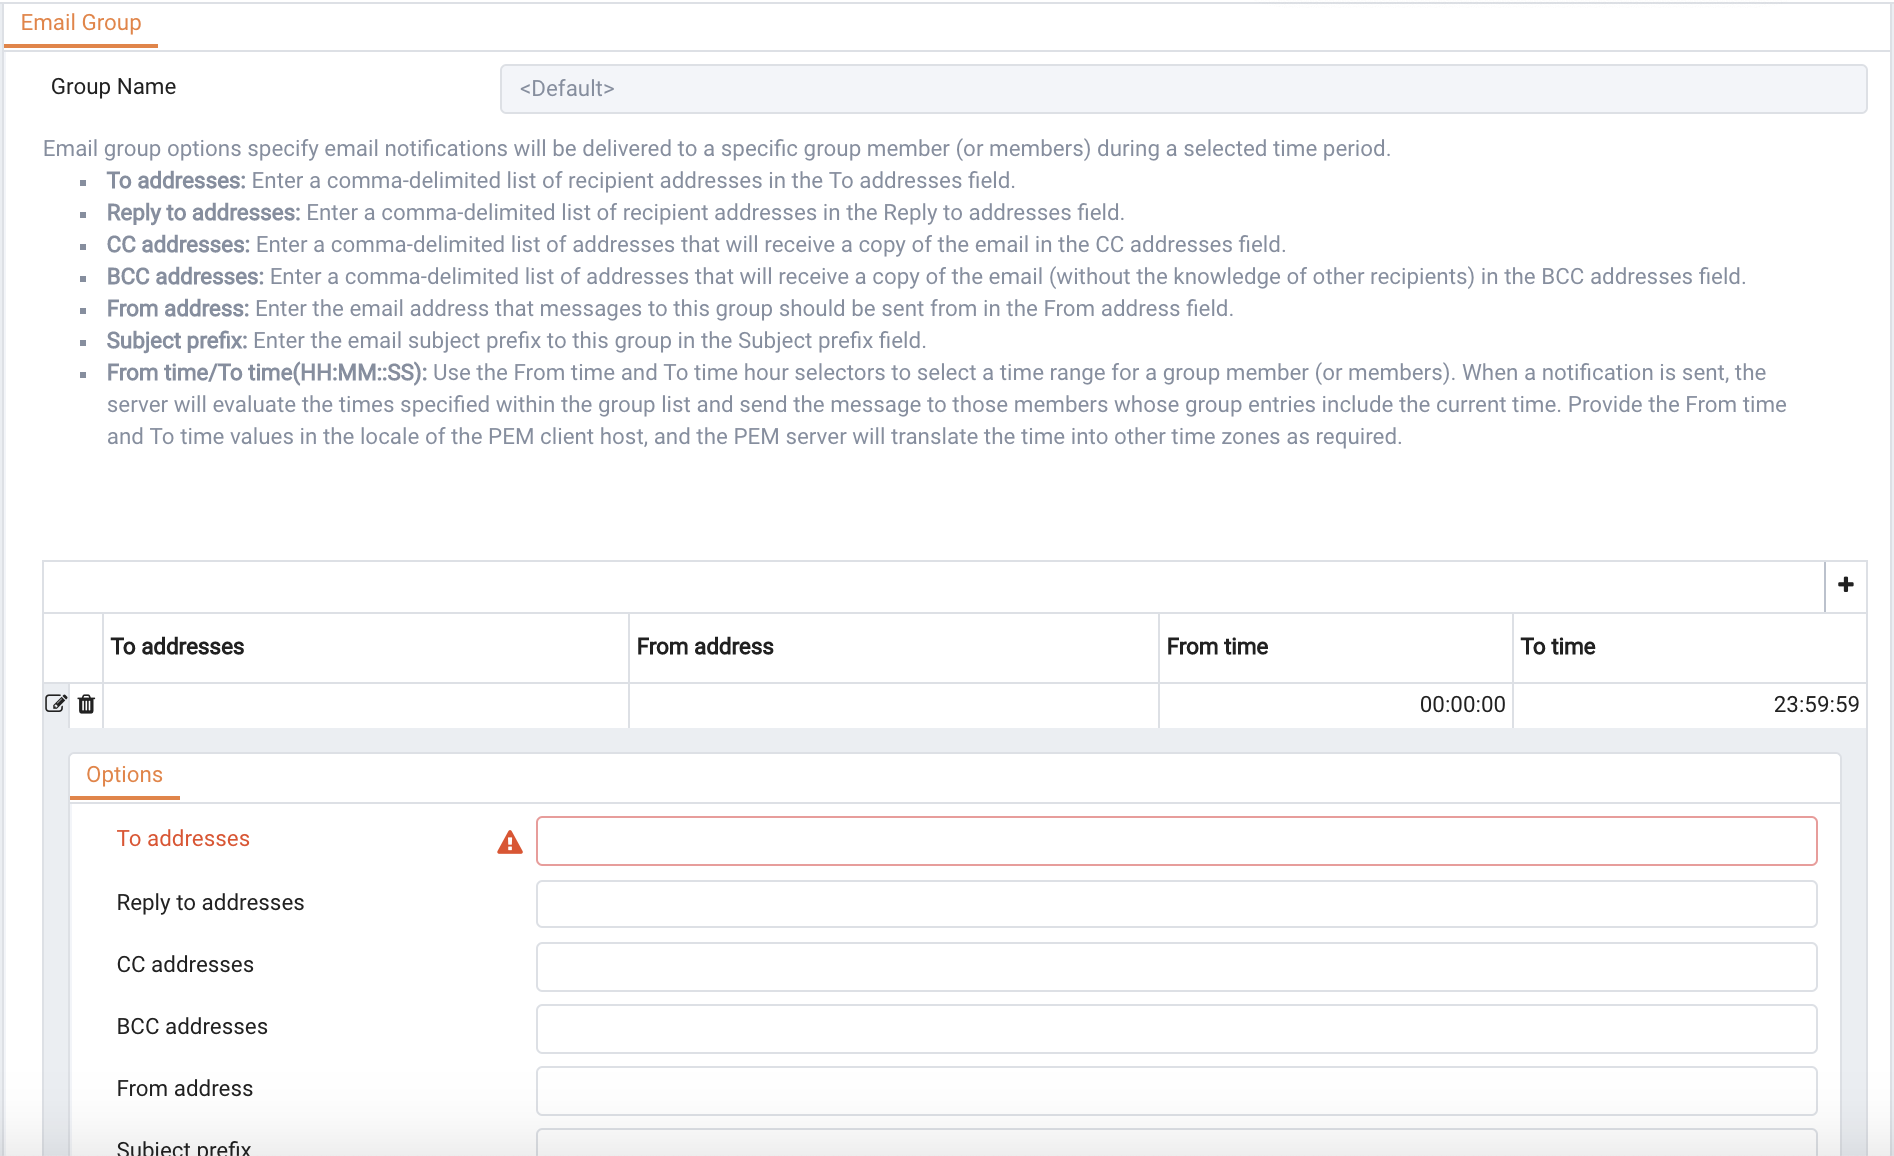
Use the Email Group dialog to define an email group and its members:
Click the Add icon (+) in the group members table to open the
Options tab, and add the member addresses that will receive notifications for the time period specified:
|
•
|
Use the Subject prefix field to provide a message that will be added to the start of each subject line when a notification is sent.
|
|
•
|
Use the From Time and To Time time selectors to specify the time range for notifications to the group member(s) that are identified on this row. Provide the From Time and To Time values in the locale of the PEM client host, and the PEM server will translate the time into other time zones as required.
|
To open Capacity Manager, select the Capacity Manager... option from the PEM client
Management menu; the
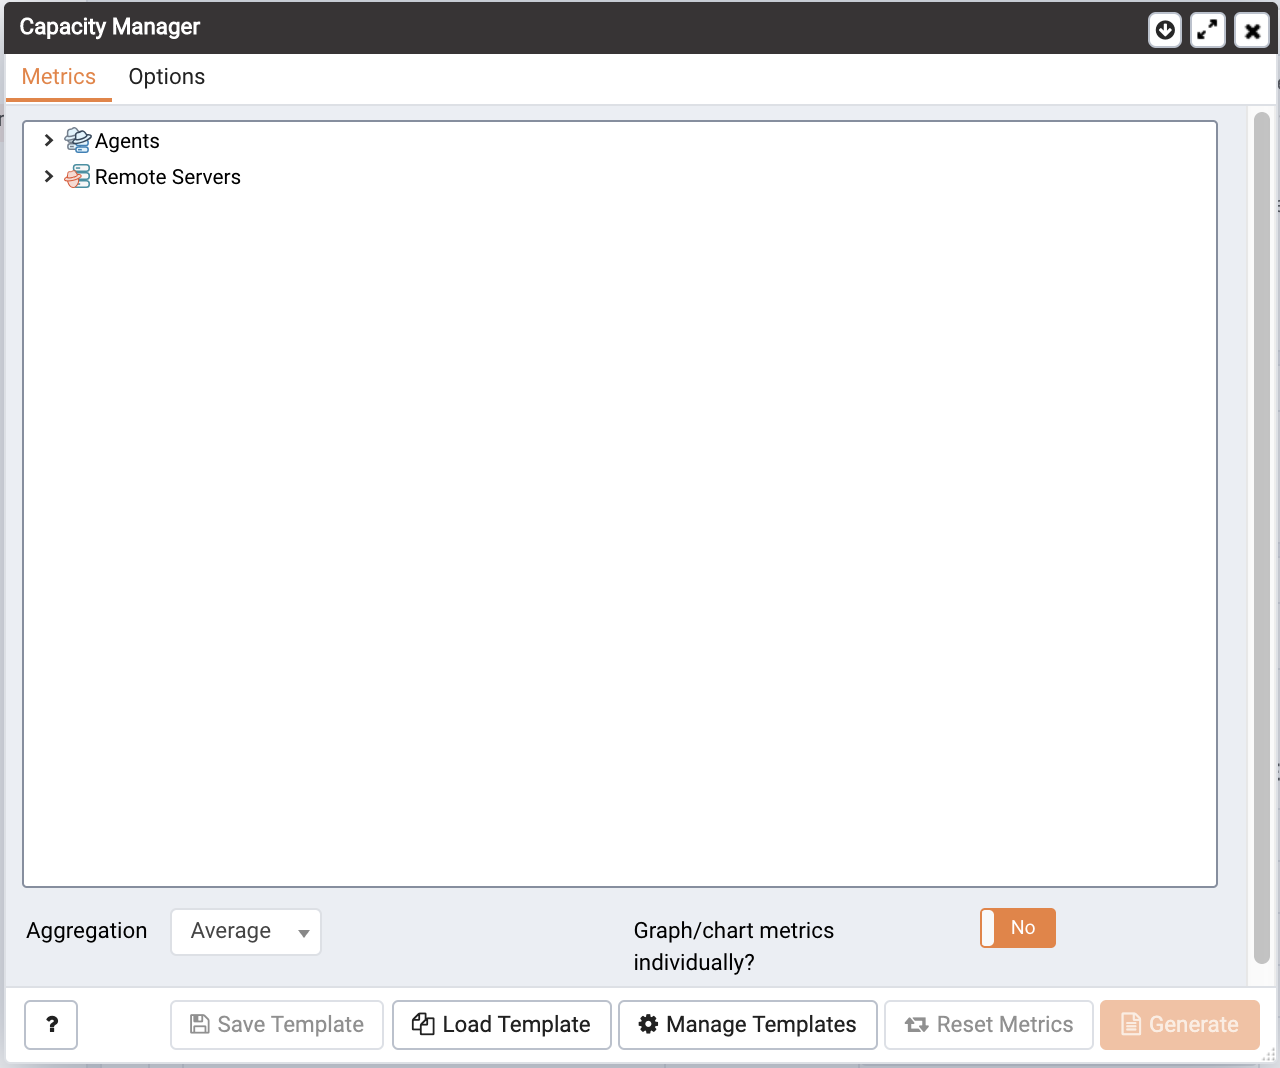
Capacity Manager wizard opens, displaying a tree control on the
Metrics tab (see Figure 5.1).
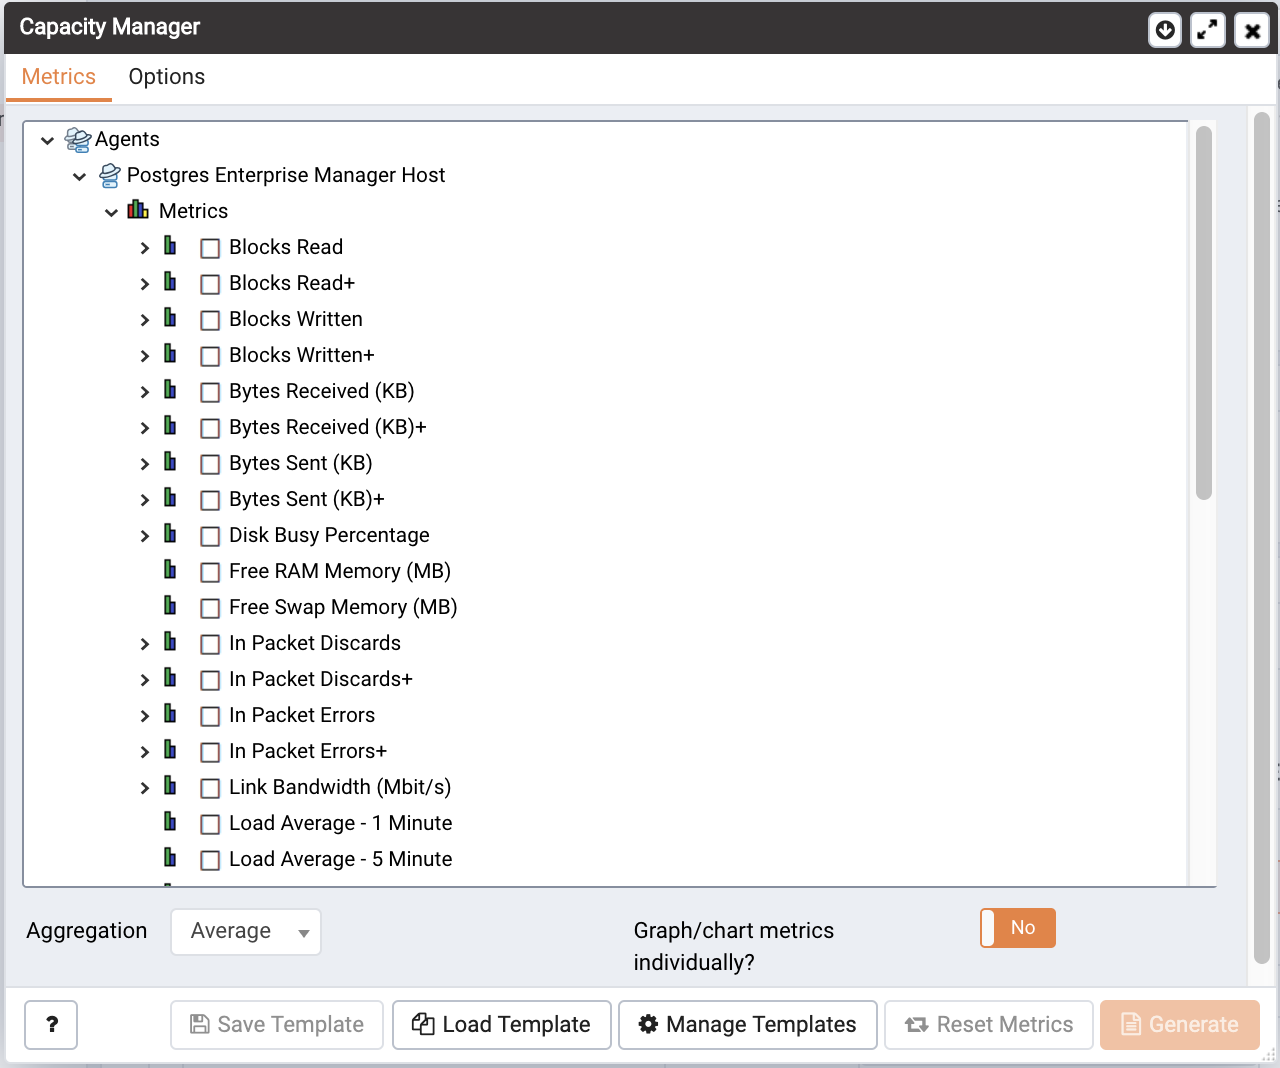
Expand the tree control on the Metrics tab to review the metrics for the node that you wish to analyze (see Figure 5.2). Check the box to the left of the name of the metric to include the metric in your report.
Move the slider next to Graph/chart metrics individually? to
Yes to instruct Capacity Manager to produce a separate report for each metric selected on the
Metrics tab. If the option is set to
No, all selected metrics will be merged into a single graph or table.
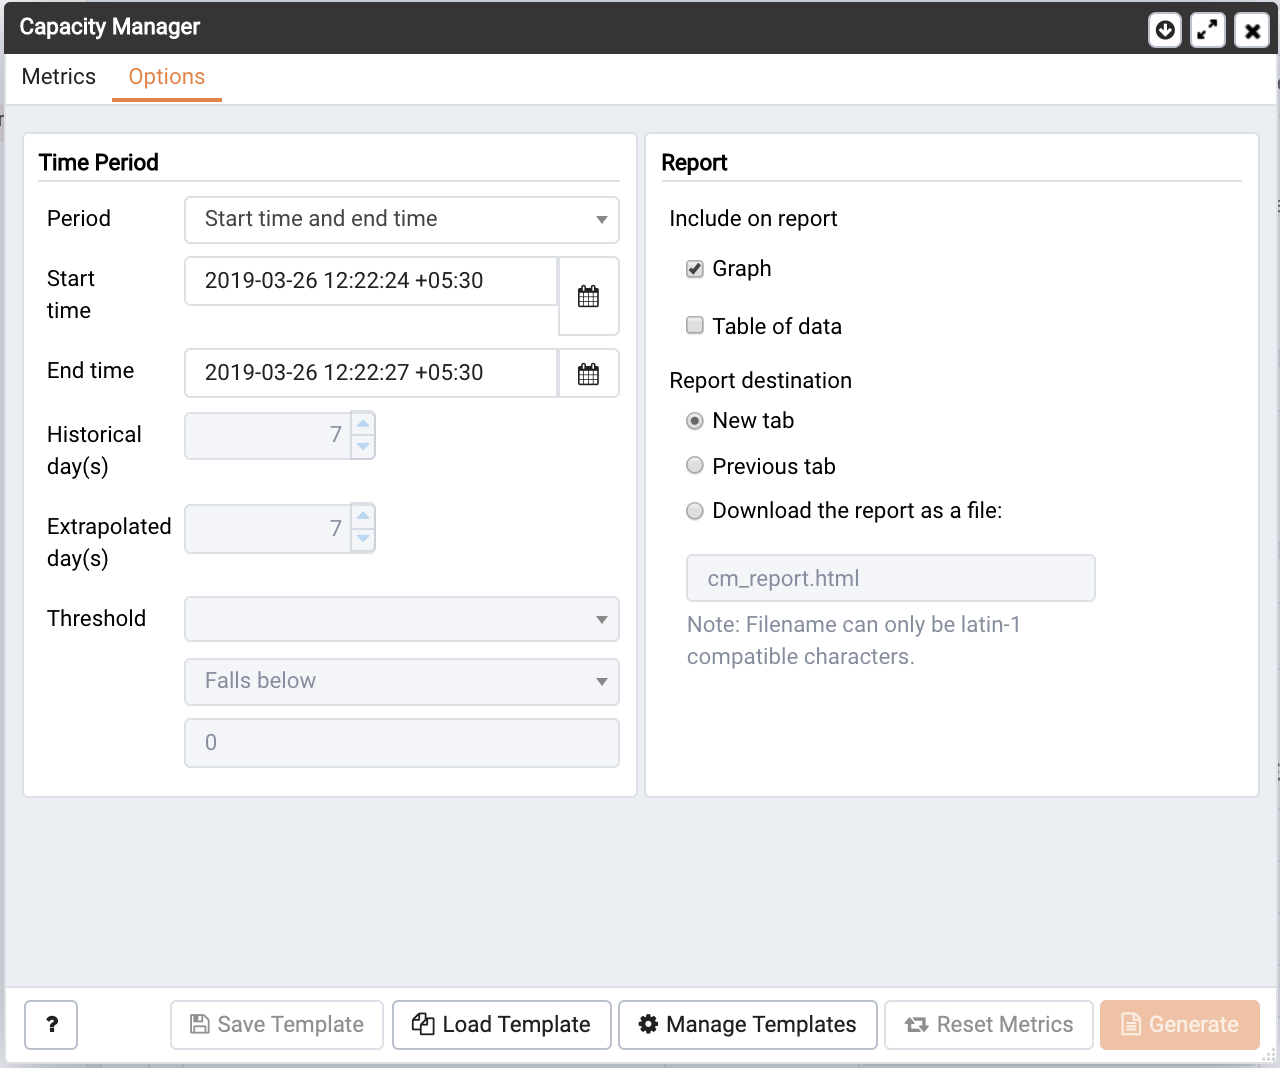
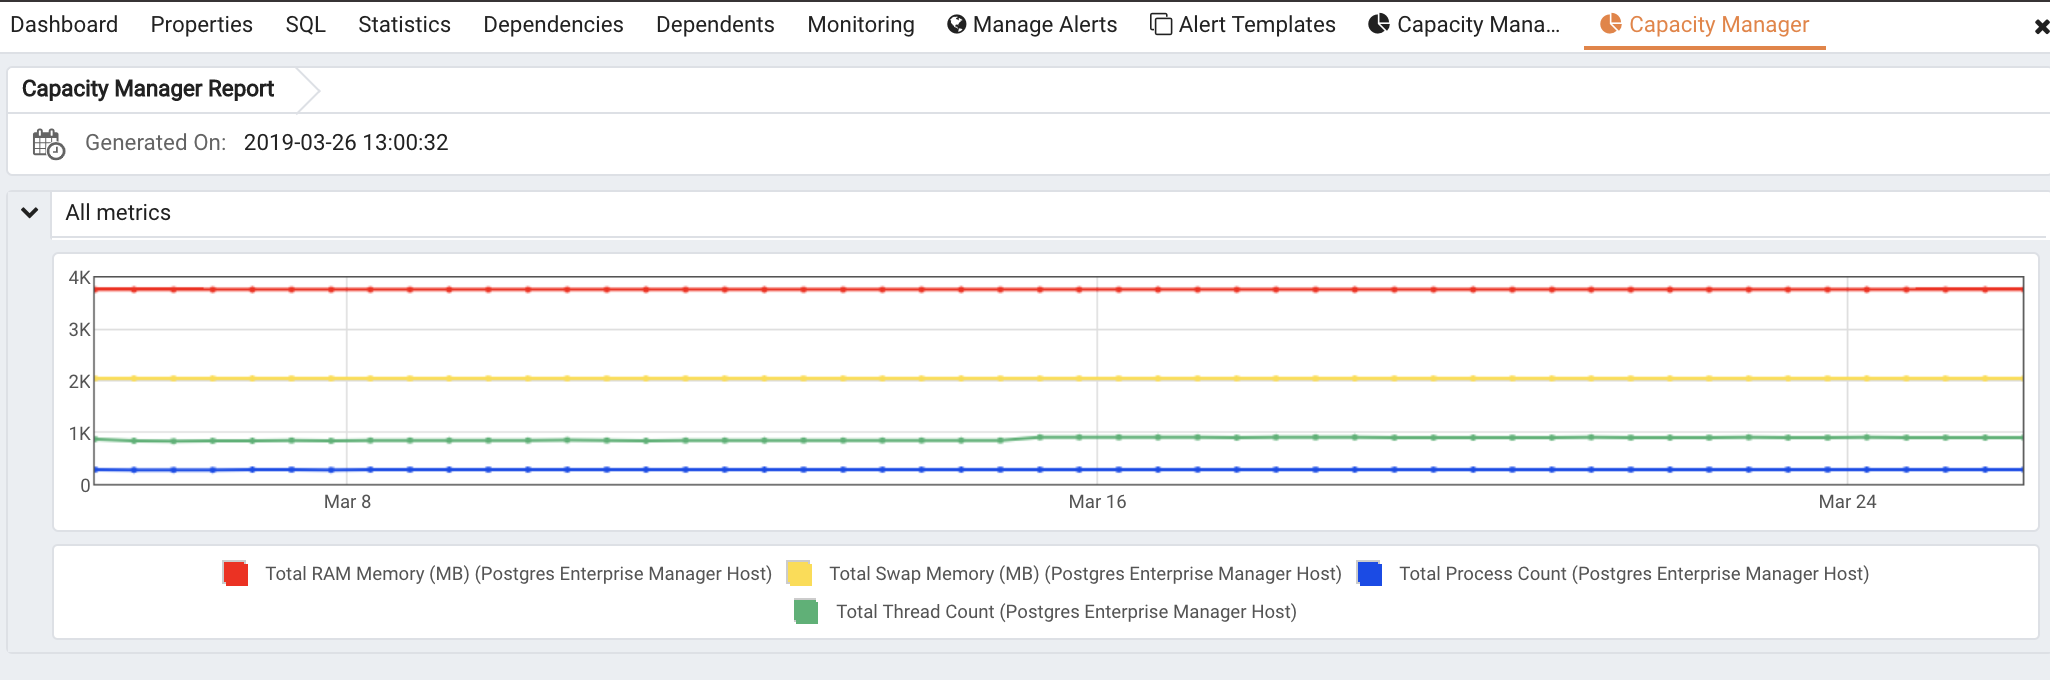
Click the Generate button to display the report onscreen (accepting the default configuration options), or use the
Options tab (see Figure 5.3) to customize sampling boundaries, report type and report destination. Please note that the times displayed on the
Options tab are the time zone in which the PEM client resides.
|
•
|
Use the Period drop-down listbox to select the type of time period you wish to use for the report. You can select:
|
|
•
|
Use the date and time selectors next to the Start time field to specify the starting date and time of the sampling period, or select the number of Historical day(s) of data to include in the report. The date and time specified in the Start time field must not be later than the current date/time.
|
To specify a threshold value, use the drop-down listbox in the Threshold field to select a metric, an operator (
Exceeds* or
Falls below), and enter a target value for the metric. If you choose to define the end of the report using a threshold, the Capacity Manager report will terminate when the value for the selected metric exceeds or falls below the specified value.
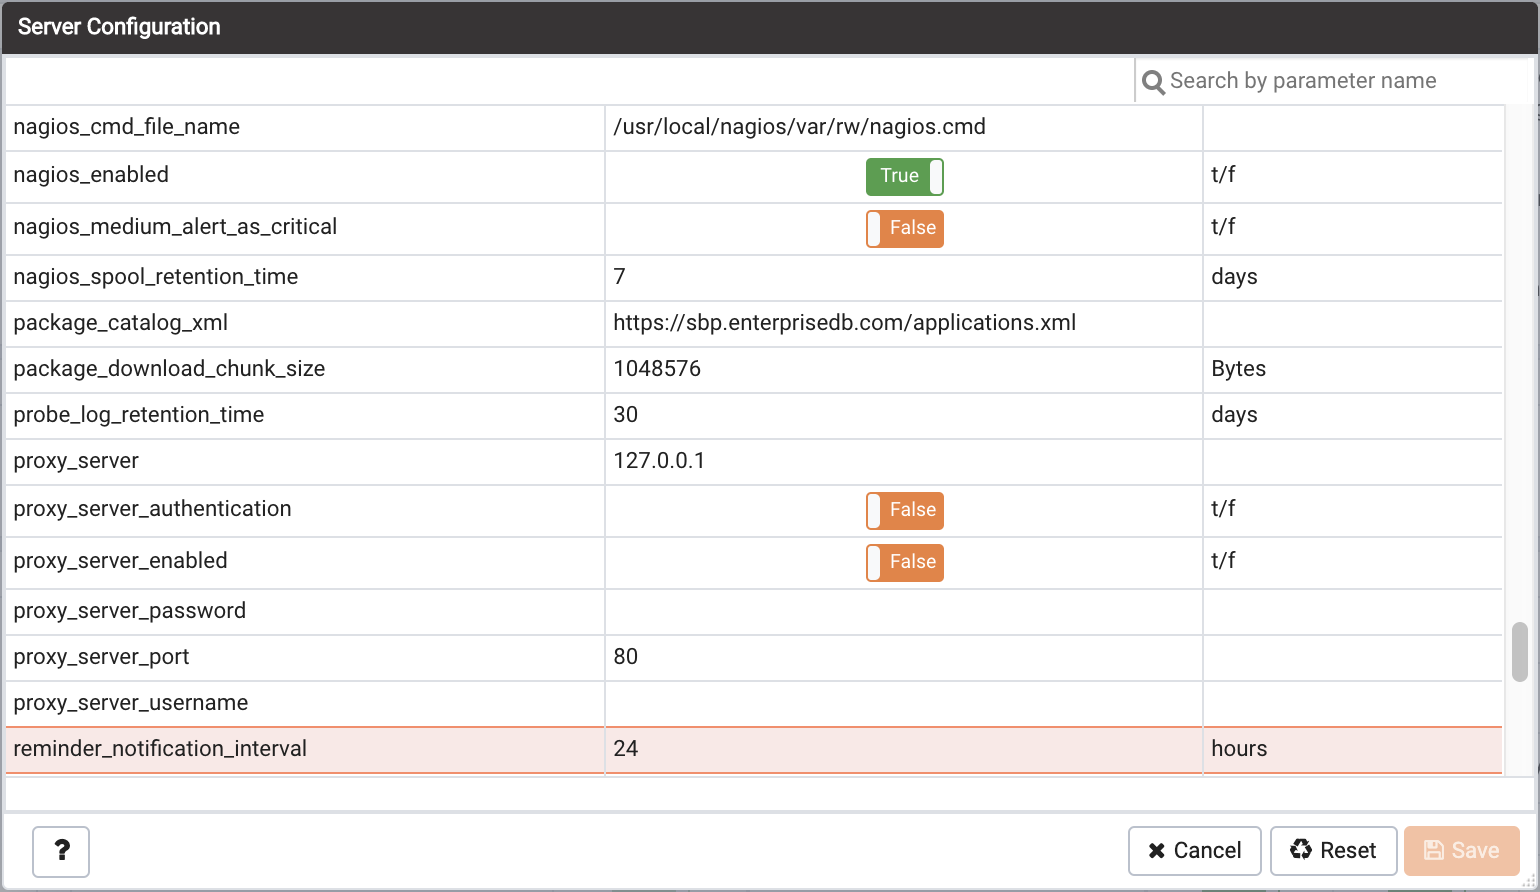
The cm_max_end_date_in_years configuration parameter defines a default time value for the end boundary of a Capacity Manager report. If you specify a threshold value as the end boundary of a report, and the anticipated usage of the boundary is not met before the maximum time has passed, the report will terminate at the time specified by the
cm_max_date_in_years parameter. By default,
cm_max_end_date_in_years is
5; you can use the
Server Configuration dialog to modify the value of
cm_max_end_date_in_years.
The fields in the Report box specify the report type and destination. Use the
Include on report radio buttons to specify the type of report produced by Capacity Manager:
|
•
|
Select Graph to instruct Capacity Manager to display the report in the form of a line graph in the PEM client window.
|
|
•
|
Select Table of data to instruct Capacity Manager to display a table containing the report data in the PEM client window.
|
|
•
|
Select Graph and table of data to instruct Capacity Manager to display both a line graph and a data table in the PEM client window.
|
Use the Report destination radio buttons to instruct Capacity Manager where to display or save the report:
|
•
|
Select New tab to instruct Capacity Manager to display the report on a new tab in the PEM client. You must select New tab to display the first generation of a Capacity Manager report; for subsequent reports, you may select Previous tab.
|
|
•
|
Select Previous tab to instruct Capacity Manager to re-use a previously opened tab when displaying the report.
|
|
•
|
Select Download the report as a file and specify a file name to instruct Capacity Manager to write the report to the specified file.
|
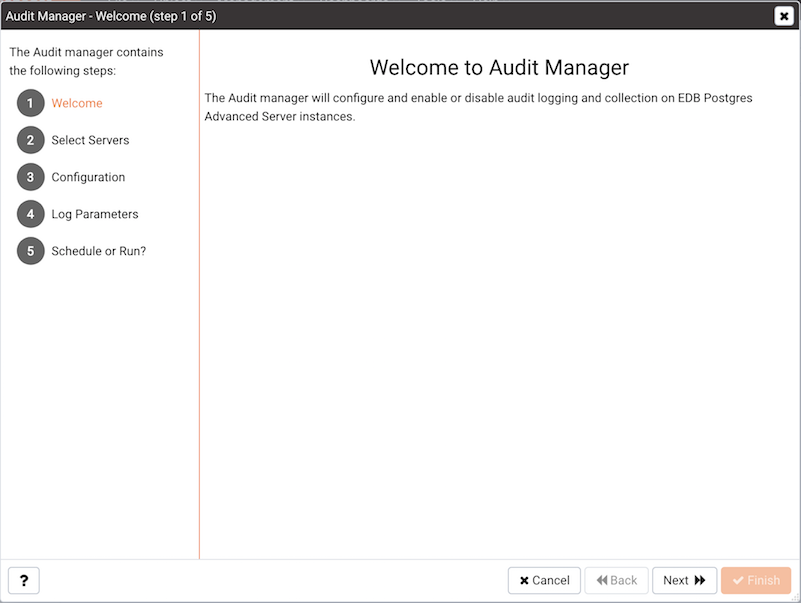
To open the Audit manager wizard, select
Audit Manager… from the
Management menu. The
Audit manager - Welcome dialog opens as shown in Figure 6.3.
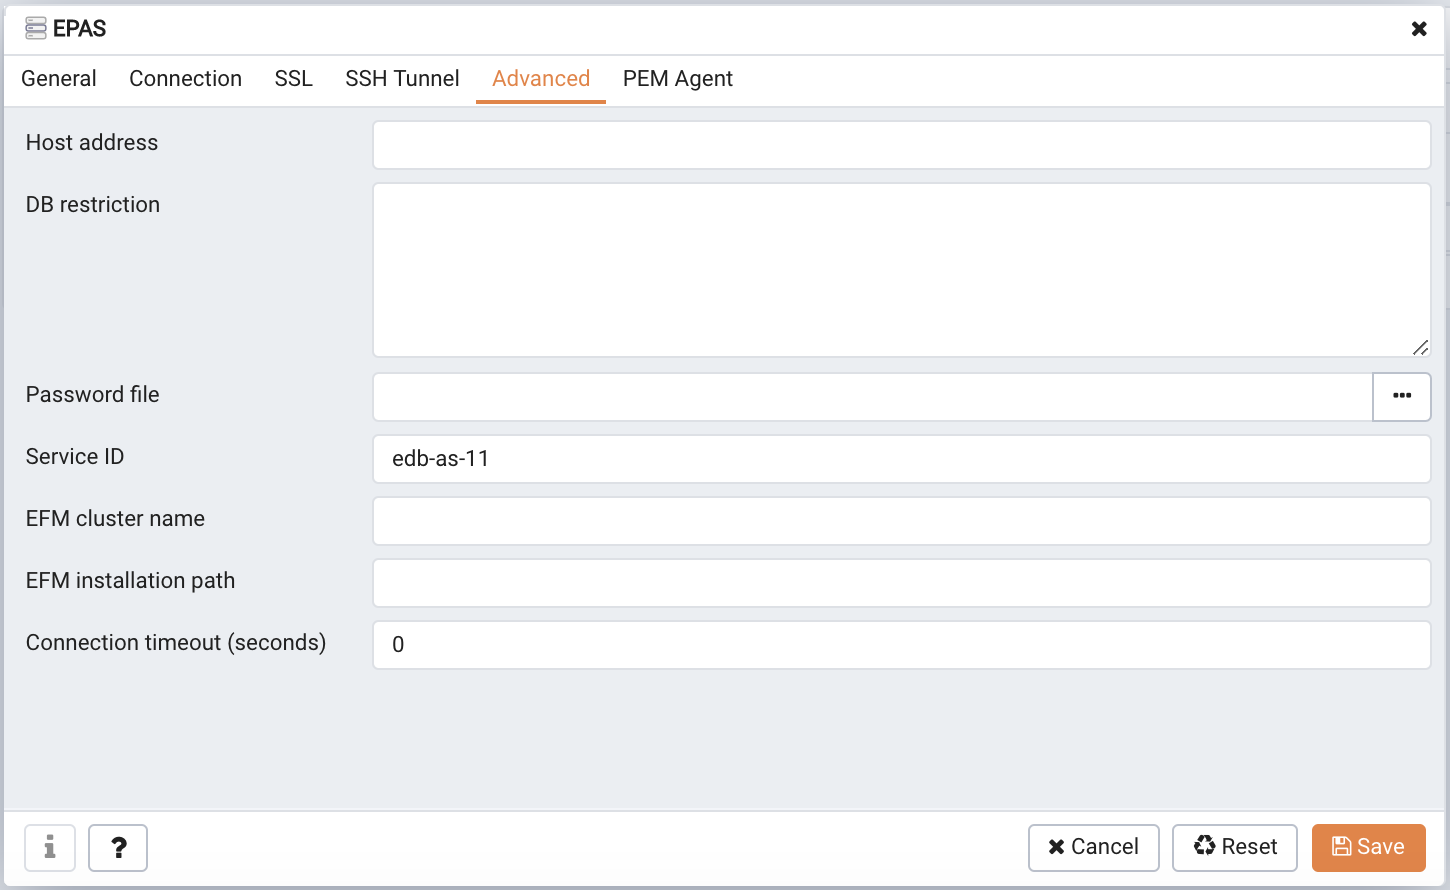
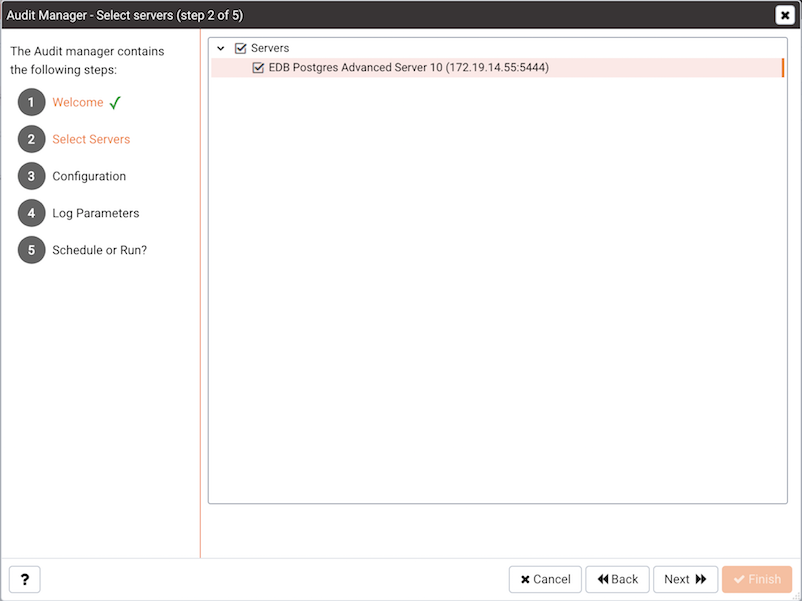
Use the Select servers tree control (shown in Figure 6.4) to specify the servers to which the auditing configuration will be applied. To make a server available in the tree control, you must provide the
Service ID on the
Advanced tab of the
Create –
Server dialog when registering a server for monitoring by PEM. Note that only EDB Postgres Advanced Server supports auditing; PostgreSQL servers will not be included in the tree control.
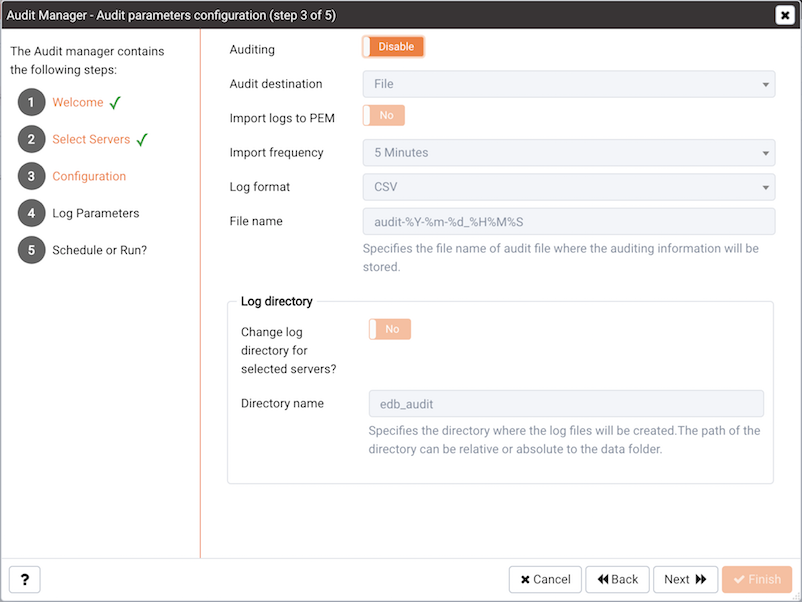
The Auditing Parameters Configuration dialog lets you enable or disable auditing and choose how often log records are collected into PEM (see Figure 6.5).
|
•
|
Use the Auditing switch to Enable or Disable auditing on the specified servers.
|
|
•
|
Use the Audit destination drop-down to select a destination for the audit logs; select File or Syslog. Please note this feature is supported on Advanced Server 10 and newer releases only.
|
|
•
|
Use the Import logs to PEM switch to instruct PEM to periodically import log records from each server to the PEM Server. Set the switch to Yes to import log files; the default is No.
|
|
•
|
Use the Collection frequency drop-down listbox to specify how often PEM will collect log records from monitored servers when log collection is enabled.
|
|
•
|
Use the Log format drop-down listbox to select the raw log format that will be written on each server. If log collection is enabled, the PEM server will use CSV format.
|
|
•
|
Use the File name field to specify the format used when generating log file names. By default, the format is set to audit-%Y-%m-%d_%H%M%S where:
|
audit is the file name specified in the
Audit Directory Name field
Y is the year that the log was stored
m is the month that the log was stored
d is the day that the log was stored
H is the hour that the log was stored
M is the minute that the log was stored
S is the second that the log was stored
|
•
|
Check the box next to Change Log Directory for selected servers? and use the Audit Directory Name field to specify a directory name to which the audit logs will be written. The directory will reside beneath the data directory on the PEM server.
|
Use fields in the Log directory box to specify information about the directory in which the log files will be saved:
|
•
|
Move the Change log directory for selected servers? switch to Yes to enable the Directory name field.
|
|
•
|
Use the Directory name field to specify the name of the directory on each server into which audit logs will be written. The directory specified will be created as a sub-directory of the data directory on the server.
|
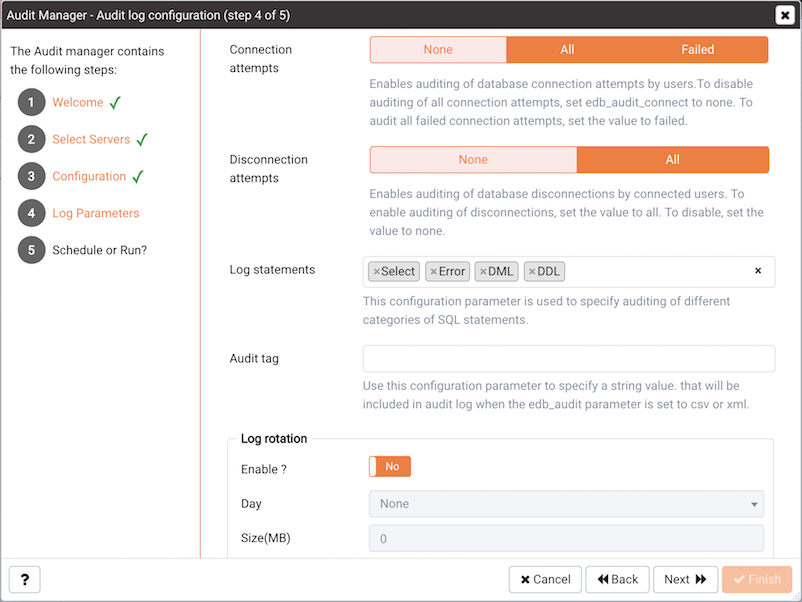
The Audit log configuration dialog (see Figure 6.6) is only available if you have enabled auditing on the
Auditing parameters configuration dialog.
Use the controls on the Audit log configuration dialog to specify log configuration details that will be applied to each server:
|
•
|
Use the Connection attempts switch to specify if connection attempts should be logged. Specify:
|
None to disable connection logging.
All to indicate that all connection attempts will be logged.
Failed to log any connection attempts that fail.
|
•
|
Use the Disconnection attempts switch to specify if disconnections should be logged. Specify:
|
None to specify that disconnections should not be logged.
All to enable disconnection logging.
|
•
|
Use the Log statements field to specify the statement types that will be logged. Click within the field, and select from:
|
Select - All statements that include the
SELECT keyword will be logged.
Error - All statements that result in an error will be logged.
DML - All DML (Data Modification Language) statements will be logged.
DDL - All DDL (Data Definition Language) statements (those that add, delete or alter data) will be logged.
|
•
|
Use the Audit tag field to specify a tracking tag for the collected logs. Please note that audit tagging functionality is available only for Advanced Server versions 9.5 and later. If you are defining auditing functionality for multiple servers, and one or more of the servers are version 9.5 or later, this field will be enabled, but if selected, tagging functionality will only apply to those servers that are version 9.5 or later.
|
|
•
|
Use the Enable? switch to specify that logfiles should be rotated. Please note that a new log file should be used periodically to prevent a single file becoming unmanageably large.
|
|
•
|
Use the Day drop-down listbox to select a day or days on which the log file will be rotated.
|
|
•
|
Use the Size ( MB) field to specify a size in megabytes at which the log file will be rotated.
|
|
•
|
Use the Time ( seconds) field to specify the number of seconds between log file rotations.
|
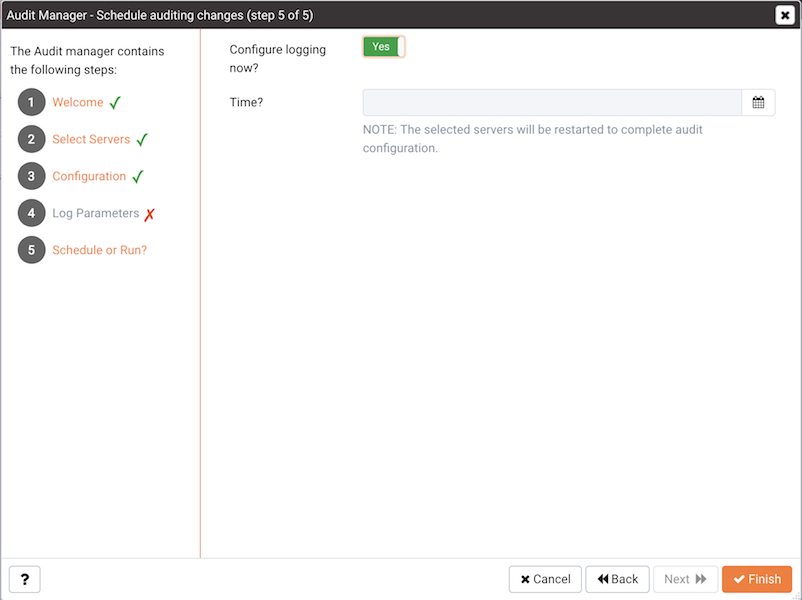
Use the Schedule Auditing Changes dialog
(see Figure 6.7) to determine when auditing configuration changes are to take effect.
|
•
|
Select Configure logging now? if you want the auditing configuration changes to take place immediately. The affected database servers will be restarted so the auditing changes can take effect.
|
|
•
|
Use the Time? selector to schedule the auditing configuration changes to take place at some point in the future. Select the desired date and time from the drop-down lists. The affected database servers will be restarted at the specified date/time to put the auditing changes into effect.
|
Click Finish to complete the auditing configuration process.
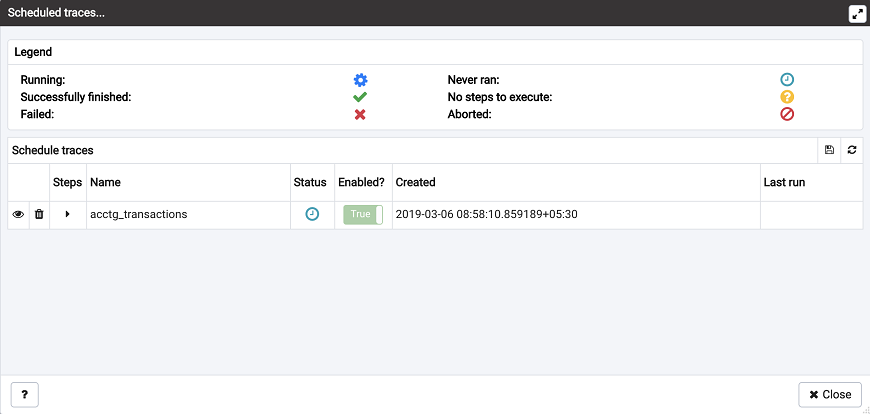
You can use the Scheduled Tasks tab to review a list of Scheduled jobs. To open the
Scheduled Tasks tab, highlight the name of a server or agent and select
Scheduled Tasks… from the
Management menu.
You can use the PEM Log Manager to simplify server log configuration for Postgres instances. With the Log Manager, you can modify all of your server log parameters with a click:
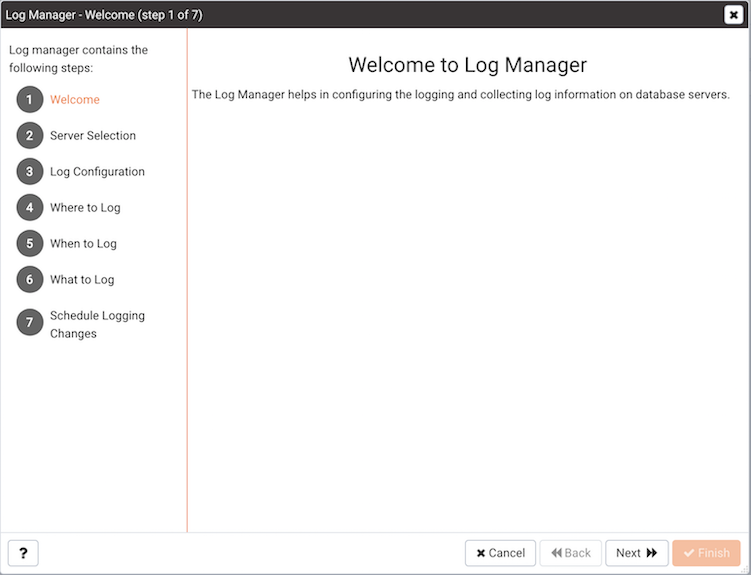
To open the Log Manager, select the Log Manager… option from the
Management menu of the PEM client. The wizard opens, welcoming you to the Log Manager (as shown in Figure 7.1).
Click Next to continue to the
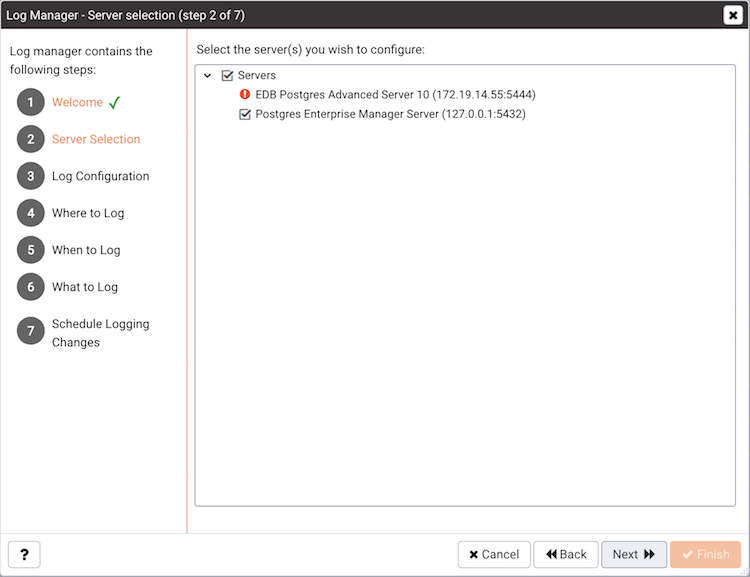
Server selection dialog (see Figure 7.2).
The Server selection dialog displays a list of the server connections monitored by PEM. Check the box next to the name of a server (or servers) to which the Log Manager wizard will apply the specified configuration. Log Manager is disabled for any server displaying a red exclamation mark to the left of its name in the
Server selection tree control; there are several reasons that a server may not be enabled:
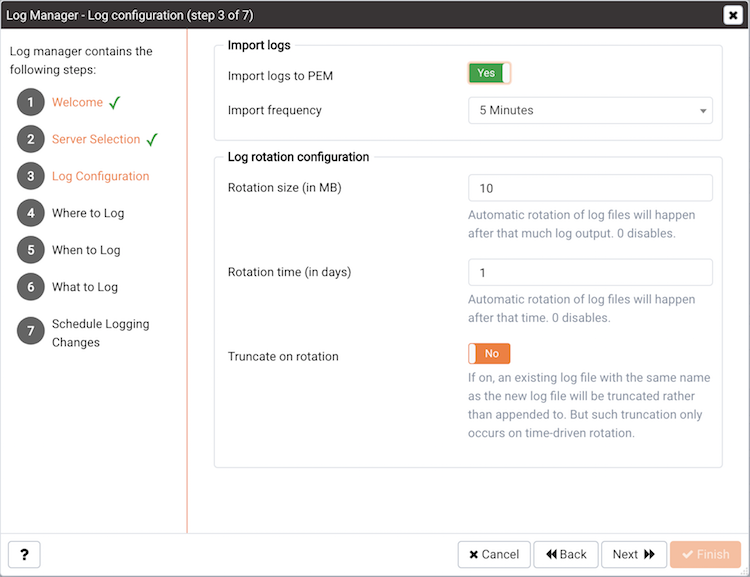
Use the options on the Log configuration dialog (shown in Figure 7.3) to specify how often log files will be inported to PEM and to specify log rotation details:
|
•
|
Use the switch next to the Import logs to PEM label to specify if log files will be imported to PEM and displayed on the Server Log Analysis dashboard.
|
|
•
|
Use the Import Frequency drop-down list box to specify how often log files are imported to PEM.
|
Use the fields in the Log rotation configuration box to specify the maximum length (lifespan or size) of a log file:
|
•
|
Use the Rotation Size field to specify the maximum size in megabytes of an individual log file. The default value is 10 MB; when set to 0, no limit is placed on the maximum size of a log file.
|
|
•
|
Use the Rotation Time field to specify the number of whole days that should be stored in each log file. The default value is 1 day.
|
Use the Truncation on Rotation switch to specify server behavior for time-based log file rotation:
|
•
|
Select ON to specify that the server should overwrite any existing log file that has the same name that a new file would take.
|
|
•
|
Select OFF to specify that the server should append any new log file entries to an existing log file with the same name that a new log file would take. This is the default behavior.
|
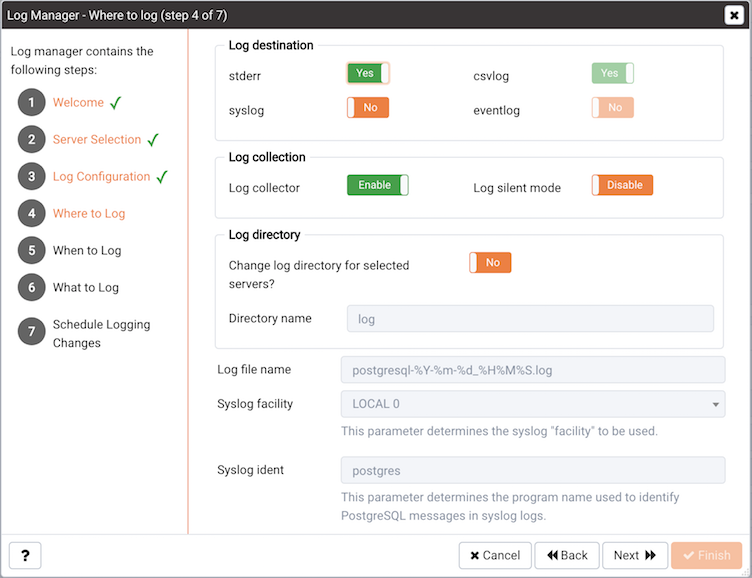
Use the fields on the Where to log dialog (shown in Figure 7.4) to specify where log files should be written.
|
o
|
Set the stderr switch to Yes to specify that log files should be written to stderr.
|
|
o
|
Set the csvlog switch to Yes to specify that log files should be written to file in a comma-separated value format. This option is automatically enabled (and no longer editable) if you have selected Import logs to PEM on the Schedule dialog; if you are not importing server log files to PEM, this option is editable.
|
|
o
|
Set the syslog switch to Yes to specify that log files should be written to the system log files.
|
|
o
|
On Windows, set the eventlog switch to Yes to specify that log files should be written to the event log.
|
|
o
|
Set the Log Collector switch to Enable to instruct the server to re-direct captured log messages (directed to STDERR) into log files.
|
|
o
|
Set the Log Silent Mode switch to Enable to instruct the server to run silently in the background, disassociated from the controlling terminal.
|
|
o
|
Set the Change log directory for selected servers? switch to Yes to specify that each set of log files should be maintained in a separate directory.
|
|
o
|
Use the Directory name field to specify the directory to which log files will be written. The directory will reside beneath the pg_log directory under the installation directory of the monitored server.
|
|
•
|
Use the Log File Name field to specify a format for the log file name. If set to DEFAULT, the format is enterprisedb-%Y-%m-%d_%H%M%S, where:
|
enterprisedb is the file name prefix
Y is the year that the log was stored
m is the month that the log was stored
d is the day that the log was stored
H is the hour that the log was stored
M is the minute that the log was stored
S is the second that the log was stored
|
•
|
Use the Syslog Facility drop-down list box to specify which syslog facility should be used.
|
|
•
|
Use the Syslog Ident field to specify the program name that will identify Advanced Server entries in system logs.
|
Use the fields on the When to log dialog (shown in Figure 7.5) to specify which events will initiate a log file entry. The severity levels (in order of severity, from most severe to least severe) are:
panic - Errors that cause all database sessions to abort.
fatal - Errors that cause a session to abort.
log - Information messages of interest to administrators.
error - Errors that cause a command to abort.
warning - Error conditions in which a command will complete but may not perform as expected.
notice - Items of interest to users. This is the default.
info - Information implicitly requested by the user.
debug5 through
debug1 - Detailed debugging information useful to developers.
|
•
|
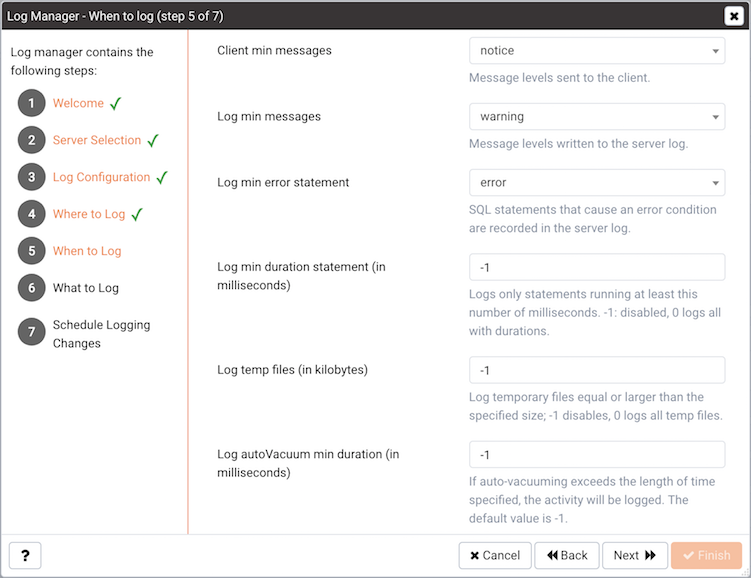
Use the Client min messages drop-down list box to specify the lowest severity level of message sent to the client application.
|
|
•
|
Use the Log min messages drop-down list box to specify the lowest severity level that will be written to the server log.
|
|
•
|
Use the Log min duration statement drop-down list box to specify a statement duration (in milliseconds); any statements that exceed the specified number of milliseconds will be written to the server log. A value of -1 disables all duration-based logging; a value of 0 logs all statements and their duration.
|
|
•
|
Use the Log temp files field to specify a file size in kilobytes; when a temporary file reaches the specified size, it will be logged. A value of -1 (the default) disables this functionality.
|
|
•
|
Use the Log autoVacuum min duration field to specify a time length in milliseconds; if auto-vacuuming exceeds the length of time specified, the activity will be logged. A value of -1 (the default) disables this functionality.
|
Use the fields on the What to log dialog (shown in Figure 7.6) to specify log entry options that are useful for debugging and auditing.
The switches in the Debug options box instruct the server to include information in the log files related to query execution that may be of interest to a developer:
|
•
|
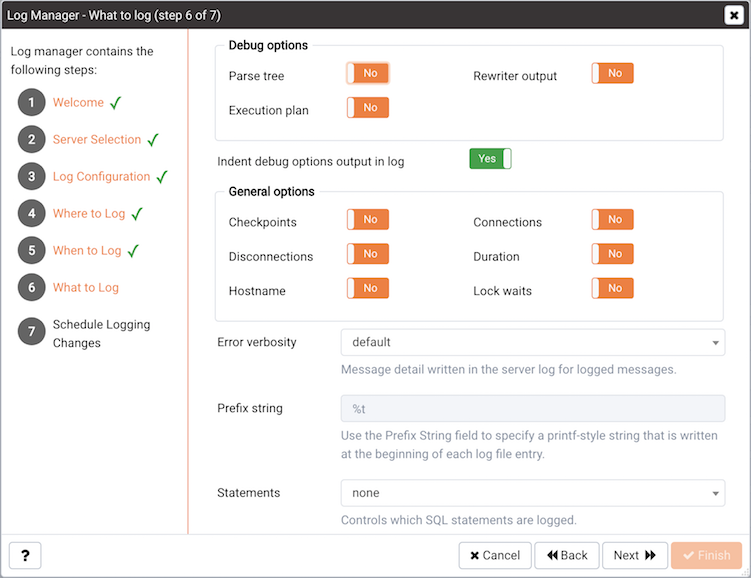
Set the Parse tree switch to Yes to instruct the server to include the parse tree in the log file.
|
|
•
|
Set the Rewriter output switch to Yes to instruct the server to include query rewriter output in the log file.
|
|
•
|
Set the Execution plan switch to Yes to instruct the server to include the execution plan for each executed query in the log file.
|
When the Indent Debug Options Output in Log switch is set to
Yes, the server indents each line that contains a parse tree entry, a query rewriter entry or query execution plan entry. While indentation makes the resulting log file more readable, it does result in a longer log file.
Use the switches in the General Options box to instruct the server to include auditing information in the log file:
|
•
|
Set the Checkpoints switch to Yes to include checkpoints and restartpoints in the server log.
|
|
•
|
Set the Connections switch to Yes to include each attempted connection to the server (as well as successfully authenticated connections) in the server log.
|
|
•
|
Set the Disconnections switch to Yes to include a server log entry for each terminated session that provides the session information and session duration.
|
|
•
|
Set the Duration switch to Yes to include the amount of time required to execute each logged statement in the server log.
|
|
•
|
Set the Hostname switch to Yes to include both the IP address and host name in each server log entry (by default, only the IP address is logged). Please note that this may cause a performance penalty.
|
|
•
|
Set the Lock Waits switch to Yes to instruct the server to write a log entry for any session that waits longer than the time specified in the deadlock_ timeout parameter to acquire a lock. This is useful when trying to determine if lock waits are the cause of poor performance.
|
Use the Error verbosity drop-down list box to specify the detail written to each entry in the server log:
|
•
|
Select default to include the error message, DETAIL, HINT, QUERY and CONTEXT in each server log entry.
|
|
•
|
Select terse to log only the error message.
|
|
•
|
Select verbose to include the error message, the DETAIL, HINT, QUERY and CONTEXT error information, SQLSTATE error code and source code file name, the function name, and the line number that generated the error.
|
Use the Prefix string field to specify a printf-style string that is written at the beginning of each log file entry. For information about the options supported, please see the
log_line_prefix documentation (in the Postgres core documentation), available at:
Use the Statements drop-down list box to specify which SQL statements will be included in the server log. The default is
none; valid options are:
|
•
|
Specify none to disable logging of SQL statements.
|
|
•
|
Specify ddl to instruct the server to log ddl (data definition language) statements, such as CREATE, ALTER, and DROP.
|
|
•
|
Specify mod to instruct the server to log all ddl statements, as well as all dml (data modification language) statements, such as INSERT, UPDATE, DELETE, TRUNCATE and COPY FROM.
|
|
•
|
Specify all to instruct the server to log all SQL statements.
|
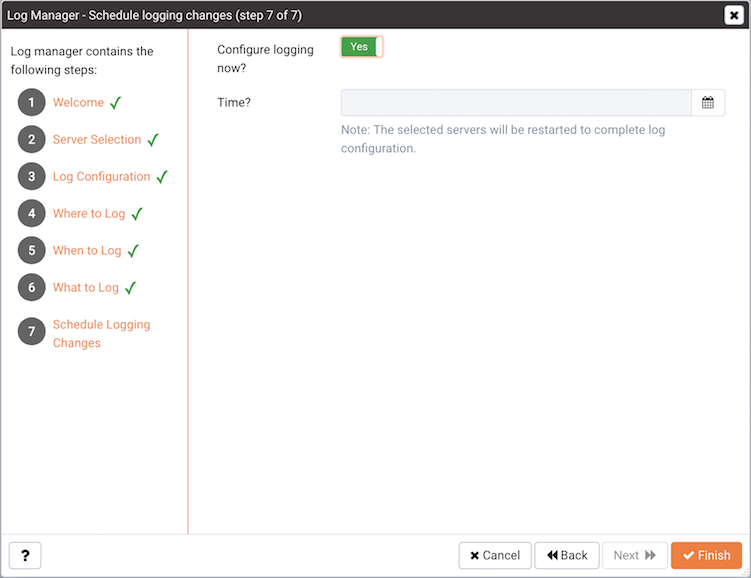
Use options on the Schedule logging changes dialog (see Figure 7.7) to specify when logging configuration changes will be applied:
|
•
|
Set the Configure logging now switch to Yes to specify that your configuration preferences will be enabled, and the server will restart when you have completed the Log Manager wizard.
|
|
•
|
Set Configure logging now to No to use the Schedule it for some other time calendar selector to specify a convenient time for logging configuration preferences to be applied, and the server to restart.
|
Click Finish to exit the wizard, and either restart the server, or schedule the server
restart for the time specified on the scheduling dialog.
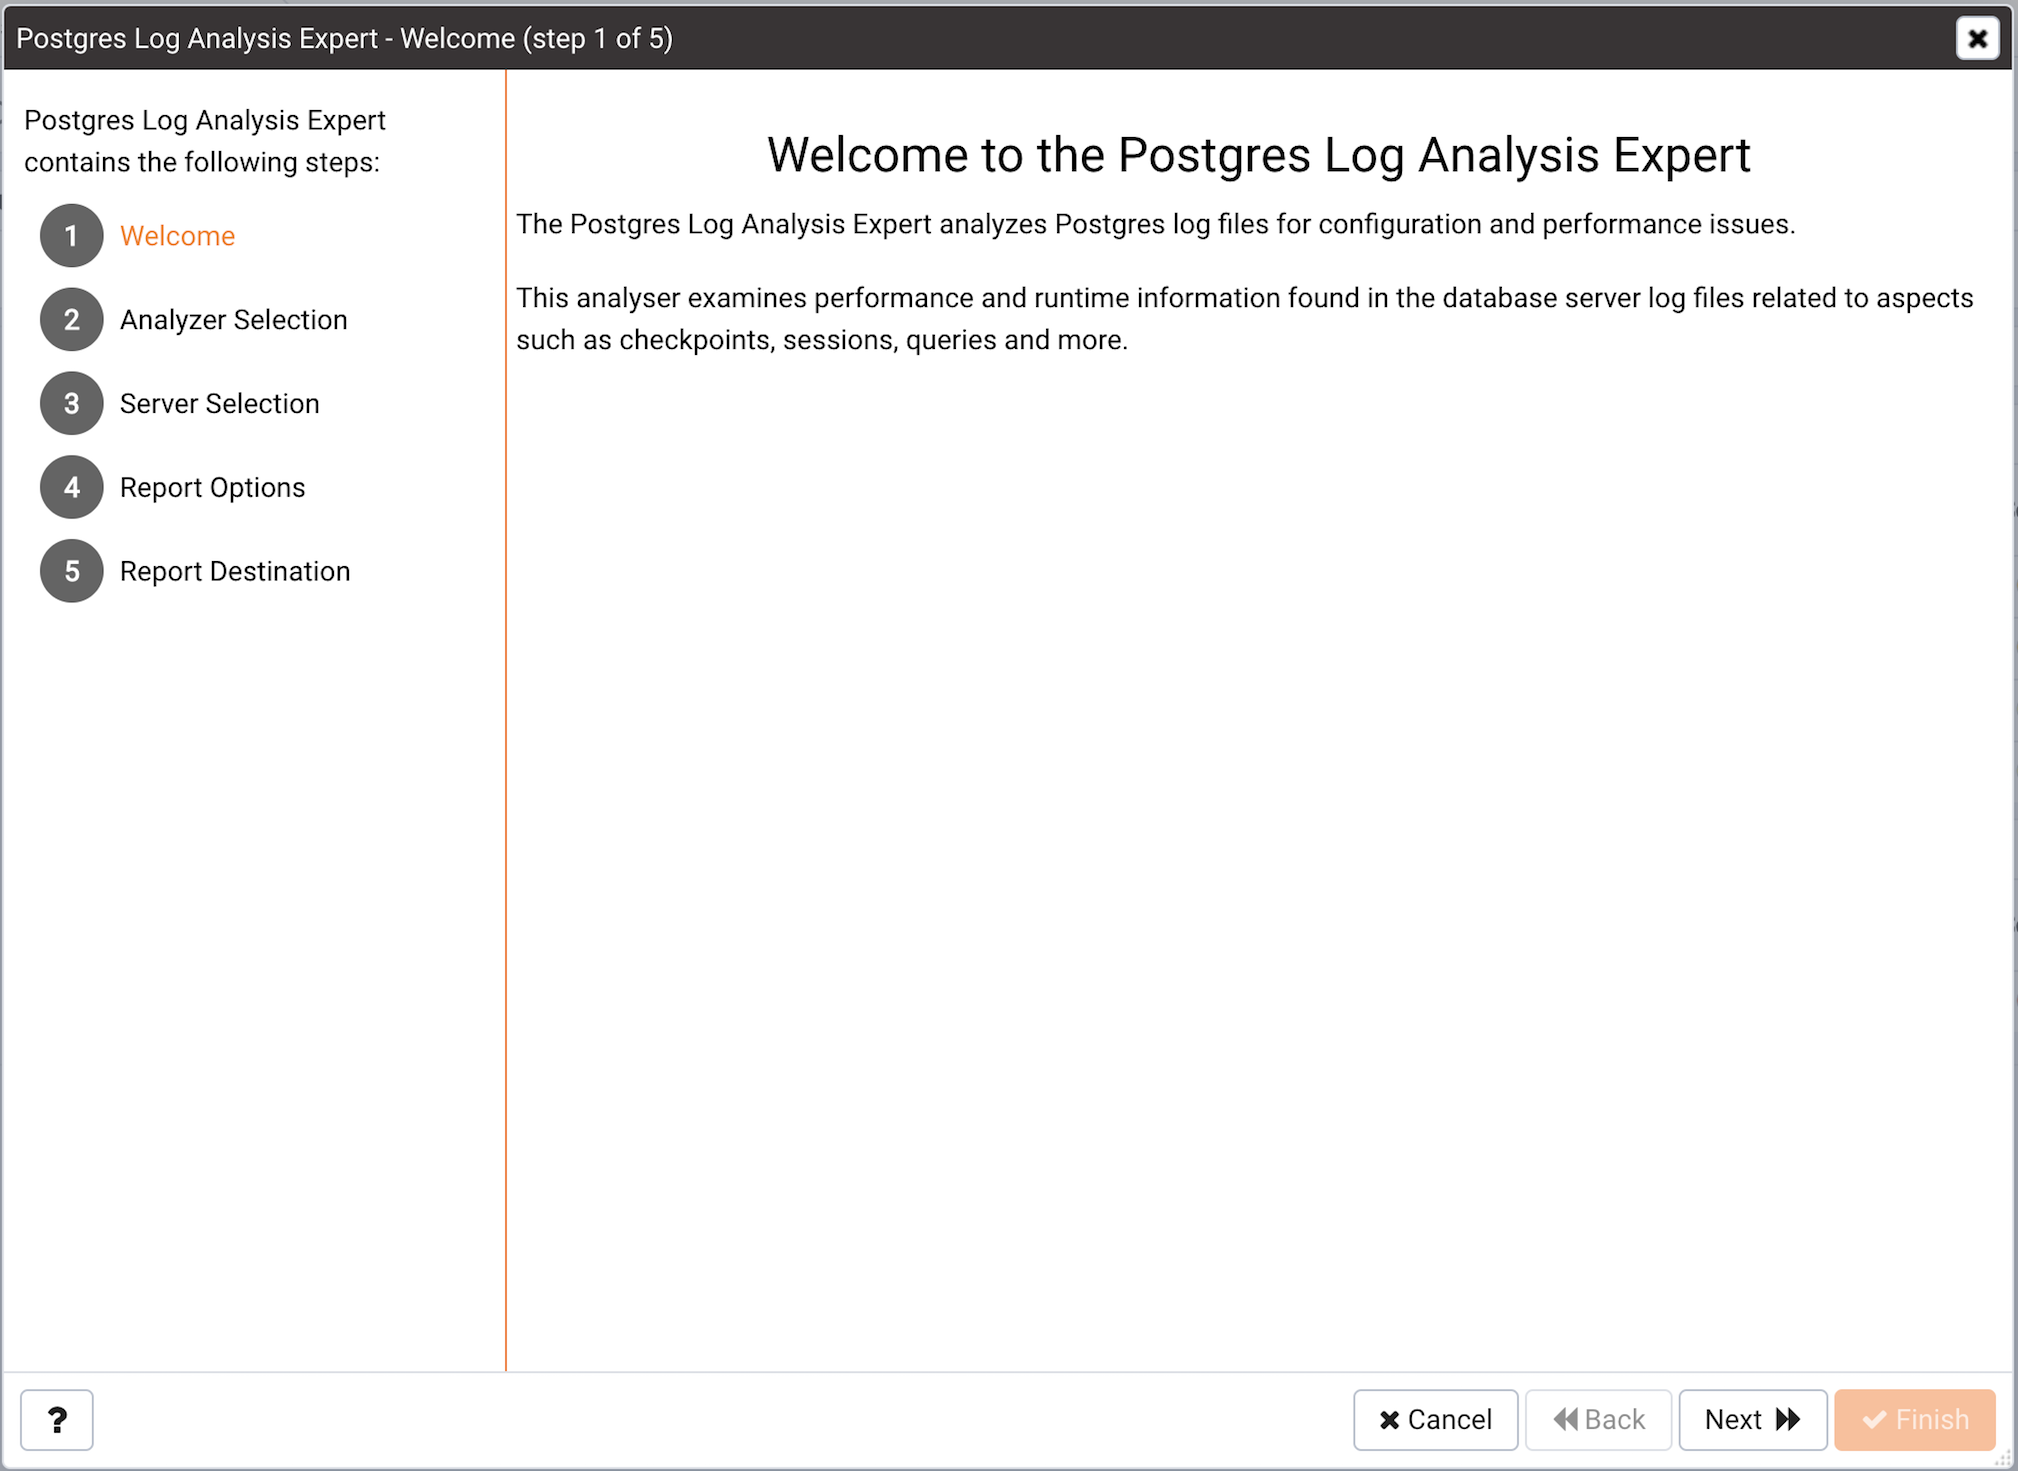
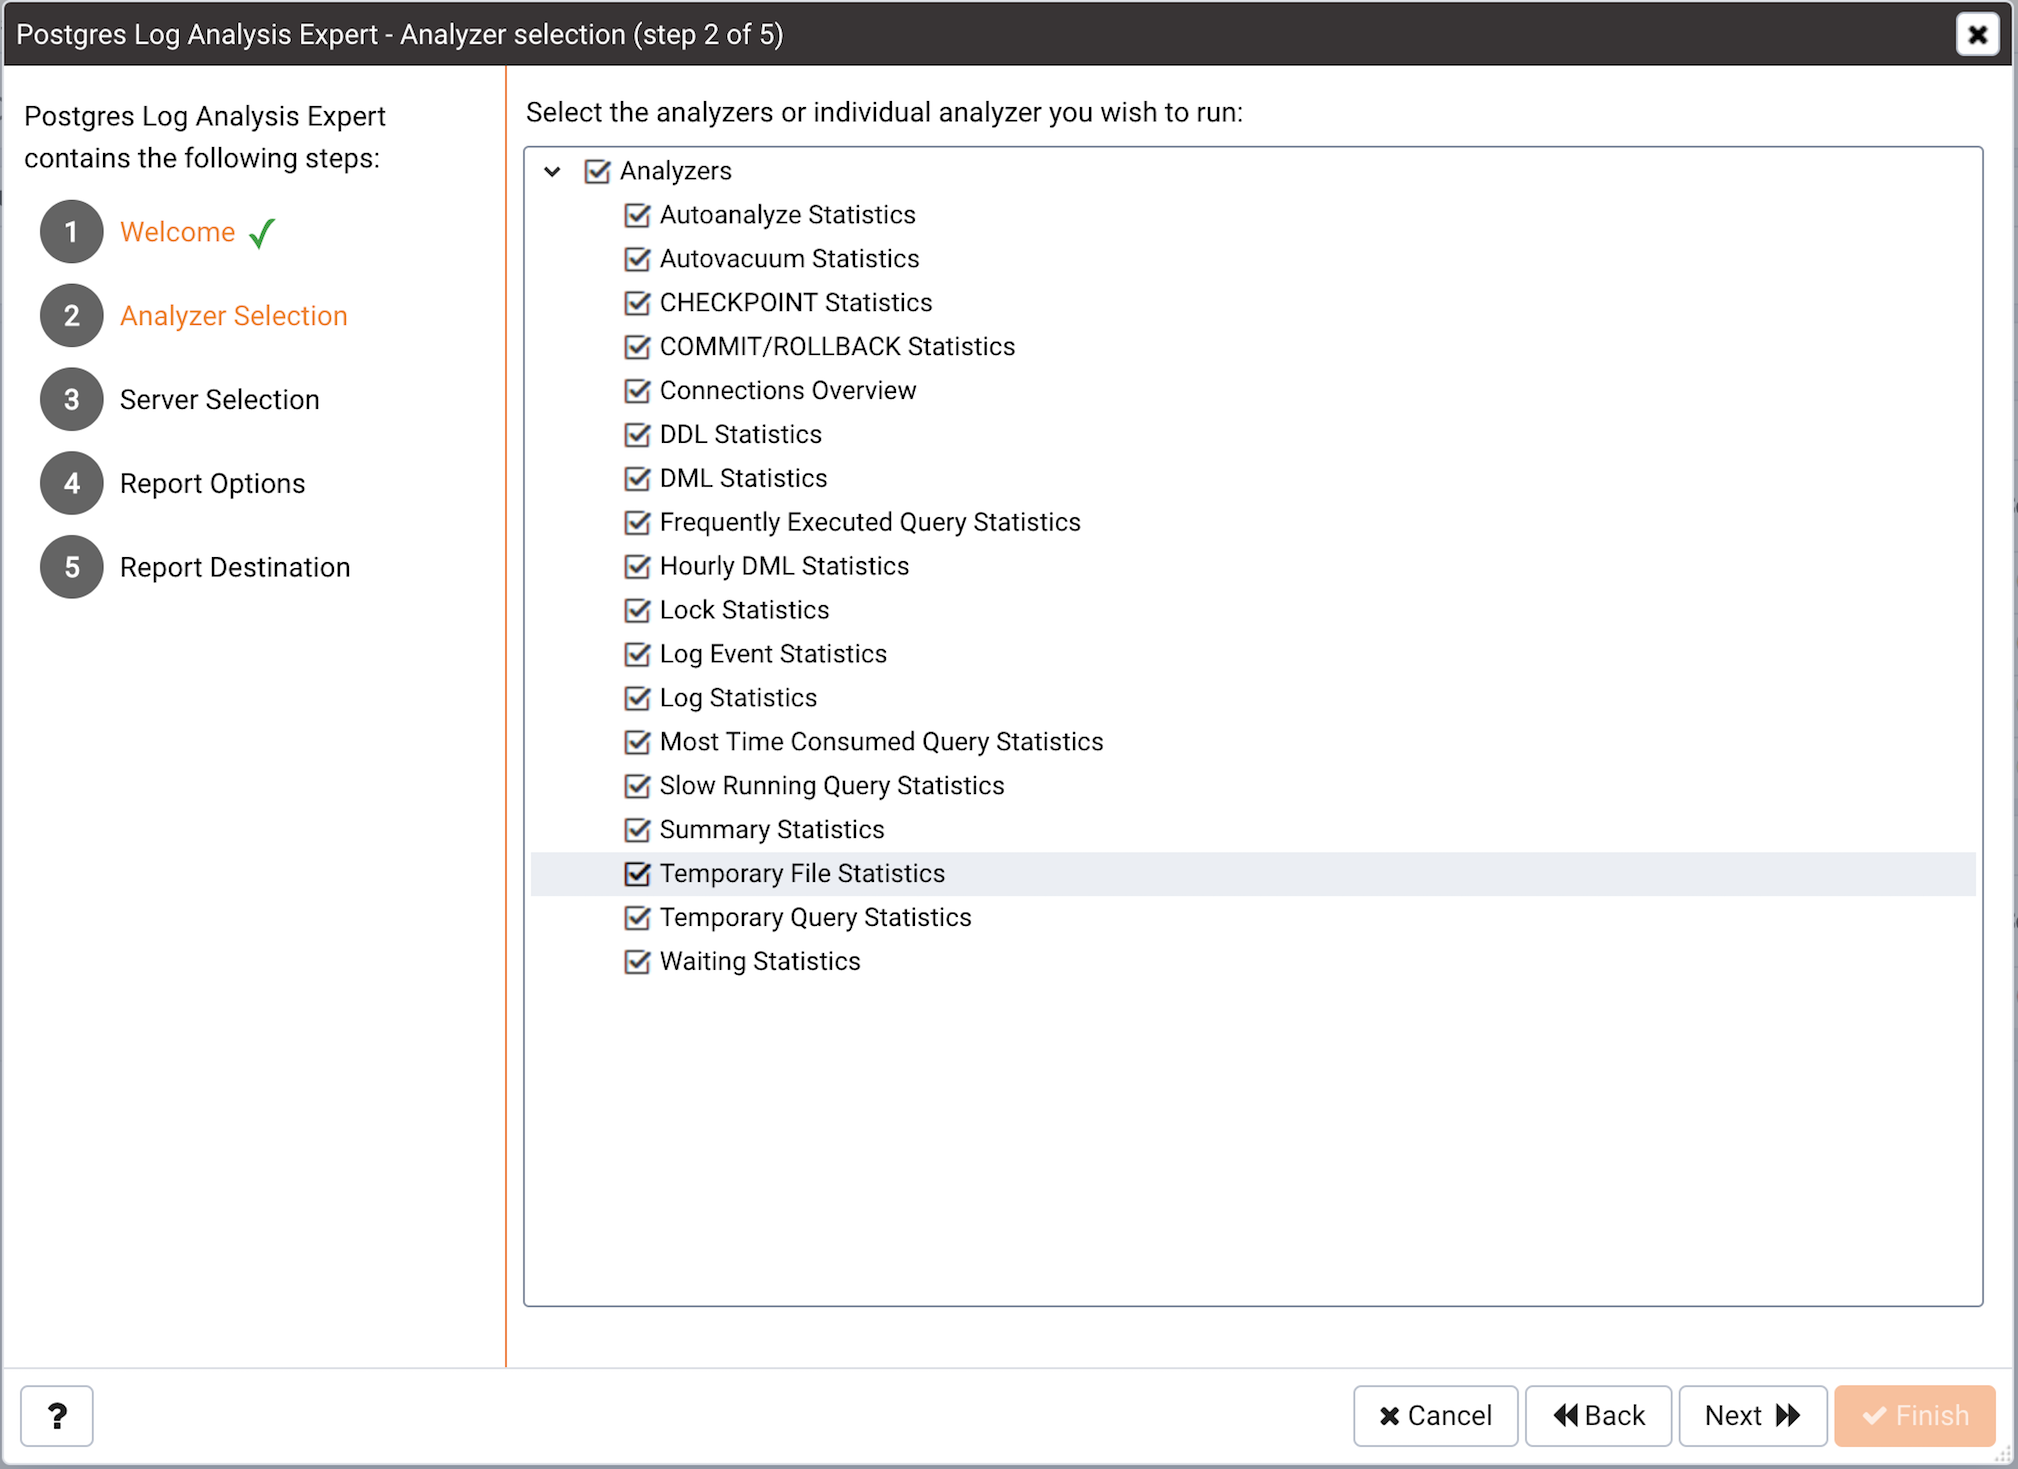
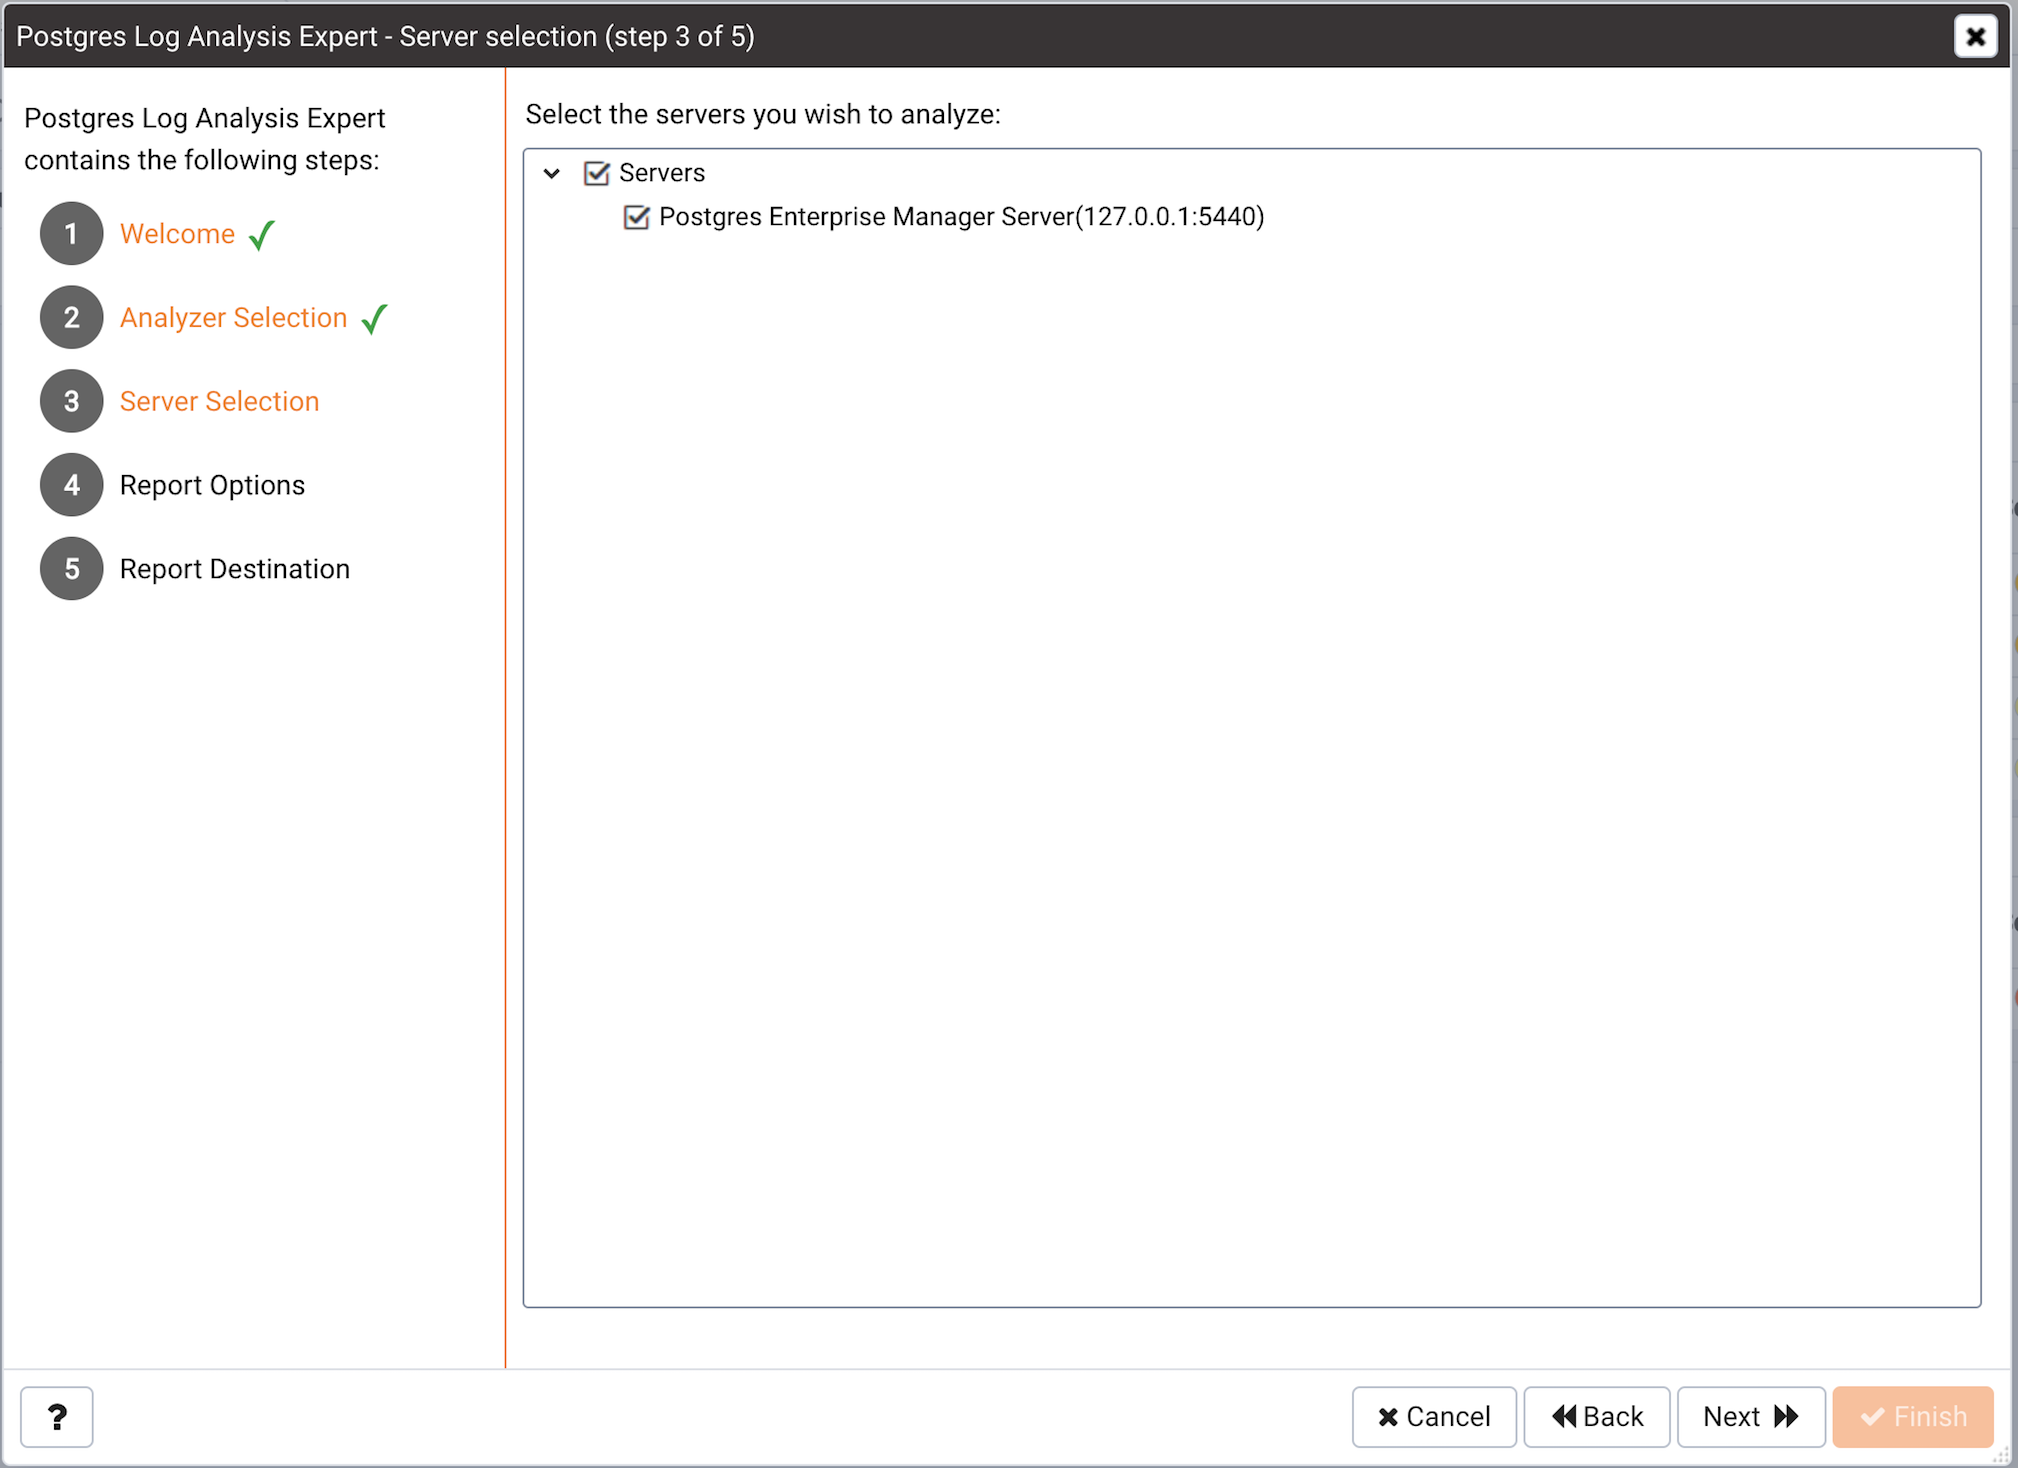
The wizard's Analyzer selection dialog (see Figure 8.2) displays a list of
Analyzers from which you can select. Each
Analyzer generates a corresponding table, chart, or graph that contains information gleaned from the log files.
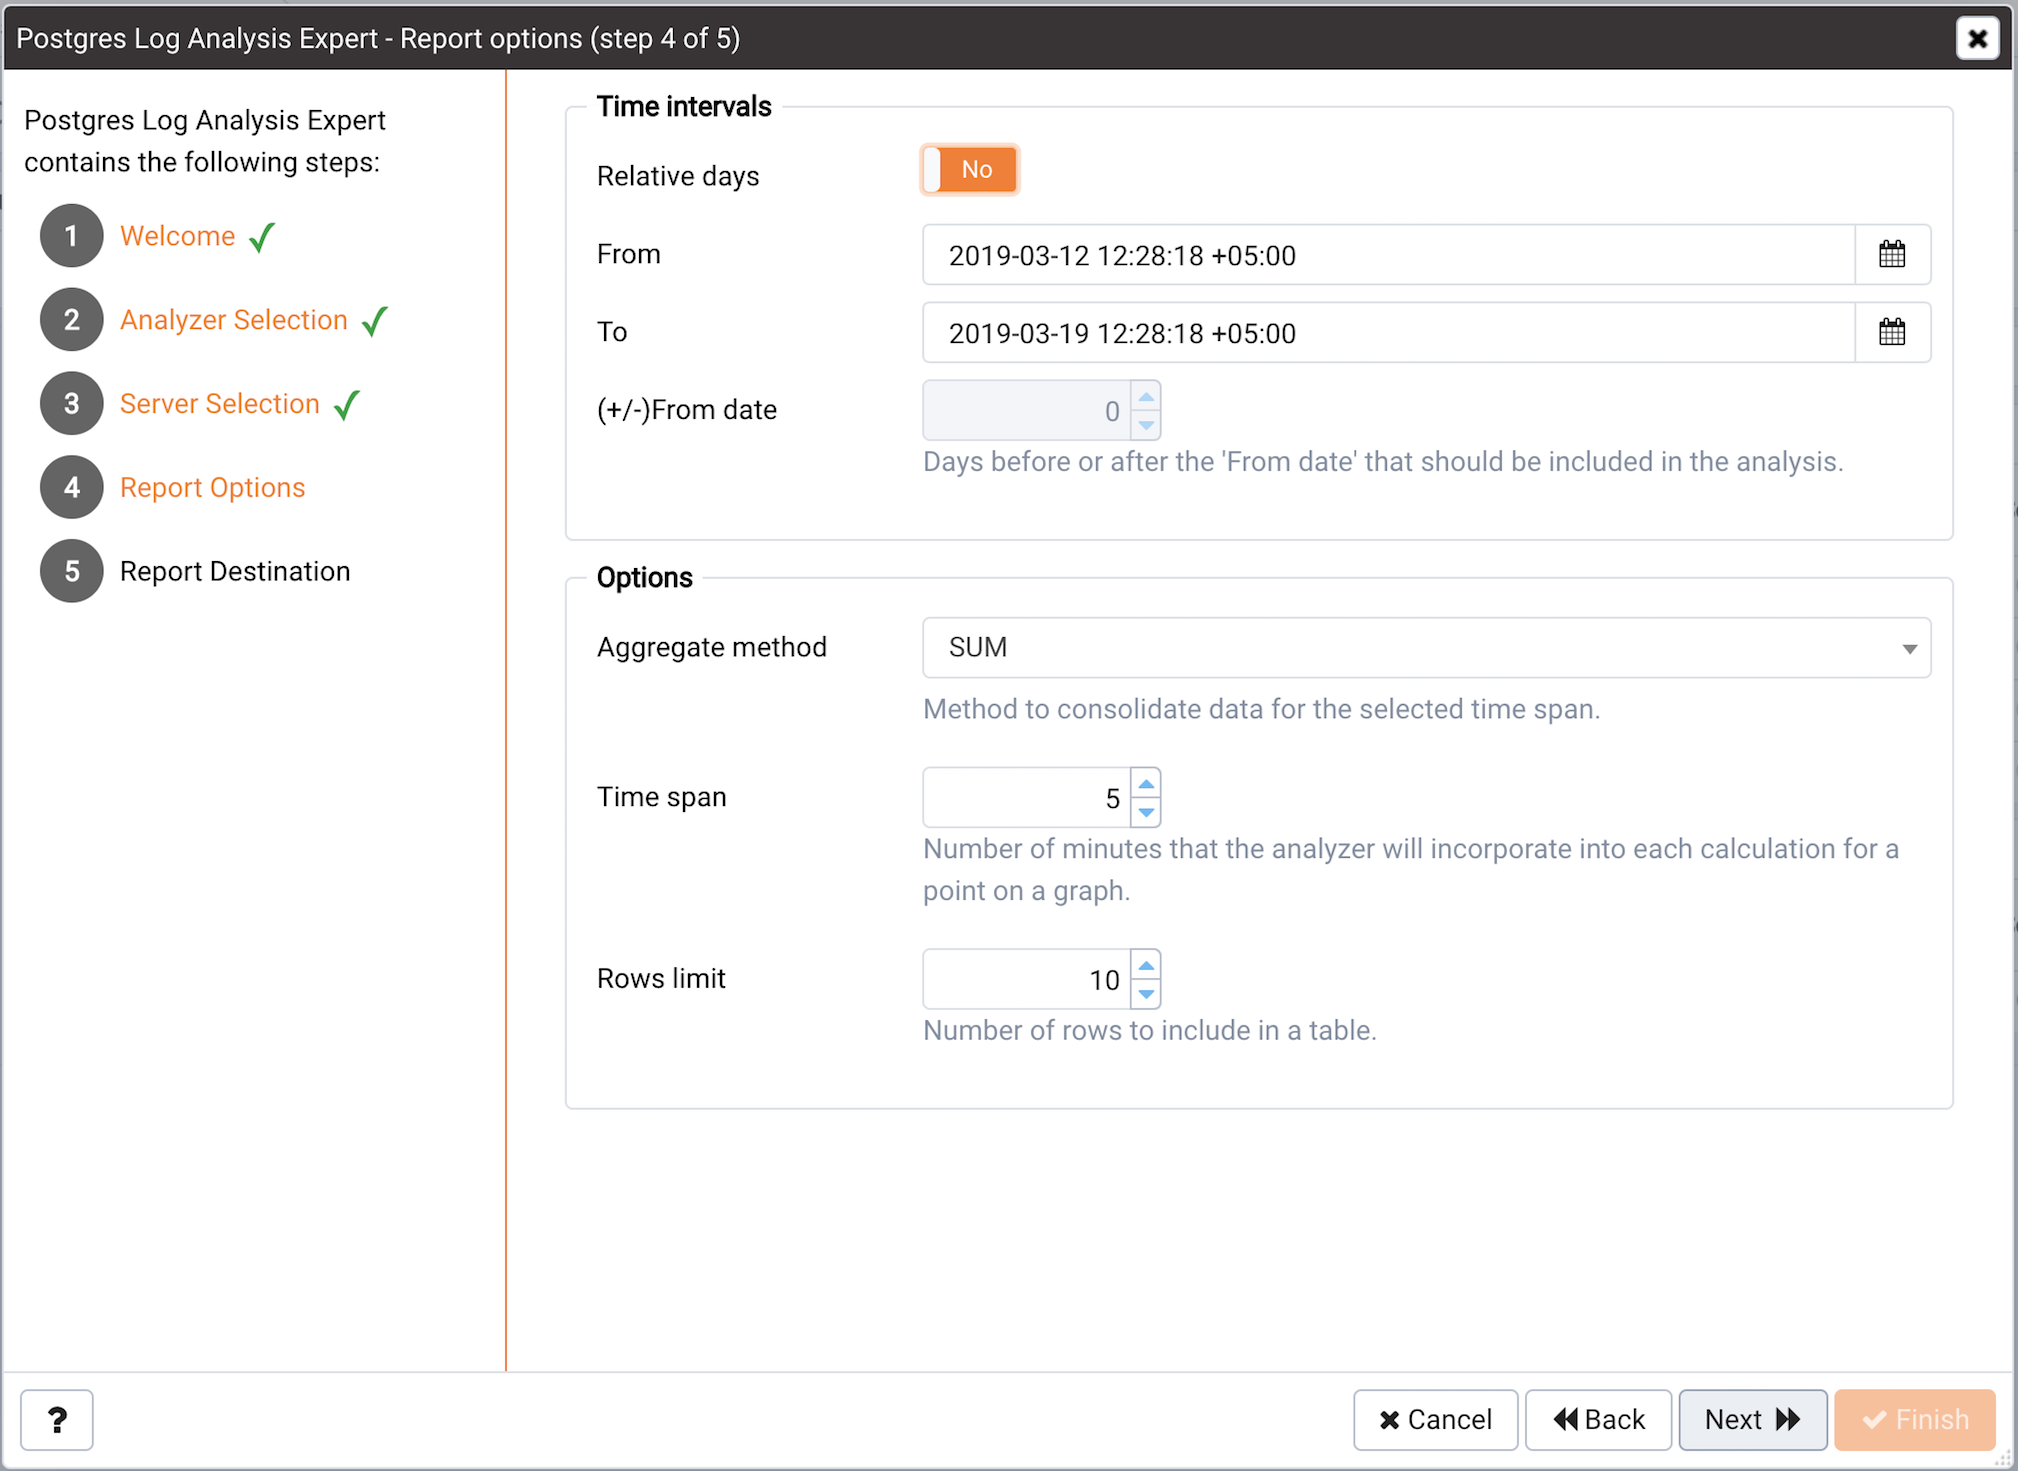
Use the fields in the Options section to specify the analysis method and the maximum length of any resulting tables:
|
•
|
Use the Aggregate method drop-down to select the method used by the Log Analysis Expert to consolidate data for the selected time span. You can select from:
|
|
o
|
SUM instructs the analyzer to calculate a value that is the sum of the collected values for the specified time span.
|
|
o
|
AVG instructs the analyzer to calculate a value that is the average of the collected values for the specified time span.
|
|
o
|
MAX instructs the analyzer to use the maximum value that occurs within a specified time span.
|
|
o
|
MIN instructs the analyzer to use the minimum value that occurs within a specified time span.
|
|
•
|
Use the Time span field to specify the number of minutes that the analyzer will incorporate into each calculation for a point on a graph. For example, if the Time span is 5 minutes, and the Aggregate method is AVG, each point on the given graph will contain the average value of the activity that occurred within a five minute time span.
|
|
•
|
Use the Rows limit field to specify the maximum number of rows to include in a table.
|
Use the fields in the Time Intervals section to specify the time range that the Log Analysis Expert will analyze:
|
•
|
Set Relative days to Yes to enable the (+/-)From date field and specify the number of days before or after the date and time selected in the From field.
|
|
•
|
Use the From field to specify the starting date and time for the analysis.
|
|
•
|
Use the To field to specify the ending date and time for the analysis.
|
|
•
|
Use the (+/-) From date selector to specify the number of days before or after the From date that should be included in the analysis.
|
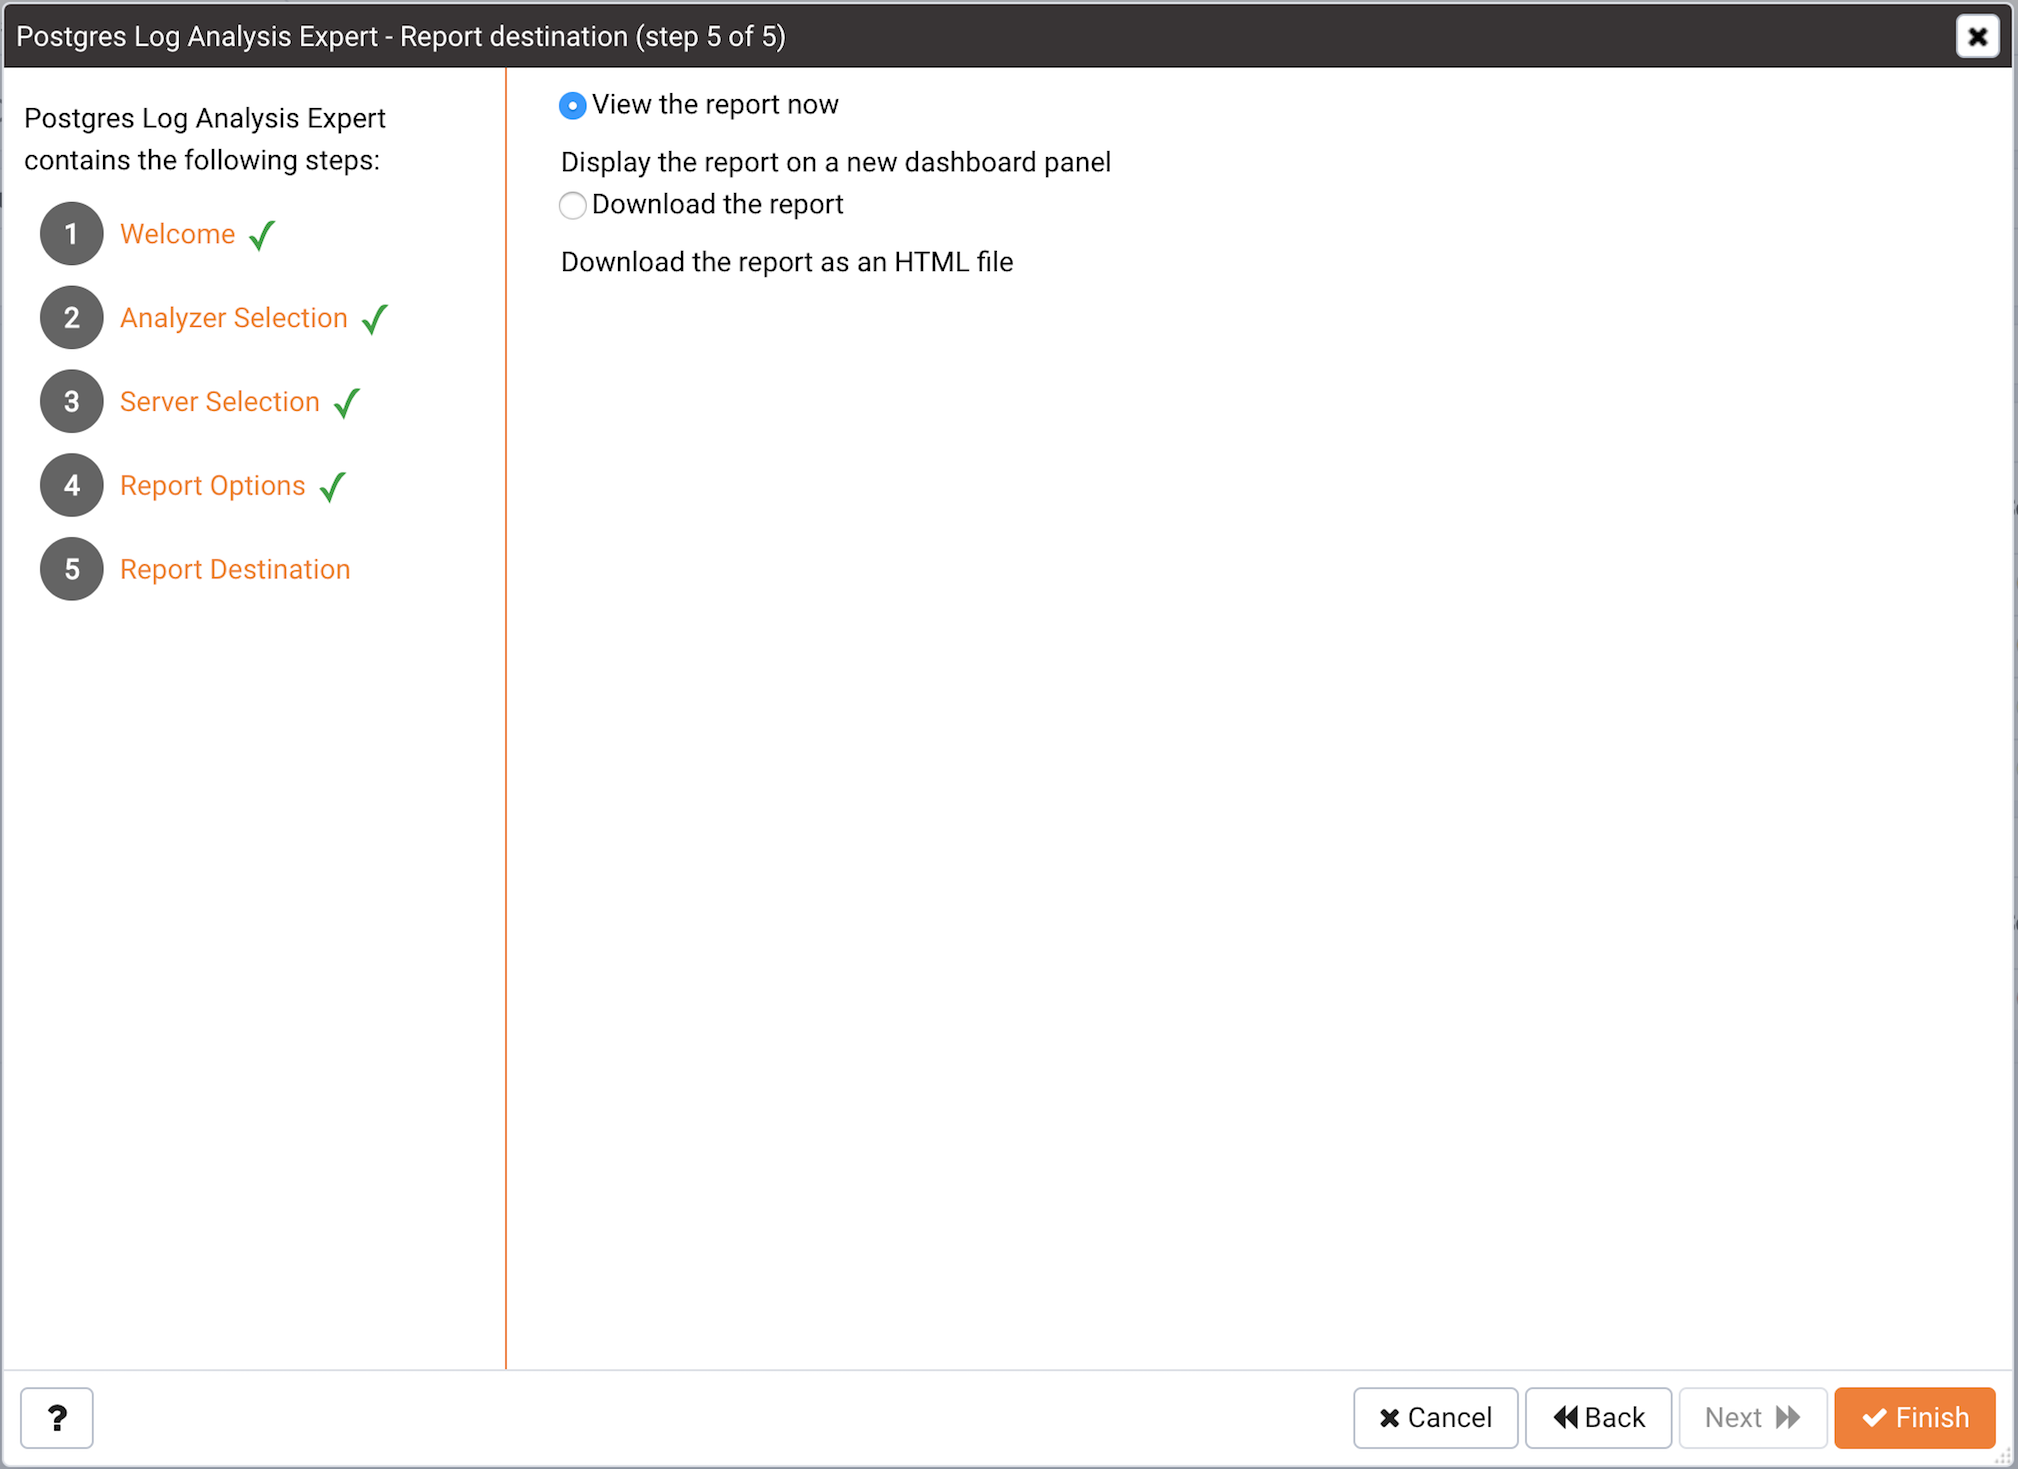
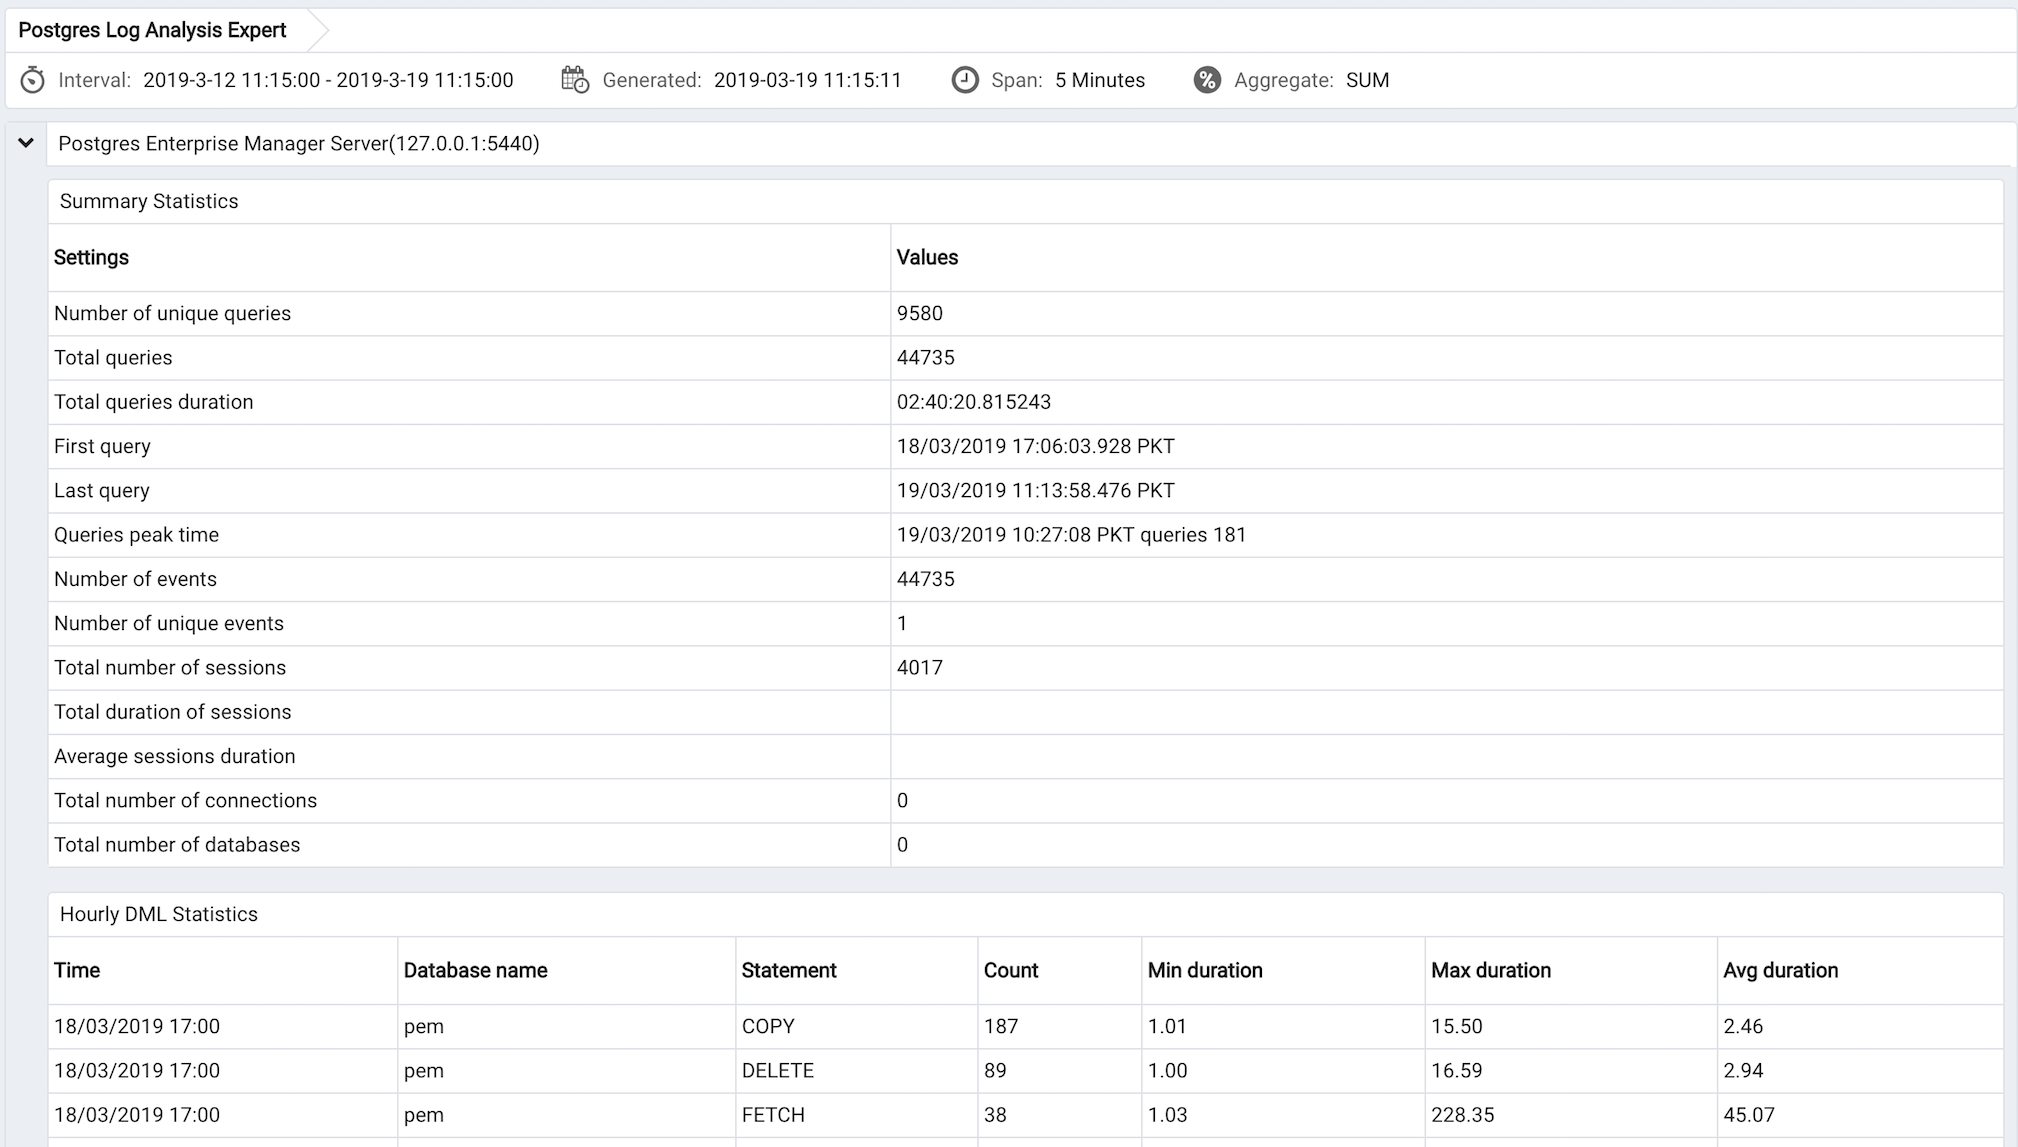
You can choose the default option and select Finish to view the Log Analysis Expert report in the PEM client's tabbed browser, or click the radio button next to
Download the report to save a copy of the report to an HTML file for later use.
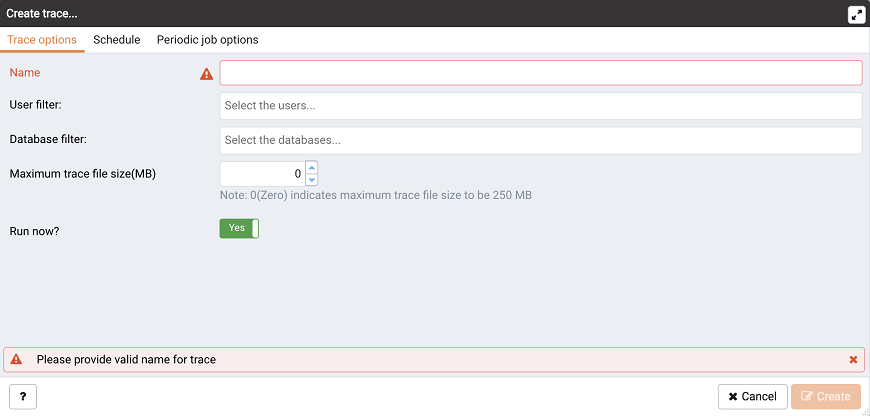
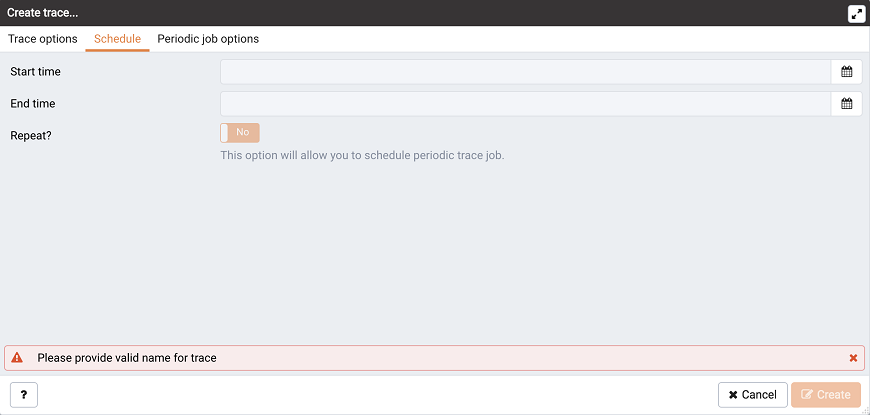
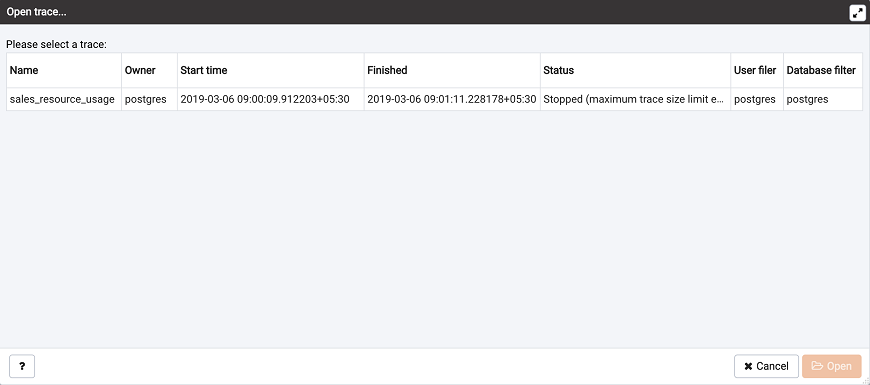
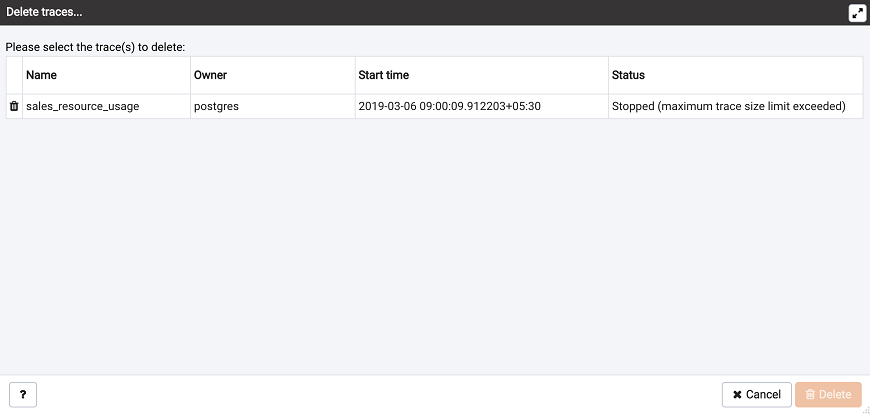
You can use the Create trace... dialog to define a SQL Trace for any database on which SQL Profiler has been installed and configured. installed and configured. To access the dialog, highlight the name of the database in the PEM client tree control; navigate through the
Management menu to the
SQL Profiler pull-aside menu, and select
Create trace....
|
•
|
Click in the User filter field to specify the roles whose queries will be included the trace; optionally, check the box next to *Select All* to include queries from all roles.
|
|
•
|
Click in the Database filter field to specify which databases to trace; optionally, check the box next to Select All to include queries against all databases.
|
|
•
|
Specify a trace size in the Maximum Trace File Size field; SQL Profiler will terminate the trace when it reaches approximately the size specified.
|
|
•
|
Specify Yes in the Run Now field to start the trace when you select the Create button; select No to enable fields on the Schedule tab.
|
|
•
|
Use the Start time field to specify the starting time for the trace.
|
|
•
|
Use the End time field to specify the ending time for the trace.
|
|
•
|
Specify Yes in the Repeat? field to indicate that the trace should be repeated every day at the times specified; select No to enable fields on the Periodic job options tab.
|
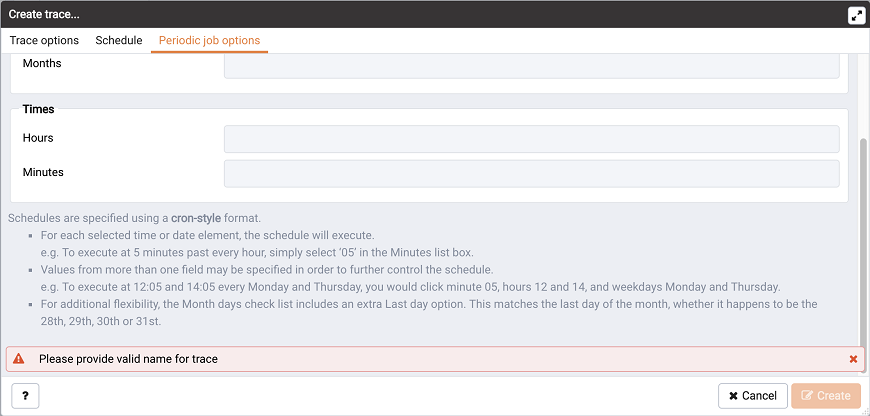
Fields on the Periodic job options tab
(see Figure 9.3) specify scheduing details about a recurring trace. Use fields in the
Days section to specify the days on which the job will execute:
|
•
|
Click in the Week days field to select the days of the week on which the trace will execute.
|
|
•
|
Click in the Month days field to select the days of the month on which the trace will execute.
|
|
•
|
Click in the Months field to select the months in which the trace will execute.
|
|
•
|
Click in the Hours field to select the hours at which the trace will execute.
|
|
•
|
Click in the Minutes field to select the hours at which the trace will execute.
|
When you've completed the Create trace... dialog, click
Create to start the newly defined trace or to schedule the trace for a later time.
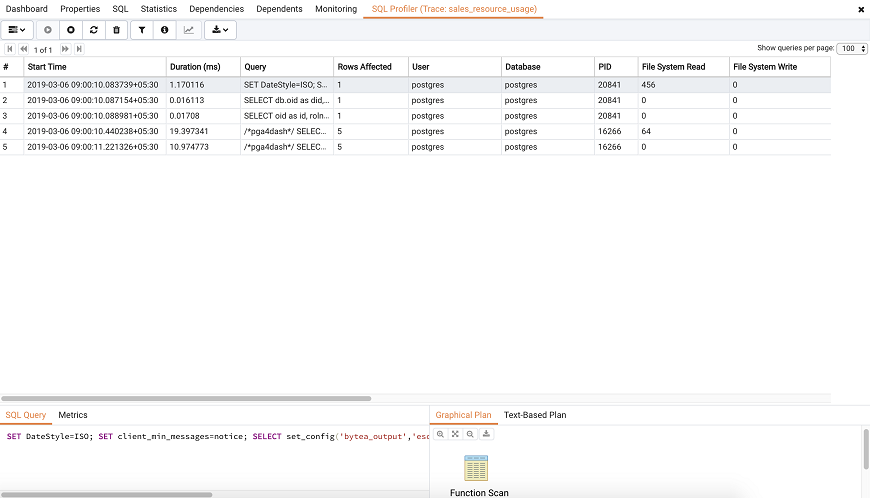
Click the Filter icon to open the
Trace Filter dialog and create a rule (or set of rules) that define a filter. Each rule will screen the events within the current trace based on the identity of the role that invoked the event, or the query type invoked during the event.
|
•
|
Use the Type drop-down listbox to specify the trace field that the filter rule will apply to.
|
|
•
|
Use the Condition drop-down listbox to specify the type of operator that SQL Profiler will apply to the Value when it filters the trace:
|
|
o
|
Select Matches to filter events that contain the specified Value.
|
|
o
|
Select Does not match to filter events that do not contain the specified Value.
|
|
o
|
Select Is equal to to filter events that contain an exact match to the string specified in the Value field.
|
|
o
|
Select Is not equal to to filter events that do not contain an exact match to the string specified in the Value field.
|
|
o
|
Select Starts with to filter events that begin with the string specified in the Value field.
|
|
o
|
Select Does not start with to filter events that do not begin with the string specified in the Value field.
|
|
o
|
Select Less than to filter events that have a numeric value less than the number specified in the Value field.
|
|
o
|
Select Greater than to filter events that have a numeric value greater than the number specified in the Value field.
|
|
o
|
Select Less than or equal to to filter events that have a numeric value less than or equal to the number specified in the Value field.
|
|
o
|
Select Greater than or equal to to filter events that have a numeric value greater than or equal to the number specified in the Value field.
|
|
•
|
Use the Value field to specify the string, number or regular expression that SQL Profiler will search for.
|
Click the Save button to save the filter definition to a file without applying the filter; to apply the filter, click
OK. Select
Cancel to exit the dialog and discard any changes to the filter.
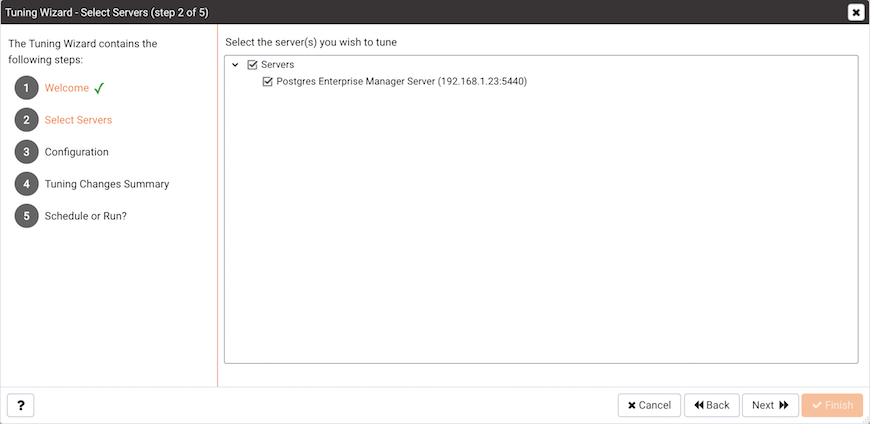
Click Next to continue to the server selection dialog (see Figure 10.2).
Expand the Servers node of the tree control to view a list of the servers that are currently monitored by PEM that are available for tuning. Check a box to the left of a server name to select the server for tuning.
Click Next to continue to the
Configuration dialog (see Figure 10.3).
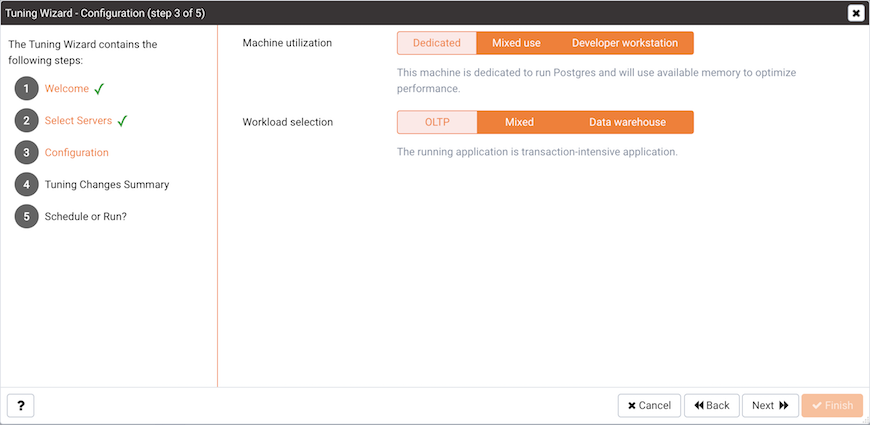
Select an option in the Machine utilization field to specify the type of work performed by the selected servers. The type of work performed by the server determines how the tuning wizard will allocate system resources:
|
•
|
Select Dedicated to dedicate the majority of the system resources to the database server.
|
|
•
|
Select Mixed use to dedicate a moderate amount of system resources to the database server.
|
|
•
|
Select Developer workstation to dedicate a relatively small amount of system resources to the database server.
|
Select an option in the Workload Selection field to specify the type of workload typically performed on the selected server:
|
•
|
Select OLTP if the selected server is used primarily to process online transaction workloads.
|
|
•
|
Select Mixed if the selected server provides a mix of transaction processing and data reporting.
|
|
•
|
Select Data warehouse if the server is used for heavy data reporting.
|
Click Next to continue to the
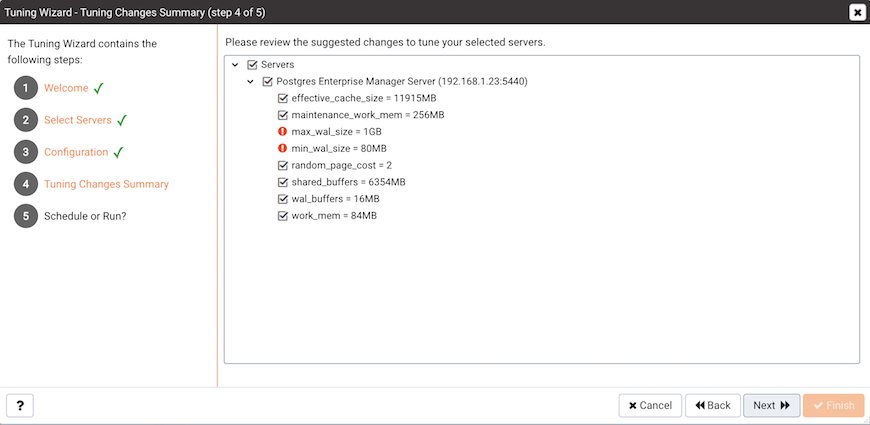
Tuning Changes Summary dialog (see Figure 10.4).
The tree control on the Tuning Changes Summary dialog displays the parameter setting modifications recommended for each server analyzed by the Tuning Wizard. Use the checkboxes next to a server or parameter name to select the recommendations that tuning wizard will either include in a preview report or apply:
Use the Schedule or Run? dialog to either specify a time that PEM will apply the changes, or generate a report that details the recommended changes.
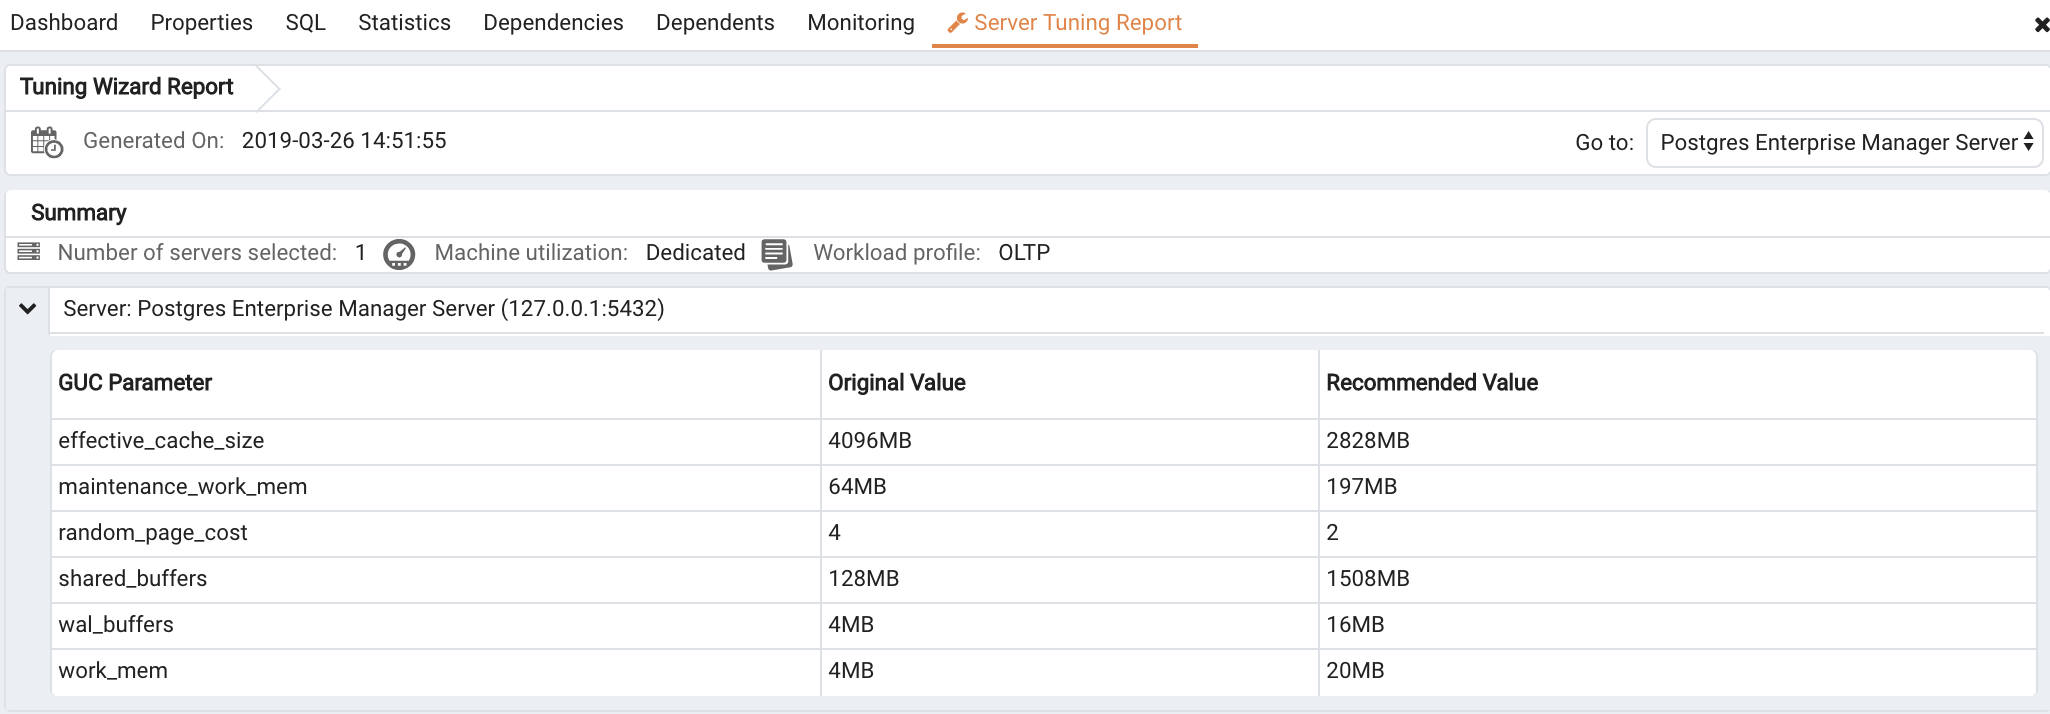
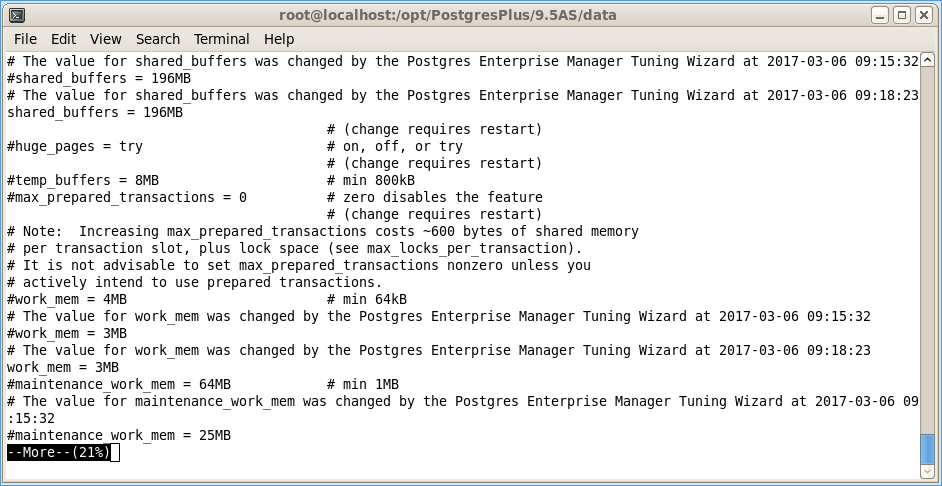
The selected actions will apply to all of the changes noted on the Tuning Changes Summary. If you opt to generate a report, PEM will create a report that contains a list of the current values and recommended modifications to the configuration parameters selected on the
Tuning Changes Summary dialog. Note that to implement changes, you will need to invoke the Tuning Wizard a second time, specifying the parameters you wish to modify on the
Tuning Changes Summary dialog.
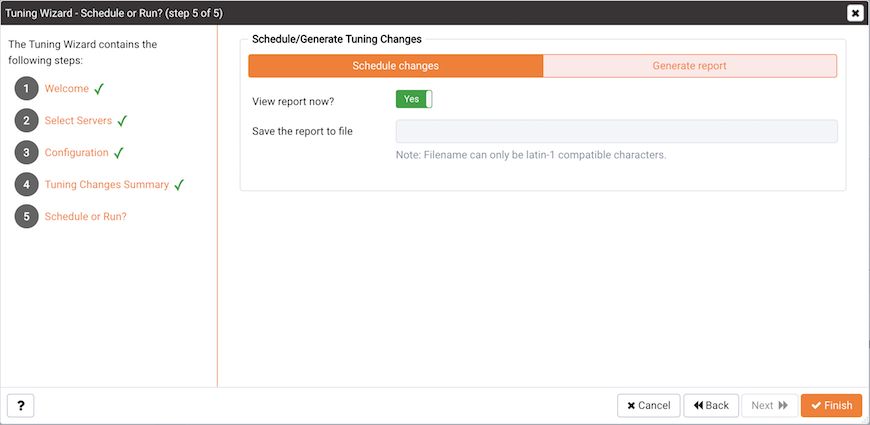
Select Schedule changes to view and specify your scheduling options (see Figure 10.5).
|
•
|
Set the Configuration now? slider to Yes to apply the tuning wizard's recommendations and restart the server now.
|
|
•
|
Set the Configuration now? slider to No to enable the Time? field and use the calendar selector to specify a time for PEM to apply the tuning wizard's recommendations and restart the server. Note that if you schedule a time for the changes to be applied, you will not be provided with a preview of the change recommendations.
|
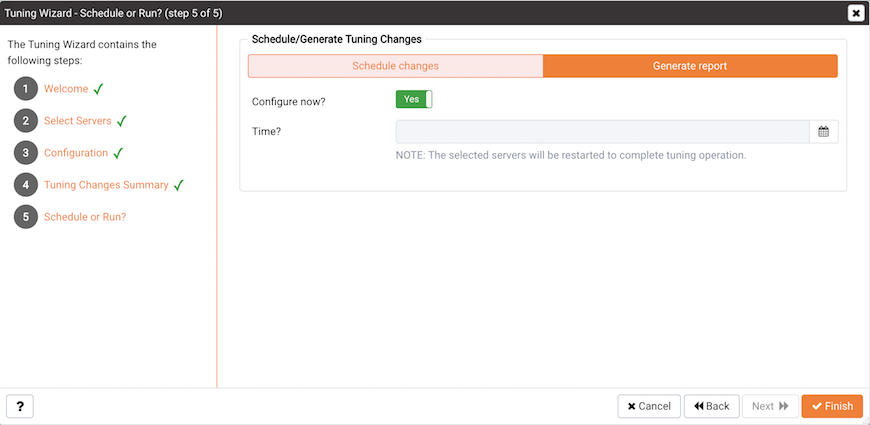
Select Generate report to view your report options (see Figure 10.6).
|
•
|
Set the View report now? slider to Yes to display the Tuning Wizard report onscreen.
|
|
•
|
Set the View report now? slider to No to enable the Save the report to file field and use the calendar selector to specify a file name and location to which PEM will write the Tuning Wizard report.
|
Click the Finish button to either apply the Tuning Wizard's modifications or generate a report (see Figure 10.7) and exit the Tuning Wizard.
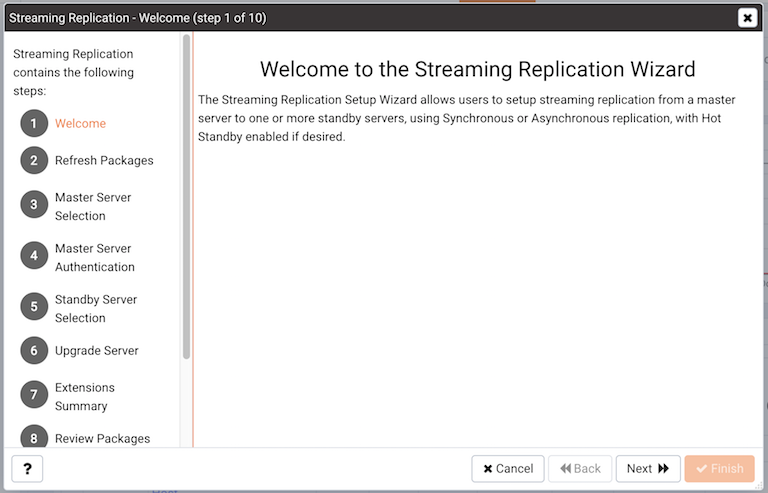
Figure 12.1
– The Streaming Replication wizard's Welcome window.
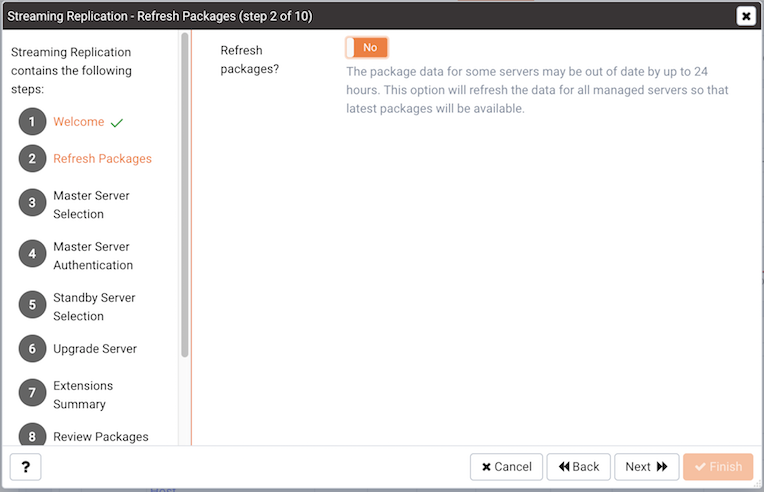
Click Next to continue. The
Refresh Packages dialog opens (see Figure 12.2), offering you the option to refresh the package data that is stored on the PEM server about the currently installed packages.
The PEM installed_
packages probe retrieves information about the currently installed packages that reside on hosts that are monitored by PEM agents. Select
Yes to invoke the probe and update the information that is stored on the PEM server. If you have not added servers to the monitored hosts since the last probe execution (by default, the
installed_
packages probe executes once every 24 hours), click
No to continue without executing the probe.
|
•
|
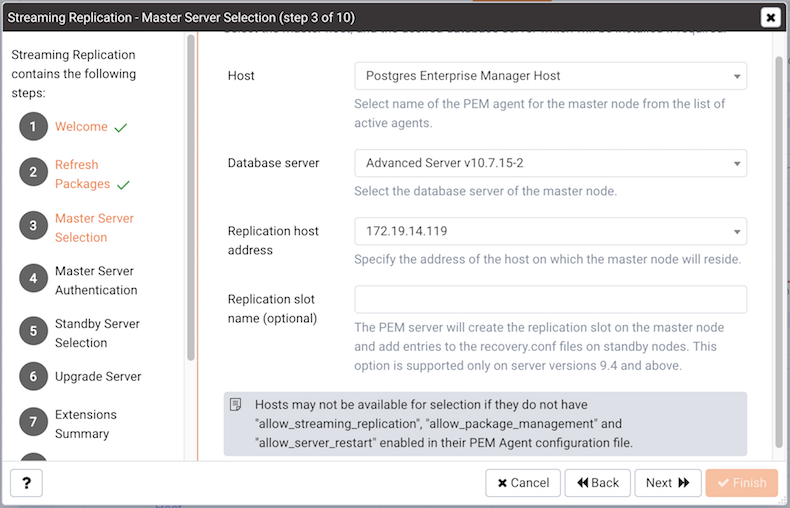
Use the drop-down listbox in the Host field to select the name of the PEM agent that monitors the master node from the list of active agents. To be displayed in the listbox, the agent must be configured with allow_streaming_replication, allow_package_management, and allow_server_restart enabled (set to true) in the PEM Agent configuration file. Please note that each node of a replication scenario must have a resident agent; remote monitoring of replication nodes is not supported.
|
|
•
|
Optionally, provide a name for a replication slot in the Replication slot name field; the PEM server will create the replication slot on the master node, and add entries to the recovery.conf files on standby nodes. A replication slot name can contain lower-case letters, numbers, and the underscore character. This option is valid only for database server versions 9.4 and above.
|
|
•
|
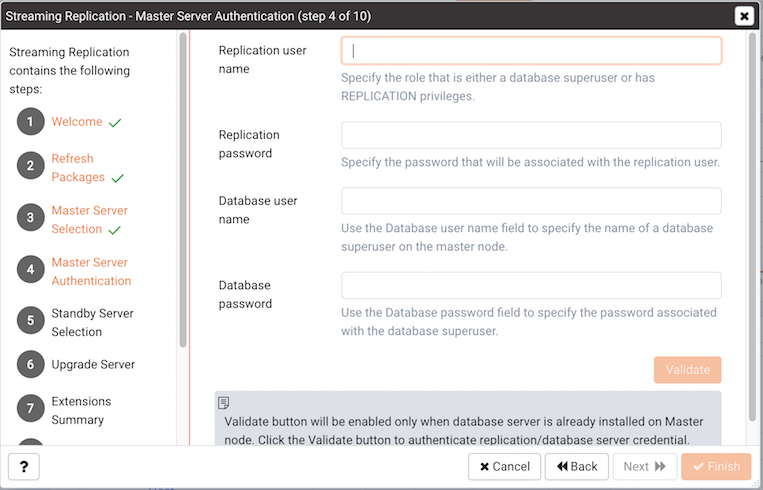
Use the Replication user name field to specify the name of an existing role that is either a database superuser or has REPLICATION privileges, or the name of a role that will be created by PEM for use during replication-related transactions. Please note that PEM will return an error if you specify the name of an existing user with insufficient privileges.
|
|
•
|
Use the Replication password field to specify the password that will be associated with the replication user.
|
|
•
|
Use the Database user name field to specify the name of a database superuser on the master node.
|
|
•
|
Use the Database password field to specify the password associated with the database superuser.
|
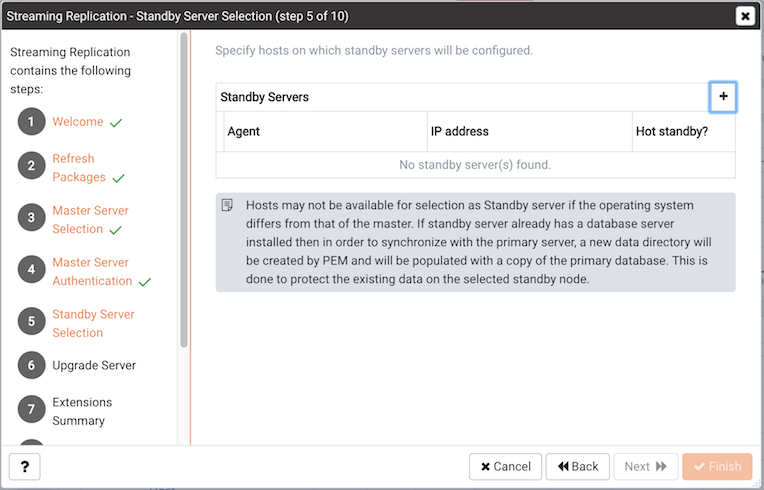
Use the table on the Standby Server Selection dialog (see Figure 12.5) to provide properties of one or more standby nodes. Click the add icon (+) to add an entry to the table.
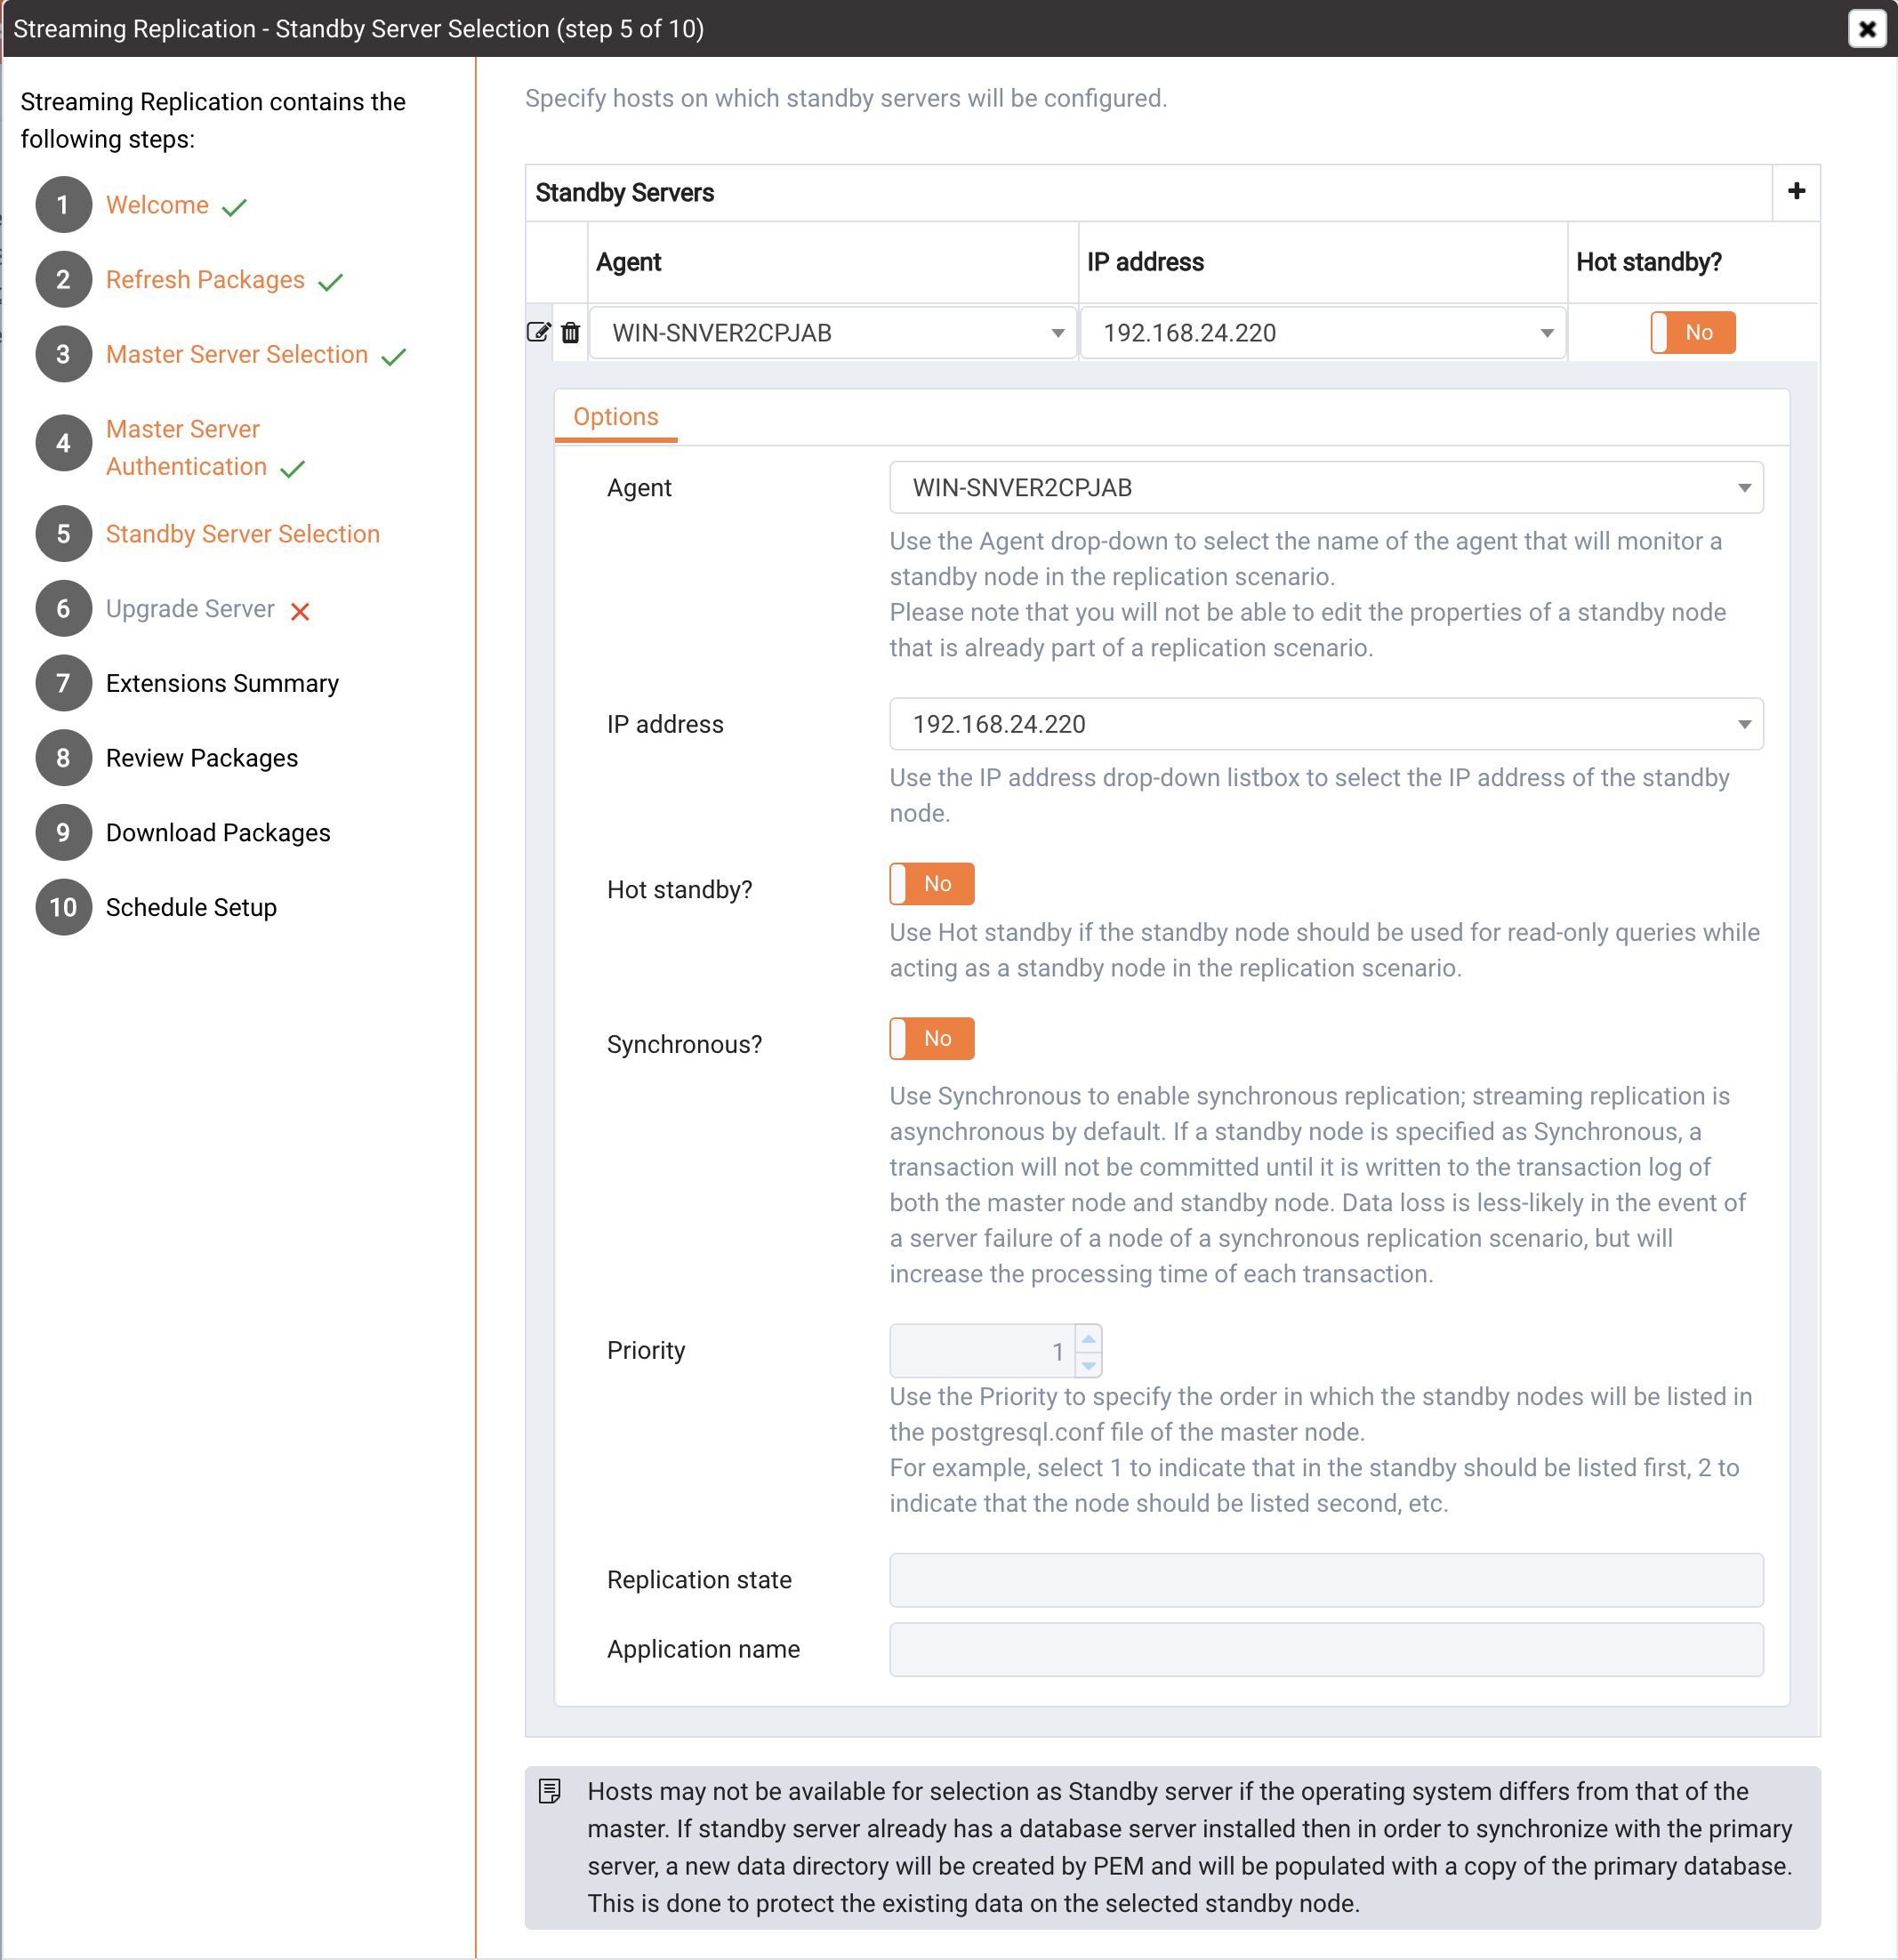
Use the Standby Server Options form (see Figure 12.6) to provide information about the standby node:
|
•
|
Use the Agent drop-down listbox to select the name of the agent that resides on the standby node in the replication scenario. Please note that you will not be able to edit the properties of a standby node that is already part of a replication scenario.
|
|
•
|
Use the IP address drop-down listbox to select the IP address of the standby node.
|
|
•
|
Set the Hot standby field to Yes if the standby node should be used for read-only queries while acting as a standby node in the replication scenario.
|
|
•
|
Set the Synchronous? field to Yes to enable synchronous replication; streaming replication is asynchronous by default. If a standby node is specified as Synchronous, a transaction will not be committed until it is written to the transaction log of both the master node and standby node.
|
|
•
|
Use the Priority drop-down listbox to specify the order in which the standby nodes will be listed in the postgresql. conf file of the master node. For example, select 1 to indicate that in the standby should be listed first, 2 to indicate that the node should be listed second, etc.
|
Click the Add/
Change button to add another standby node to the list of servers, or the
Edit icon to modify the values associated with a server in the list. Use the
Delete icon to remove a standby definition from the table. When you've finished defining the standby nodes, click
Next.
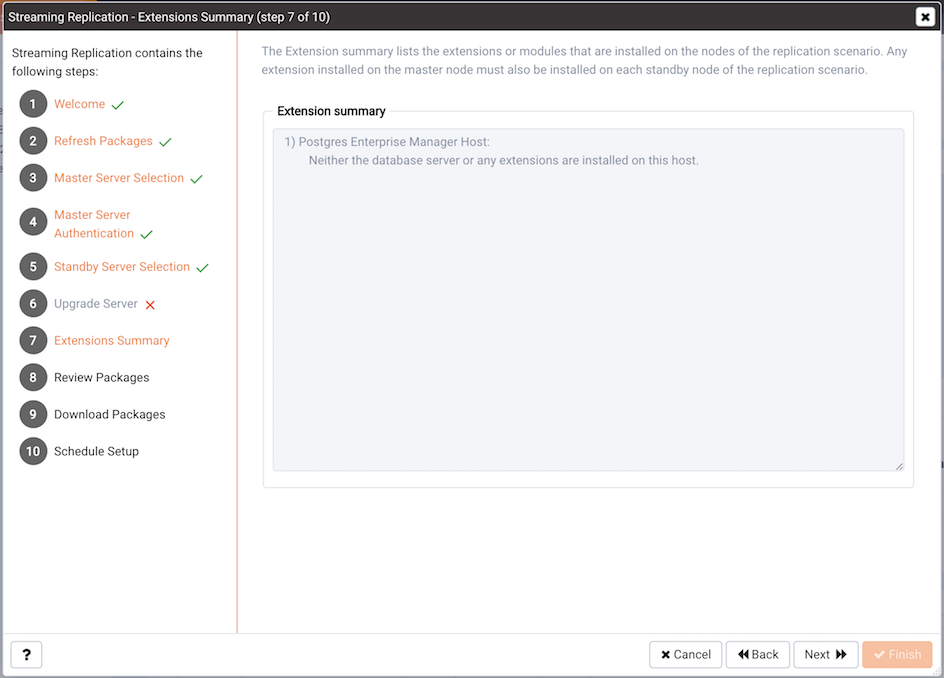
Figure 12.7 - The wizard's upgrade and extension window.
The Extension Summary panel (see Figure 12.7) lists the extensions or modules that are installed on the nodes of the replication scenario. Any extension installed on the master node must also be installed on each standby node of the replication scenario.
The data directory for the cluster may be created in a non-default location. If you move the
data directory from the path specified during the installation, you must update the path specified in the
/etc/postgres-reg.ini file.
The Download Packages dialog (see Figure 12.9) displays a list of the packages that will be required to install the configured replication scenario. Click
Back to return to a previous screen and modify the selections, or click
Start Download to begin downloading the packages that will be used for the installation.
Figure 12.10 - Select a time to configure replication.
Use fields on the Schedule Setup dialog (see Figure 12.10) to specify the most convenient time for the server to configure the replication scenario:
|
•
|
Set Setup now? to Yes to instruct PEM that it should install and configure streaming replication immediately.
|
|
•
|
Set Setup now? to No to enable the date and time selectors; use the selectors to specify when you would like PEM to (optionally) perform installations and configure streaming replication.
|
Click Finish to save your choice and exit the wizard; PEM will either begin the installation and configuration process or schedule the installation and configuration for the specified time. You can review the job schedule and job progress on the
Scheduled Tasks tab; to open the Scheduled Tasks tab, highlight the name of the PEM agent for which you wish to review the job queue and select
Scheduled Tasks... from the
Management menu. When the Streaming Replication installation wizard completes, you can register the servers and monitor the replication scenario on the Streaming Replication dashboard.
active/active – In an active/active cluster, the master node or nodes manages write transactions while the standby nodes are available for read requests. Streaming Replication
with hot standby or EDB Postgres Multi-Master Replication manage active/active clusters. If you are using an active/active replication scenario, you probably have a PEM agent on each node of the cluster, and are actively monitoring each node with PEM.
active/passive – In an active/passive cluster, only the master node is used for read and write transactions. Standby nodes ensure that in the event of a failure of the master node, a complete backup is available to replace the master node. RHCS (Red Hat Cluster Suite), Veritas Replicator, or Streaming Replication
without hot standby manage active/passive clusters. If you are using an active/passive replication scenario, you are probably only actively monitoring the master node of your replication scenario with PEM.
Where $TMPDIR is the temporary directory for the user account under which the agent runs.
The user account is usually root on a Linux system or Administrator on Windows. You can override the directory path by specifying a value for the AgentFlagDir configuration option in the registry on Windows, or in the agent_flag_dir parameter in the agent configuration file on Linux.
agent_id is the numeric identifier of the agent that should takeover the monitoring of the server
server_id is the numeric identifier of the server that will be taken over.
To find the agent_id and server_id, log into the PEM client, and highlight the name of the agent or server; the numeric identifier will be displayed in the ID row on the Properties pane of the PEM client.
Use the Last drop-down list
box to select the duration for which you want to see the chart. Select the 1 hour, 4 hours, 12 hours, or 24 hours. You can also select the date and time through which you want the data to be displayed (see Figure 15.3).
The first chart displays the number of wait events that have occurred over the period of time that is selected for the charts.
You can narrow down the timeline
in the first chart to analyze the data for a specific period (see Figure 15.4). The second chart displays the total number of wait events of each type, for the timeline that you select in the first chart. You can select the specific wait event types for which you want to analyze the data.
|
•
|
The SQL tab displays the list of SQL queries having wait events for the selected sample time (see Figure 15.5).
|
|
•
|
The Users tab displays the details of the wait events grouped by users for selected sample time.
|
|
•
|
The Waits tab displays the number of wait events belonging to each wait event type for the selected sample time.
|
Click on the Eye icon in any row to display a new
tab with details of the query for a particular row. This
tab displays the Query ID and its corresponding sessions IDs in a dropdown list. Select the session ID for the query for which you want to analyze the data; the tab will display details corresponding to the selected session ID and query ID.
The Waits information table displays the SQL query (see Figure 15.6). If the SQL query is being displayed partially, click the down arrow at the bottom of the section to view the complete SQL query.
The Wait Types panel (see Figure 15.7) displays the total number of wait events for the selected session ID and query ID. Select a time range
in the first chart to analyze the data for a specific period.
The Wait Types bar graph displays the total number of wait event types for the duration that you select. To make differentiation easier, each wait event type is represented by a different color in the bar graph.
In the Wait Events donut chart (see Figure 15.8), all the wait event types applicable to the selected timeline are displayed a percentage format. You can select any one wait event type to see all the wait events belonging to that particular wait event type and their count. Click the Read More link to read about the various wait event types and wait events.