Debugger
The Debugger gives developers and DBAs the ability to test and debug server-side programs using a graphical, dynamic environment. The types of programs that can be debugged are SPL stored procedures, functions, triggers, and packages as well as PL/pgSQL functions and triggers.
The Debugger is integrated with pgAdmin 4 and EDB Postgres Enterprise
Manager. If you have installed Advanced Server on a Windows host,
pgAdmin 4 is automatically installed; you will find the pgAdmin 4 icon
in the Windows Start menu. If your Advanced Server host is on a
CentOS or Linux system, you can use yum to install pgAdmin4. Open a
command line, assume superuser privileges, and enter:
yum install edb-pgadmin4*
On Linux, the edb-asxx-server-pldebugger RPM package where xx is
the Advanced Server version number, must be installed as well.
Information about pgAdmin 4 is available at:
The RPM installation will add the pgAdmin4 icon to your Applications menu.
There are two basic ways the Debugger can be used to test programs:
**Standalone Debugging.** The Debugger is used to start the program to be tested. You supply any input parameter values required by the program and you can immediately observe and step through the code of the program. Standalone debugging is the typical method used for new programs and for initial problem investigation.
**In-Context Debugging.** The program to be tested is initiated by an application other than the Debugger. You first set a *global breakpoint* on the program to be tested. The application that makes the first call to the program encounters the global breakpoint. The application suspends execution at which point the Debugger takes control of the called program. You can then observe and step through the code of the called program as it runs within the context of the calling application. After you have completely stepped through the code of the called program in the Debugger, the suspended application resumes execution. In-context debugging is useful if it is difficult to reproduce a problem using standalone debugging due to complex interaction with the calling application.
The debugging tools and operations are the same whether using standalone or in-context debugging. The difference is in how the program to be debugged is invoked.
The following sections discuss the features and functionality of the Debugger using the standalone debugging method. The directions for starting the Debugger for in-context debugging are discussed in the Setting Global Breakpoint for In-Context Debugging.
Configuring the Debugger
Before using the Debugger, edit the postgresql.conf file (located in
the data subdirectory of your Advanced Server home directory),
adding $libdir/plugin_debugger to the libraries listed in the
shared_preload_libraries configuration parameter:
shared_preload_libraries = '$libdir/dbms_pipe,$libdir/edb_gen,$libdir/plugin_debugger'
On Linux, the `postgresql.conf` file is located in: `/var/lib/edb/asxx/data`
On Windows, the `postgresql.conf` file is located in: `C:\Program Files\edb\asxx\data`
Where xx is the version of Advanced Server.
After modifying the shared_preload_libraries parameter, you must
restart the database server.
Starting the Debugger
Use pgAdmin 4 to access the Debugger for standalone debugging. To open
the Debugger, highlight the name of the stored procedure or function you
wish to debug in the pgAdmin 4 Browser panel. Then, navigate through
the Object menu to the Debugging menu and select Debug from
the submenu.
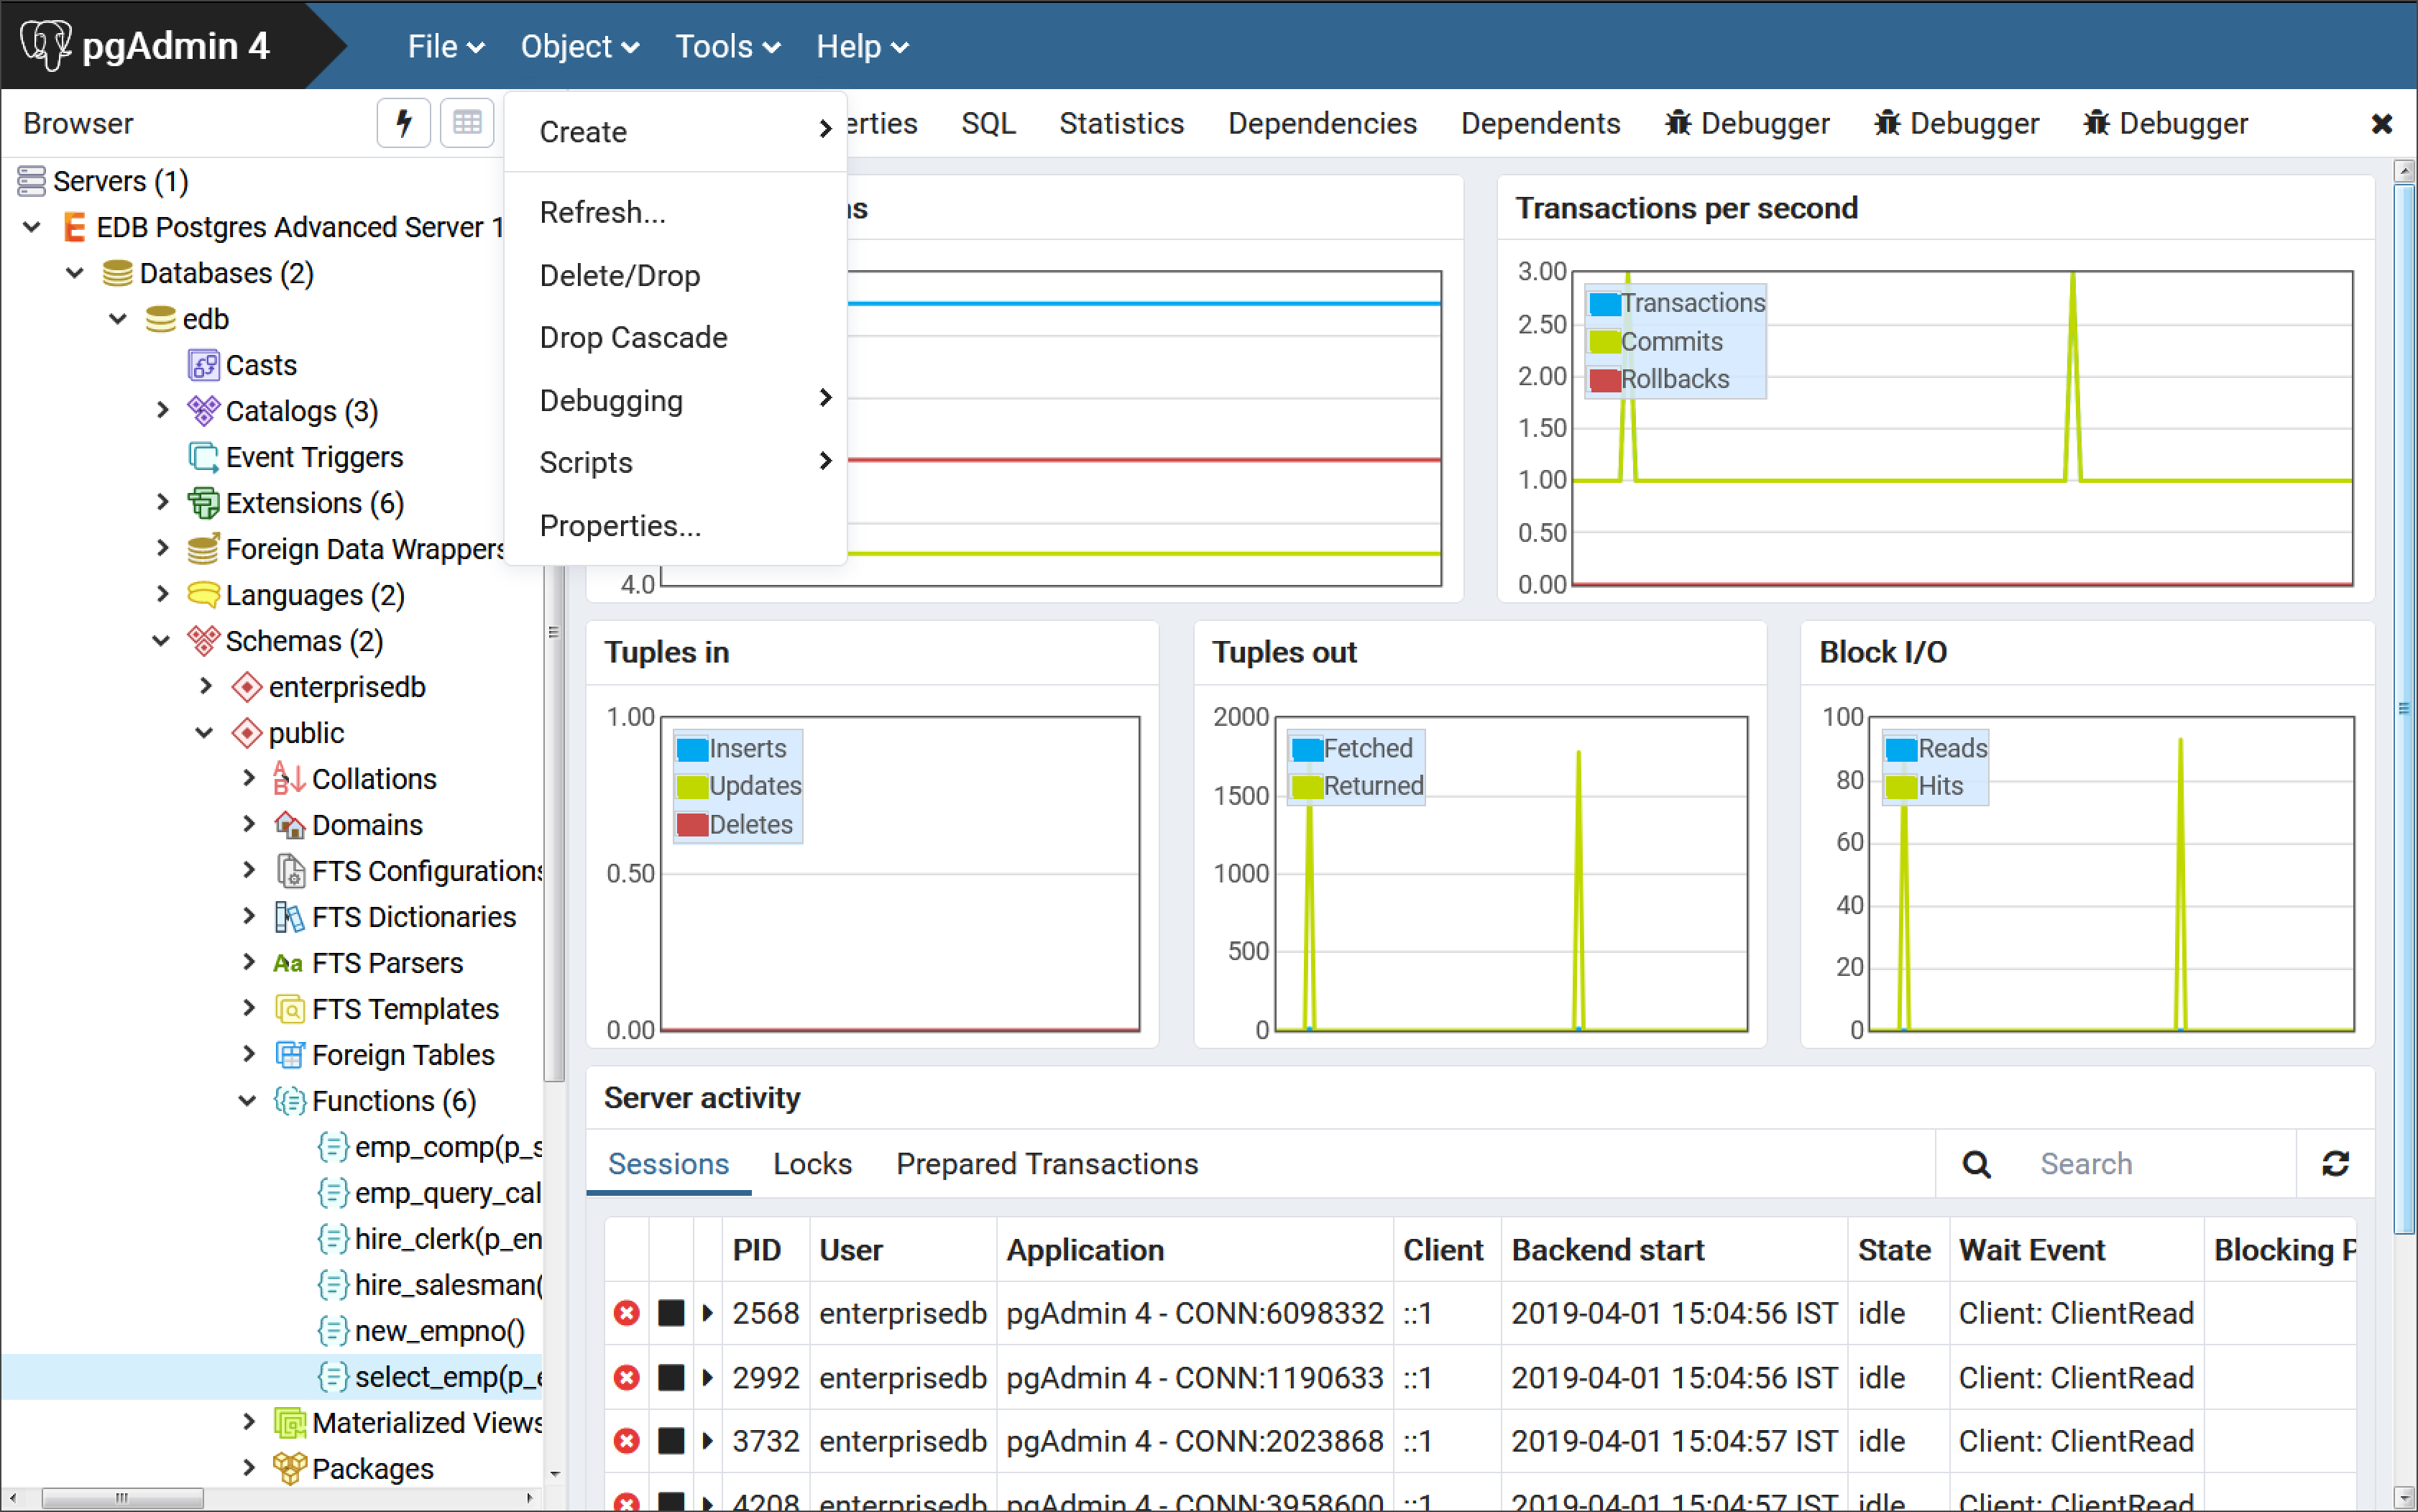
Starting the Debugger from the Object menu
Fig. 1: Starting the Debugger from the Object menu
You can also right-click on the name of the stored procedure or function
in the pgAdmin 4 Browser, and select Debugging, and the
Debug from the context menu.

Starting the Debugger from the object’s context menu
Fig. 2: Starting the Debugger from the Object’s context menu
Note that triggers cannot be debugged using standalone debugging. Triggers must be debugged using in-context debugging. See the Setting Global Breakpoint for In-Context Debugging for information on setting a global breakpoint for in-context debugging.
To debug a package, highlight the specific procedure or function under the package node of the package you wish to debug and follow the same directions as for stored procedures and functions.
The Debugger Window
You can use the Debugger window to pass parameter values when you
are standalone-debugging a program that expects parameters. When you
start the debugger, the Debugger window opens automatically to
display any IN or IN OUT parameters expected by the program. If
the program declares no IN or IN OUT parameters, the
Debugger window does not open.

The Debugger window
Fig. 3: The Debugger window
Use the fields on the Debugger window to provide a value for each
parameter:
The `Name` field contains the formal parameter name.
The `Type` field contains the parameter data type.
Check the `Null?` checkbox to indicate that the parameter is a `NULL` value.
Check the `Expression?` checkbox if the `Value` field contains an expression.
The `Value` field contains the parameter value that will be passed to the program.
Check the `Use Default?` checkbox to indicate that the program should use the value in the `Default Value` field.
The `Default Value` field contains the default value of the parameter.
Press the Tab key to select the next parameter in the list for data
entry, or click on a Value field to select the parameter for data
entry.
If you are debugging a procedure or function that is a member of a
package that has an initialization section, check the
Debug Package Initializer check box to instruct the Debugger to step
into the package initialization section, allowing you to debug the
initialization section code before debugging the procedure or function.
If you do not select the check box, the Debugger executes the package
initialization section without allowing you to see or step through the
individual lines of code as they are executed.
After entering the desired parameter values, click the Debug button
to start the debugging process. Click the Cancel button to terminate
the Debugger.
!!! Note * The Debugger window does not open during in-context
debugging. Instead, the application calling the program to be debugged
must supply any required input parameter values.
When you have completed a full debugging cycle by stepping through the
program code, the Debugger window re-opens, allowing you to enter
new parameter values and repeat the debugging cycle, or end the
debugging session.
Main Debugger Window
The Main Debugger window contains two panels:
The top `Program Body` panel displays the program source code.
The bottom `Tabs` panel provides a set of tabs for different information.
Use the Tool Bar icons located at the top panel to access debugging
functions.

The Main Debugger window
Fig. 4: The Main Debugger window
The two panels are described in the following sections.
The Program Body Panel
The Program Body panel displays the source code of the program that
is being debugged.

The Program Body
Fig. 5: The Program Body
The figure shows that the Debugger is about to execute the SELECT
statement. The blue indicator in the program body highlights the next
statement to execute.
The Tabs Panel
You can use the bottom Tabs panel to view or modify parameter values
or local variables, or to view messages generated by RAISE INFO and
function results.
The following is the information displayed by the tabs in the panel:
The `Parameters` tab displays the current parameter values.
The `Local variables` tab displays the value of any variables declared within the program.
The `Messages` tab displays any results returned by the program as it executes.
The `Results` tab displays program results (if applicable) such as the value from the `RETURN` statement of a function.
The `Stack tab` displays the call stack.
The following figures show the results from the various tabs.
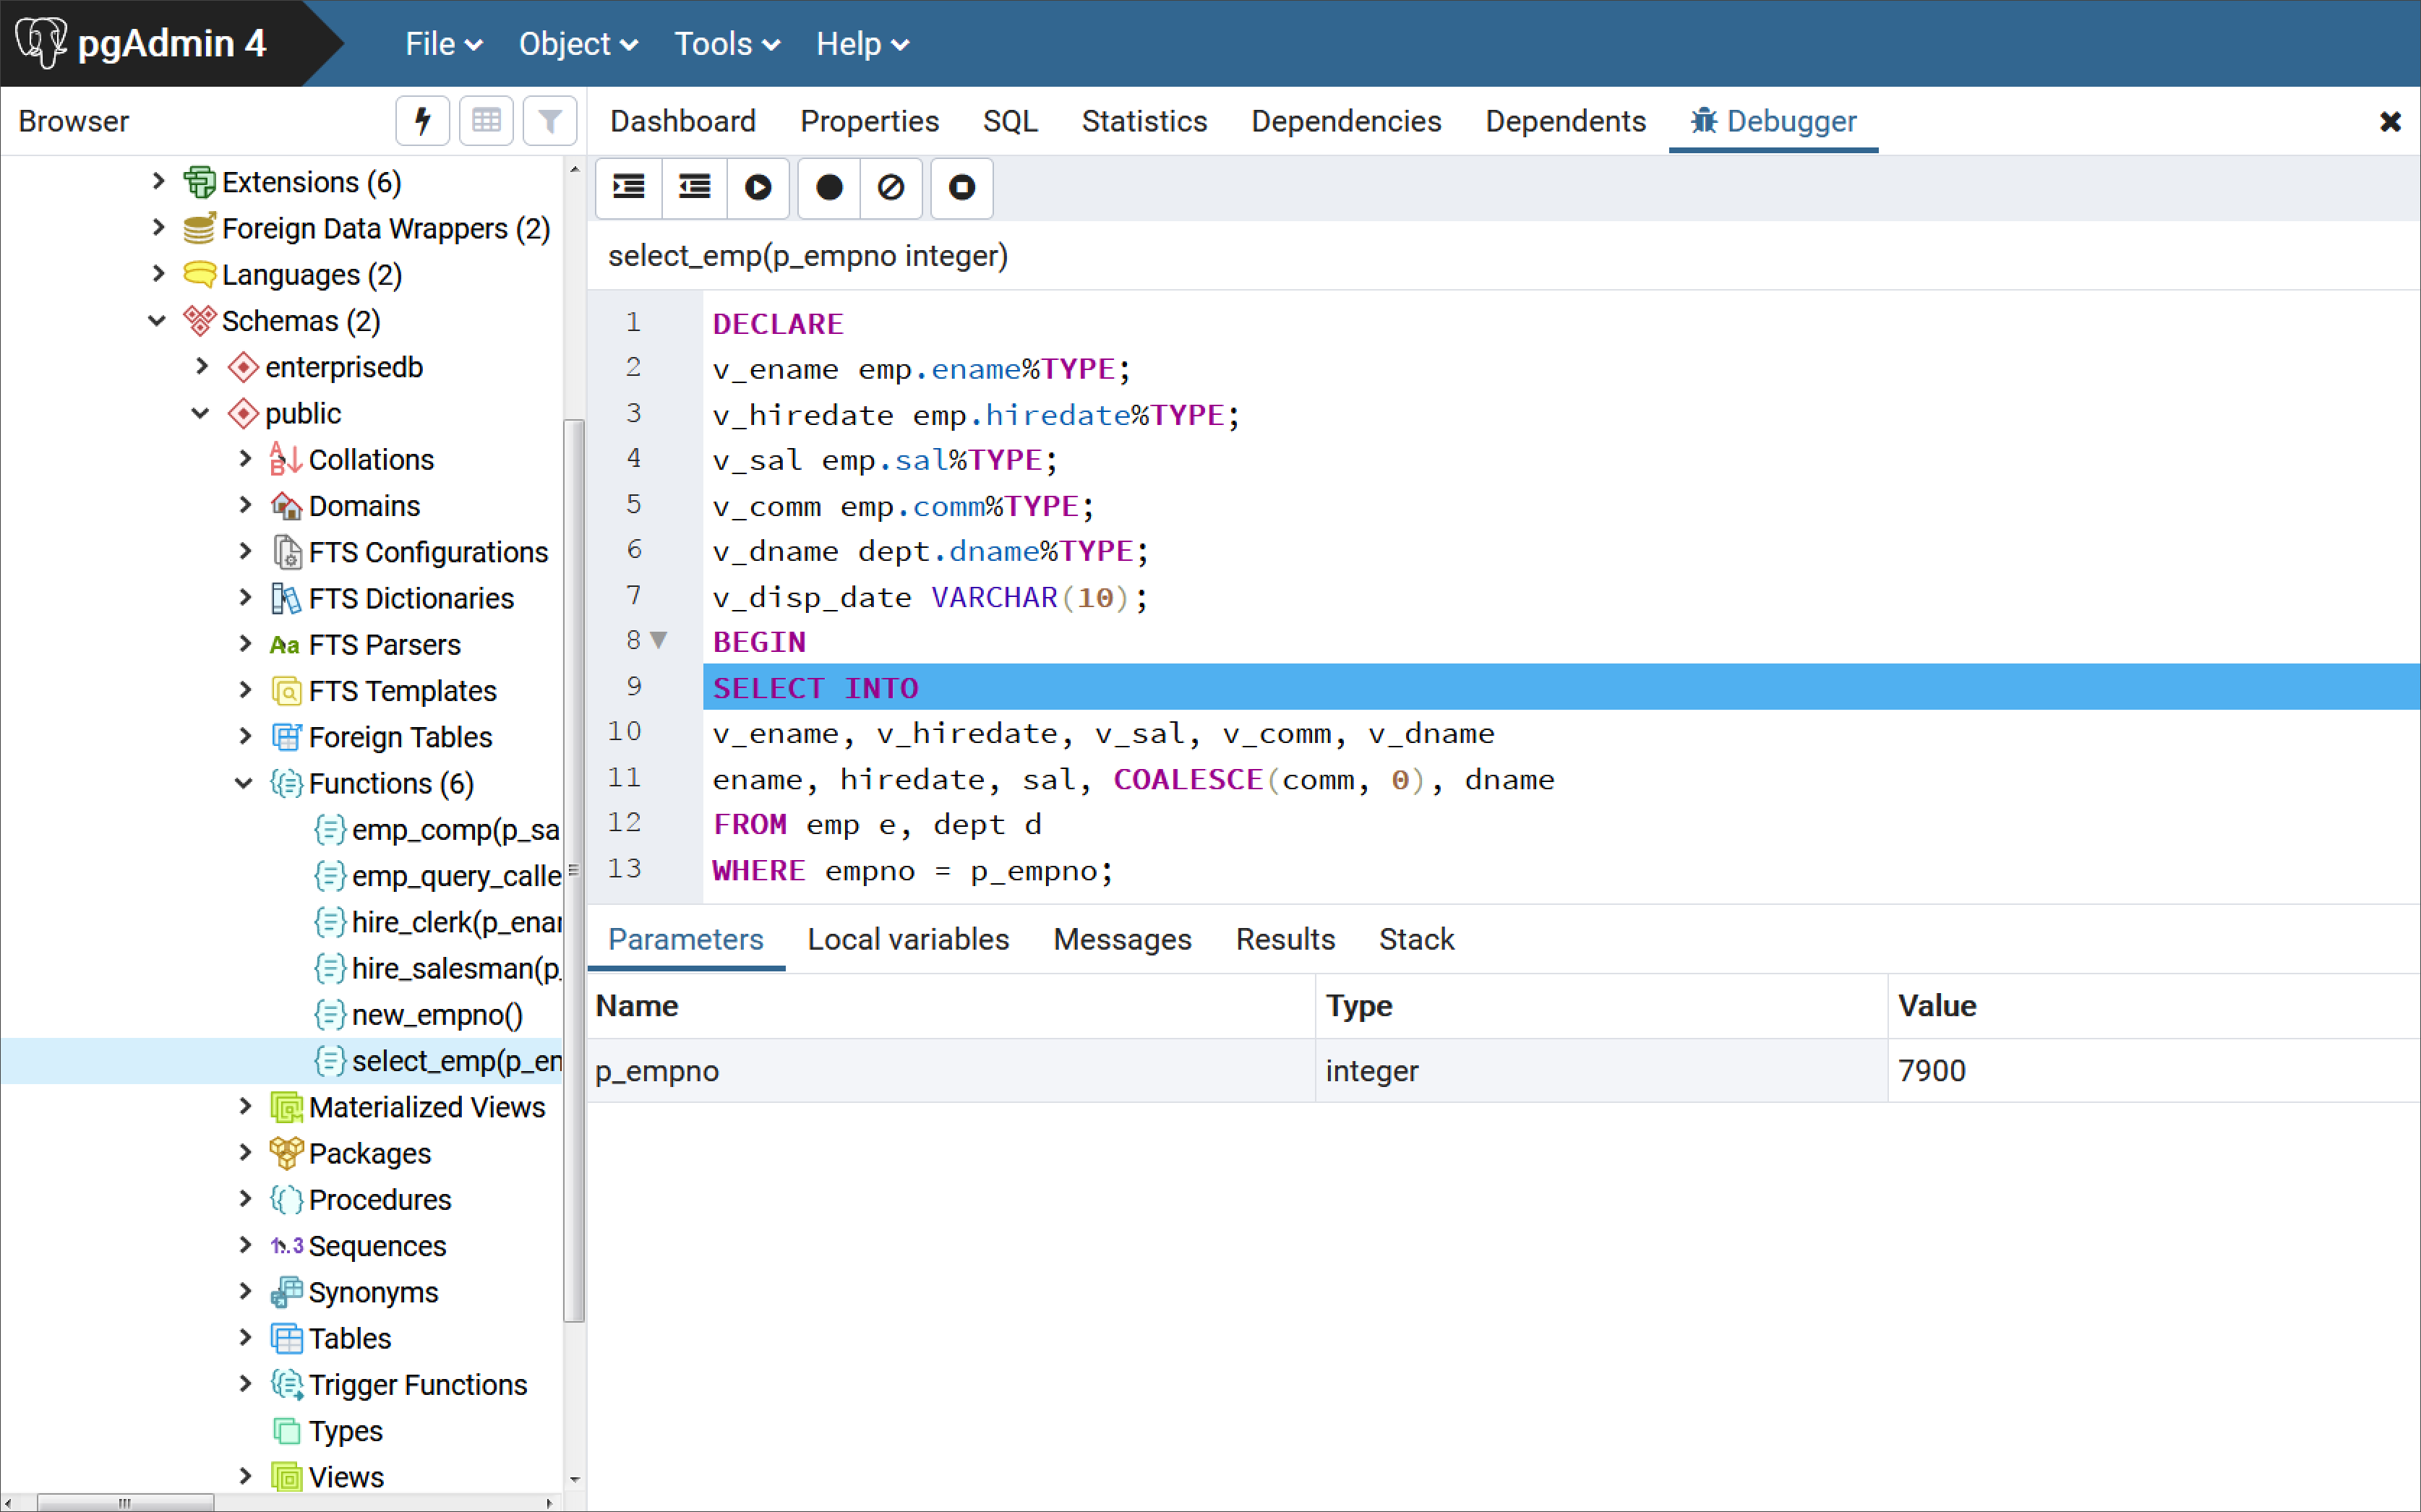
The Parameters tab
Fig. 6: The Parameters tab
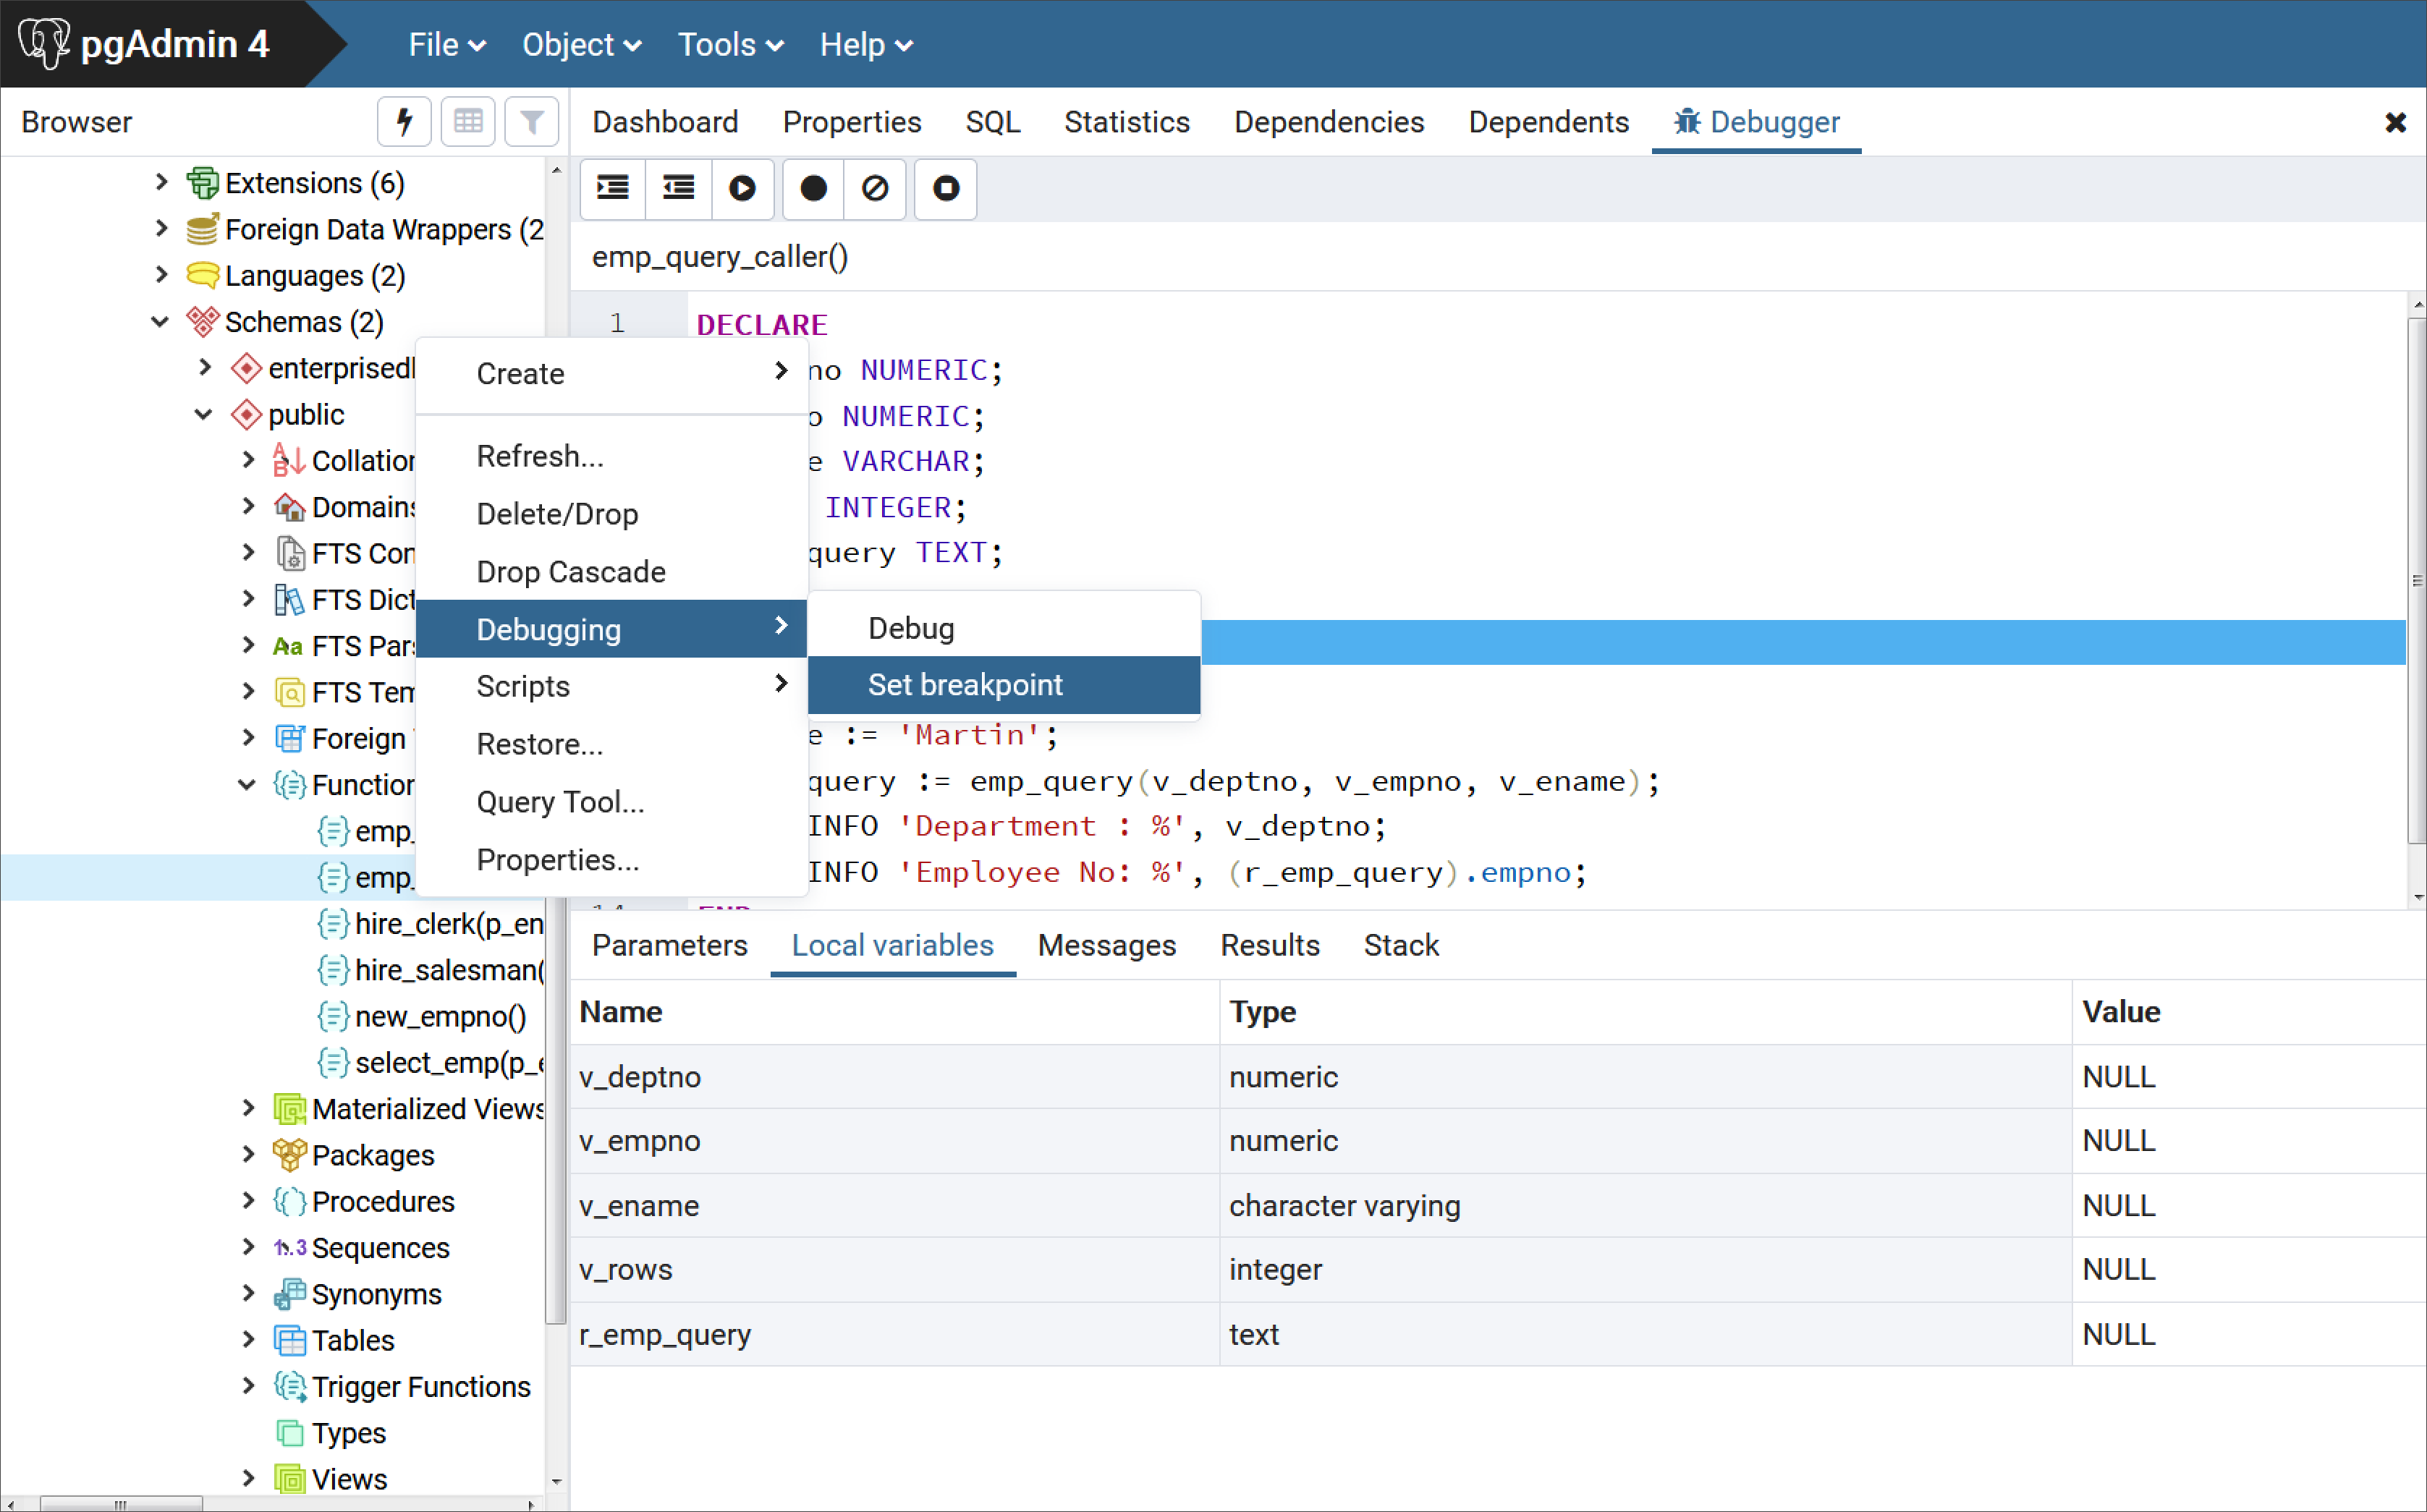
The Local variables tab
Fig. 7: The Local variables tab

The Messages tab
Fig. 8: The Messages tab

The Results tab
Fig. 9: The Results tab
The Stack Tab
The Stack tab displays a list of programs that are currently on the
call stack (programs that have been invoked, but which have not yet
completed). When a program is called, the name of the program is added
to the top of the list displayed in the Stack tab. When the program
ends, its name is removed from the list.
The Stack tab also displays information about program calls. The
information includes:
The location of the call within the program
The call arguments
The name of the program being called
Reviewing the call stack can help you trace the course of execution through a series of nested programs.

A debugged program calling a subprogram
Fig. 10: A debugged program calling a subprogram
The above figure shows that emp_query_caller is about to call a
subprogram named emp_query. emp_query_caller is currently at the
top of the call stack.
After the call to emp_query executes, emp_query is displayed at
the top of the Stack tab, and its code is displayed in the
Program Body panel.
Debugging the called subprogram
Fig. 11: Debugging the called subprogram
Upon completion of execution of the subprogram, control returns to the
calling program (emp_query_caller), now displayed at the top of the
Stack tab.
Control returns from debugged subprogram
Fig. 12: Control returns from debugged subprogram
Debugging a Program
You can perform the following operations to debug a program:
Step through the program one line at a time
Execute the program until you reach a breakpoint
View and change local variable values within the program
Stepping Through the Code
Use the tool bar icons to step through a program with the Debugger:

The Tool bar icons
Fig. 13: The Tool bar icons
The icons serve the following purposes:
**Step into.** Click the `Step into` icon to execute the currently highlighted line of code.
**Step over.** Click the `Step over` icon to execute a line of code, stepping over any sub-functions invoked by the code. The sub-function executes, but is not debugged unless it contains a breakpoint.
**Continue/Start.** Click the `Continue/Start` icon to execute the highlighted code, and continue until the program encounters a breakpoint or completes.
**Stop.** Click the `Stop` icon to halt the execution of a program.
Using Breakpoints
As the Debugger executes a program, it pauses whenever it reaches a breakpoint. When the Debugger pauses, you can observe or change local variables, or navigate to an entry in the call stack to observe variables or set other breakpoints. The next step into, step over, or continue operation forces the debugger to resume execution with the next line of code following the breakpoint. There are two types of breakpoints:
Local Breakpoint - A local breakpoint can be set at any executable line of code within a program. The Debugger pauses execution when it reaches a line where a local breakpoint has been set.
Global Breakpoint - A global breakpoint will trigger when any session reaches that breakpoint. Set a global breakpoint if you want to perform in-context debugging of a program. When a global breakpoint is set on a program, the debugging session that set the global breakpoint waits until that program is invoked in another session. A global breakpoint can only be set by a superuser.
To create a local breakpoint, left-click within the grey shaded margin to the left of the line of code where you want the local breakpoint set. Where you click in the grey shaded margin should be close to the right side of the margin as in the spot where the breakpoint dot is shown on source code line 12.
When created, the Debugger displays a dark dot in the margin, indicating a breakpoint has been set at the selected line of code.

Set a breakpoint by clicking in left-hand margin
Fig. 14: Set a breakpoint by clicking in left-hand margin
You can set as many local breakpoints as desired. Local breakpoints remain in effect for the duration of a debugging session until they are removed.
Removing a Local Breakpoint
To remove a local breakpoint, left-click the mouse on the breakpoint dot
in the grey shaded margin of the Program Body panel. The dot
disappears, indicating that the breakpoint has been removed.
You can remove all of the breakpoints from the program that currently
appears in the Program Body frame by clicking the
Clear all breakpoints icon.

Clear all breakpoints icon
Fig. 15: Clear all breakpoints icon
!!! Note * When you perform any of the preceding actions, only the
breakpoints in the program that currently appears in the
Program Body panel are removed. Breakpoints in called subprograms or
breakpoints in programs that call the program currently appearing in the
Program Body panel are not removed.
Setting a Global Breakpoint for In-Context Debugging
To set a global breakpoint for in-context debugging, highlight the
stored procedure, function, or trigger on which you wish to set the
breakpoint in the Browser panel. Navigate through the Object
menu to select Debugging, and then Set Breakpoint.
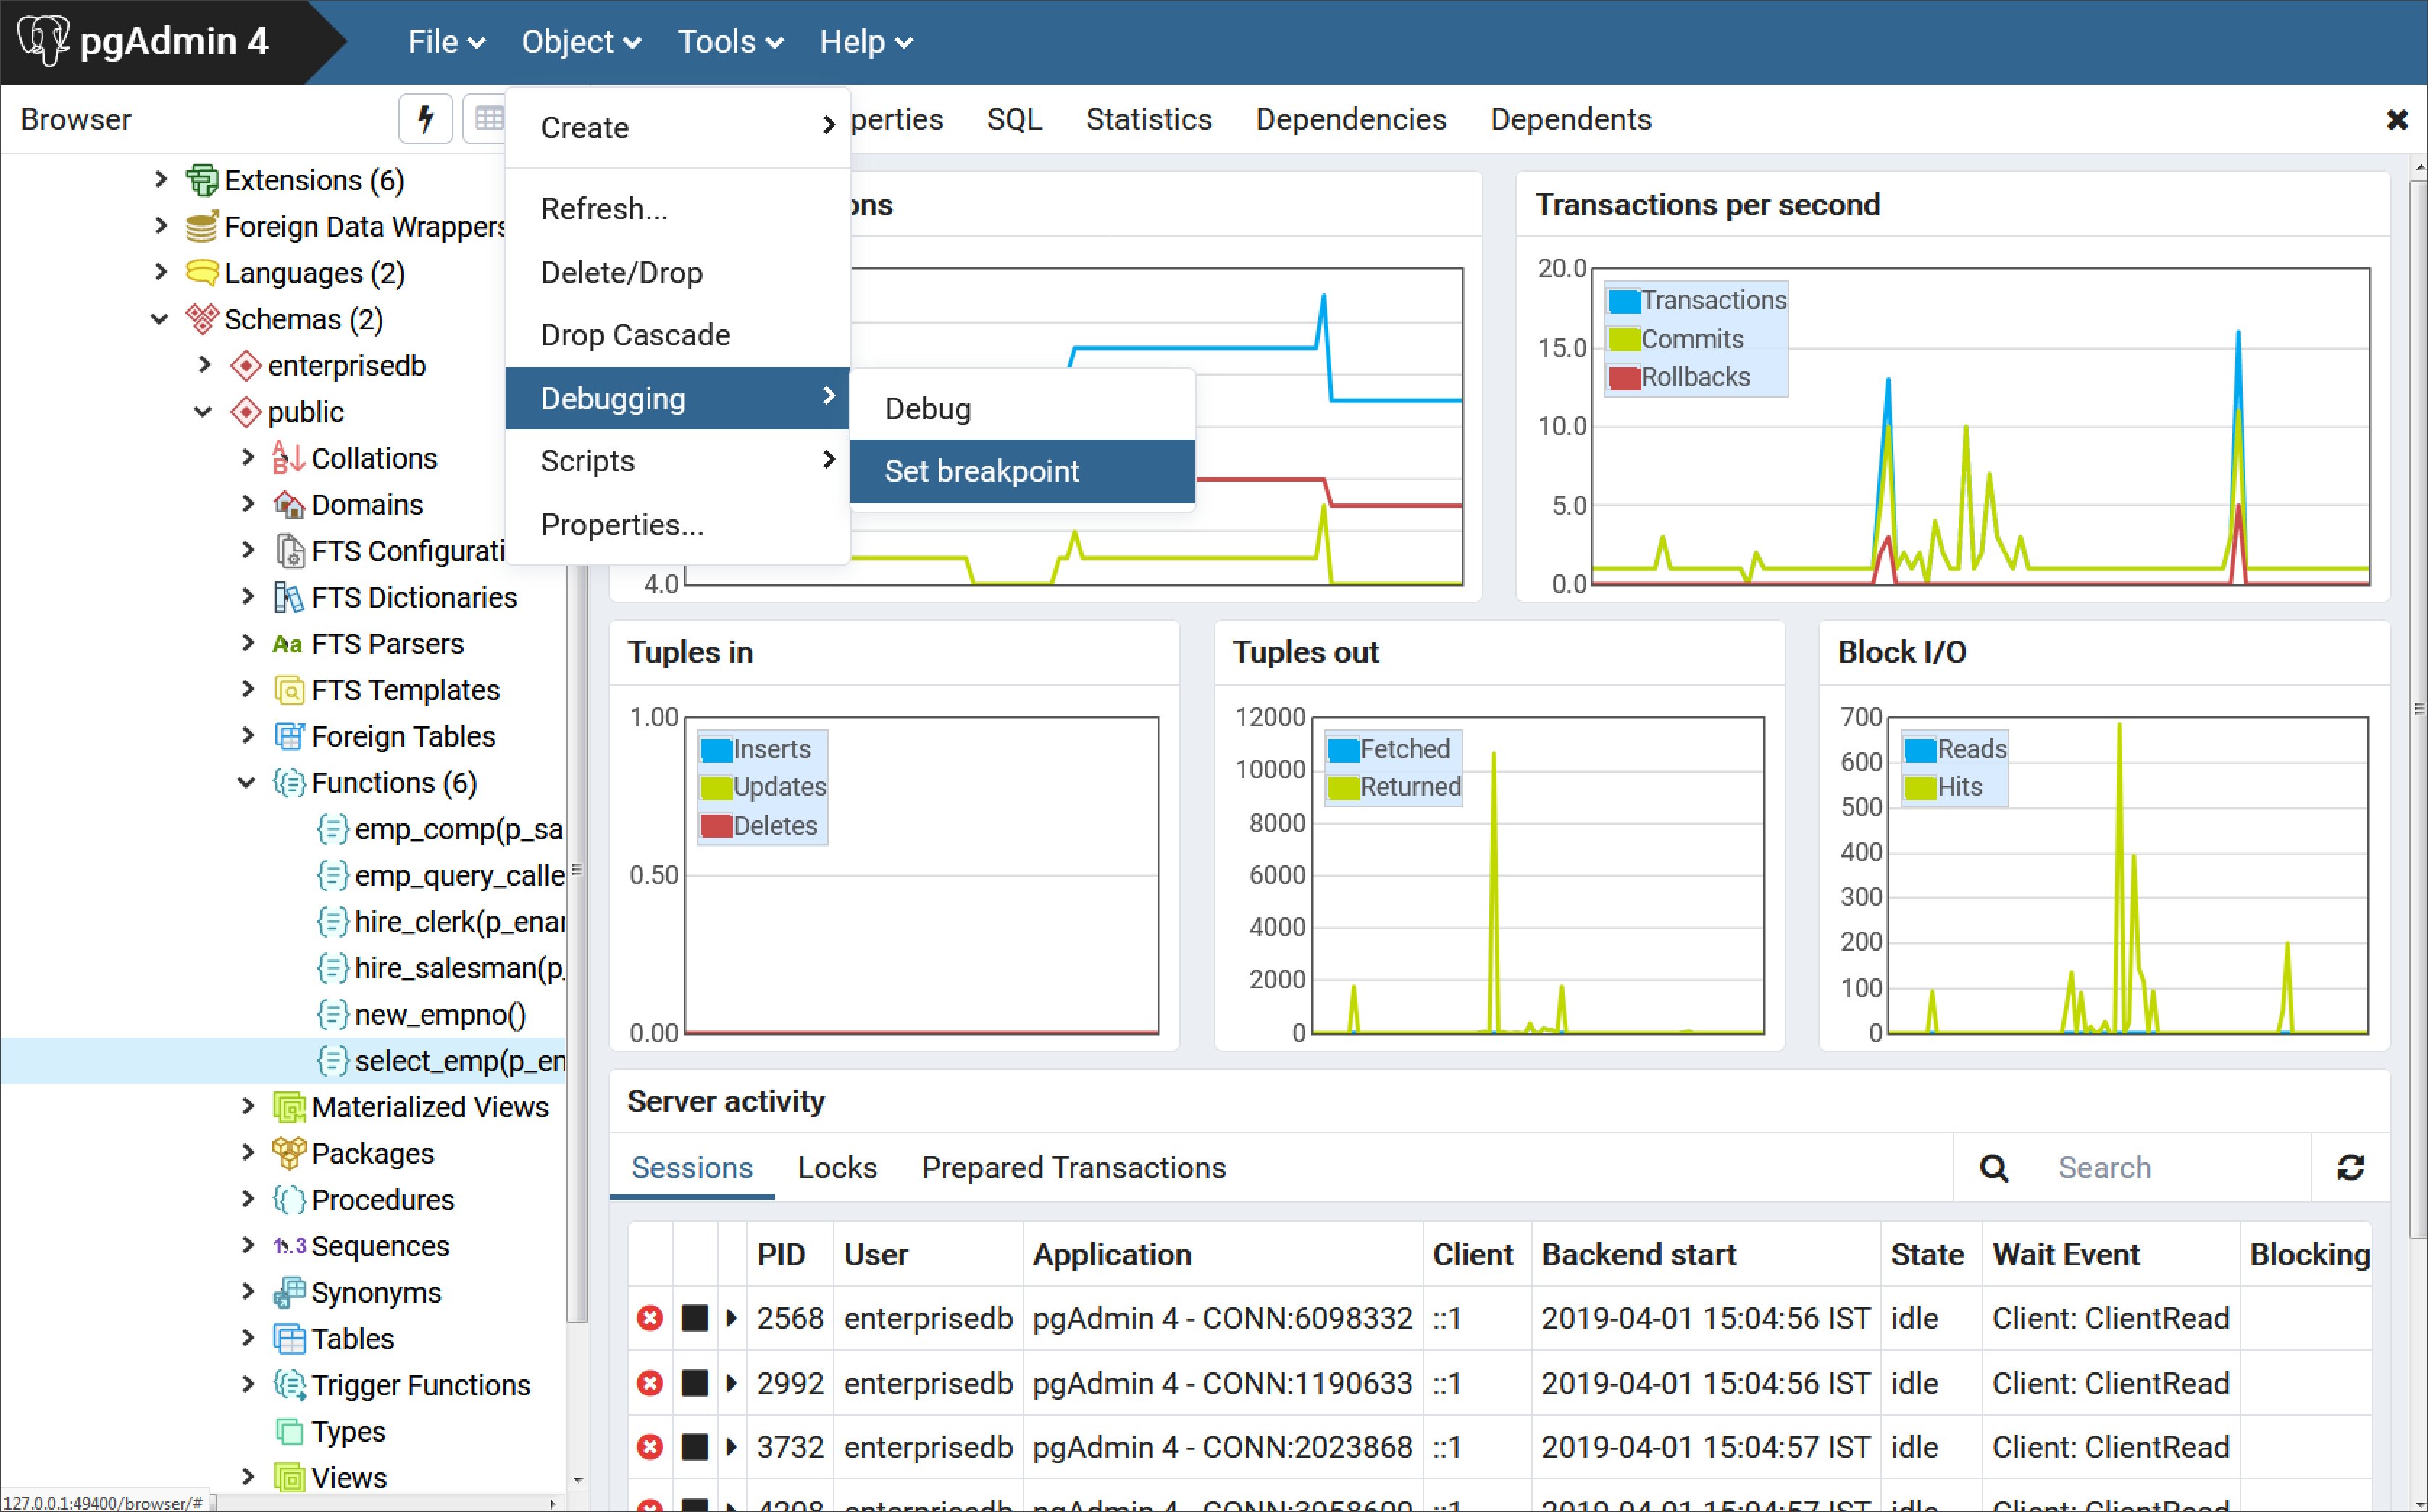
Setting a global breakpoint from the Object menu
Fig. 16: Setting a global breakpoint from the Object menu
Alternatively, you can right-click on the name of the stored procedure,
function, or trigger on which you wish to set a global breakpoint and
select Debugging, then Set Breakpoint from the context menu as
shown by the following.
Setting a global breakpoint from the object’s context menu
Fig. 17: Setting a global breakpoint from the Object’s context menu
To set a global breakpoint on a trigger, expand the table node that contains the trigger, highlight the specific trigger you wish to debug, and follow the same directions as for stored procedures and functions.
To set a global breakpoint in a package, highlight the specific procedure or function under the package node of the package you wish to debug and follow the same directions as for stored procedures and functions.
After you choose Set Breakpoint, the Debugger window opens and waits
for an application to call the program to be debugged.

Waiting for invocation of program to be debugged
Fig. 18: Waiting for invocation of program to be debugged
The PSQL client invokes the select_emp function (on which a global
breakpoint has been set).
$ psql edb enterprisedb
psql.bin (14.0.0, server 14.0.0)
Type "help" for help.

edb=# SELECT select_emp(7900);
The select_emp function does not complete until you step through the
program in the Debugger.
Program on which a global breakpoint has been set
Fig. 19: Program on which a global breakpoint has been set
You can now debug the program using any of the previously discussed
operations such as step into, step over, and continue, or set local
breakpoints. When you have stepped through execution of the program, the
calling application (PSQL) regains control and the select_emp
function completes execution and its output is displayed.
$ psql edb enterprisedb
psql.bin (14.0.0, server 14.0.0)
Type "help" for help.

edb=# SELECT select_emp(7900);
INFO: Number    : 7900
INFO: Name      : JAMES
INFO: Hire Date : 12/03/1981
INFO: Salary    : 950.00
INFO: Commission: 0.00
INFO: Department: SALES
 select_emp
------------
(1 row)
At this point, you can end the Debugger session. If you do not end the Debugger session, the next application that invokes the program will encounter the global breakpoint and the debugging cycle will begin again.
Exiting the Debugger
To end a Debugger session and exit the Debugger, click on the close icon
(x) located in the upper-right corner to close the tab.

Exiting from the Debugger
Fig. 20: Exiting from the Debugger
