Log Manager
You can use the PEM Log Manager to simplify server log configuration for Postgres instances. With the Log Manager, you can modify all of your server log parameters with a click:
Where log files are written
How often log files are written
The type of information written to log files
The format of log file entries
Log rotation properties
To configure logging for a Postgres instance, the server must be registered as a PEM-managed server, and the registration information must include the name of a service script.
To open the Log Manager, select the Log Manager... option from the
Management menu of the PEM client. The wizard opens, welcoming you to
the Log Manager.

The Log Manager welcome dialog
Click Next to continue to the Server selection dialog.

The Log Manager Server selection dialog
The Server selection dialog displays a list of the server connections
monitored by PEM. Check the box next to the name of a server (or
servers) to which the Log Manager wizard will apply the specified
configuration. Log Manager is disabled for any server displaying a red
exclamation mark to the left of its name in the Server selection tree
control; there are several reasons that a server may not be enabled:
Only a server that specifies a
Service IDon theAdvancedtab of thePropertiesdialog can be configured by Log Manager.To provide a service ID, right click on the server name in the tree control, and select
Disconnect Serverfrom the context menu; if prompted, provide a password. Then, open the context menu for the server, and selectProperties. Navigate to theAdvancedtab, and provide the name of the service in theService IDfield; clickSaveto save your change and exit the dialog.If the PEM agent bound to the server does not have sufficient privileges to restart the server, the server will be disabled.
If the PEM agent bound to the server is an older version than the associated PEM server, the server will be disabled.
Click ``Next to continue.

The Log Manager Log configuration dialog
Use the options on the Log configuration dialog to
specify how often log files will be inported to PEM and to specify log
rotation details:
Options within the Import Logs box specify how often log files will be
imported to PEM:
Use the switch next to the
Import logs to PEMlabel to specify if log files will be imported to PEM and displayed on the Server Log Analysis dashboard.Use the
Import Frequencydrop-down list box to specify how often log files are imported to PEM.
Use the fields in the Log rotation configuration box to specify the
maximum length (lifespan or size) of a log file:
Use the
Rotation Sizefield to specify the maximum size in megabytes of an individual log file. The default value is 10 MB; when set to 0, no limit is placed on the maximum size of a log file.Use the
Rotation Timefield to specify the number of whole days that should be stored in each log file. The default value is 1 day.
Use the Truncation on Rotation switch to specify server behavior for
time-based log file rotation:
Select ON to specify that the server should overwrite any existing log file that has the same name that a new file would take.
Select OFF to specify that the server should append any new log file entries to an existing log file with the same name that a new log file would take. This is the default behavior.
Click Next to continue.

The Where to Log dialog
Use the fields on the Where to log dialog to
specify where log files should be written.
Select an option from the
Log ``Destinationbox to specify a destination for the server log output:Set the
stderrswitch to Yes to specify that log files should be written to stderr.Set the
csvlogswitch to Yes to specify that log files should be written to file in a comma-separated value format. This option is automatically enabled (and no longer editable) if you have selected Import logs to PEM on the Schedule dialog; if you are not importing server log files to PEM, this option is editable.Set the
syslogswitch to Yes to specify that log files should be written to the system log files.On Windows, set the
eventlogswitch to Yes to specify that log files should be written to the event log.
Use the options within the
Log collectionbox to specify your collection preferences:Set the
Log Collectorswitch to Enable to instruct the server to re-direct captured log messages (directed to STDERR) into log files.Set the
Log Silent Modeswitch to Enable to instruct the server to run silently in the background, disassociated from the controlling terminal.
Use options in the
Log Directorybox to specify log file location preferences:Set the
Change log directory for selected servers?switch to Yes to specify that each set of log files should be maintained in a separate directory.Use the
Directory namefield to specify the directory to which log files will be written. The directory will reside beneath the pg_log directory under the installation directory of the monitored server.
Use the
Log File Namefield to specify a format for the log file name. If set toDEFAULT, the format isenterprisedb-%Y-%m-%d_%H%M%S, where:enterprisedbis the file name prefixYis the year that the log was storedmis the month that the log was storedis the day that the log was storedHis the hour that the log was storedMis the minute that the log was storeSis the second that the log was stored
When logging to syslog is enabled:
Use the
Syslog Facilitydrop-down list box to specify which syslog facility should be used.Use the
Syslog Identfield to specify the program name that will identify Advanced Server entries in system logs.
Click Next to continue.

The Log Manager When to Log dialog
Use the fields on the When to log dialog to
specify which events will initiate a log file entry. The severity levels
(in order of severity, from most severe to least severe) are:
panic- Errors that cause all database sessions to abort.fatal- Errors that cause a session to abort.log- Information messages of interest to administrators.error- Errors that cause a command to abort.warning- Error conditions in which a command will complete but may not perform as expected.notice- Items of interest to users. This is the default.info- Information implicitly requested by the user.debug5throughdebug1- Detailed debugging information useful to developers.Use the
Client min messagesdrop-down list box to specify the lowest severity level of message sent to the client application.Use the
Log min messagesdrop-down list box to specify the lowest severity level that will be written to the server log.By default, when an error message is written to the server log, the text of the SQL statement that initiated the log entry is not included. Use the
Log min error statementdrop-down list box to specify a severity level that will trigger SQL statement logging. If a message is of the specified severity or higher, the SQL statement that produced the message will be written to the server log.Use the
Log min duration statementdrop-down list box to specify a statement duration (in milliseconds); any statements that exceed the specified number of milliseconds will be written to the server log. A value of -1 disables all duration-based logging; a value of 0 logs all statements and their duration.Use the
Log temp filesfield to specify a file size in kilobytes; when a temporary file reaches the specified size, it will be logged. A value of -1 (the default) disables this functionality.Use the
Log autoVacuum min durationfield to specify a time length in milliseconds; if auto-vacuuming exceeds the length of time specified, the activity will be logged. A value of -1 (the default) disables this functionality.
Click Next to continue.

The Log Manager What to Log dialog
Use the fields on the What to log dialog to
specify log entry options that are useful for debugging and auditing.
The switches in the Debug options box instruct the server to include
information in the log files related to query execution that may be of
interest to a developer:
Set the
Parse treeswitch to Yes to instruct the server to include the parse tree in the log file.Set the
Rewriter outputswitch to Yes to instruct the server to include query rewriter output in the log file.Set the
Execution planswitch to Yes to instruct the server to include the execution plan for each executed query in the log file.
When the Indent Debug Options Output in Log switch is set to Yes, the
server indents each line that contains a parse tree entry, a query
rewriter entry or query execution plan entry. While indentation makes
the resulting log file more readable, it does result in a longer log
file.
Use the switches in the General Options box to instruct the server to
include auditing information in the log file:
Set the
Checkpointsswitch to Yes to include checkpoints and restartpoints in the server log.Set the
Connectionsswitch to Yes to include each attempted connection to the server (as well as successfully authenticated connections) in the server log.Set the
Disconnectionsswitch to Yes to include a server log entry for each terminated session that provides the session information and session duration.Set the
Durationswitch to Yes to include the amount of time required to execute each logged statement in the server log.Set the
Hostnameswitch to Yes to include both the IP address and host name in each server log entry (by default, only the IP address is logged). Please note that this may cause a performance penalty.Set the
Lock Waitsswitch to Yes to instruct the server to write a log entry for any session that waits longer than the time specified in the deadlock_timeout parameter to acquire a lock. This is useful when trying to determine if lock waits are the cause of poor performance.
Use the Error verbosity drop-down list box to specify the detail written
to each entry in the server log:
Select default to include the error message, DETAIL, HINT, QUERY and CONTEXT in each server log entry.
Select terse to log only the error message.
Select verbose to include the error message, the DETAIL, HINT, QUERY and CONTEXT error information, SQLSTATE error code and source code file name, the function name, and the line number that generated the error.
Use the Prefix string field to specify a printf-style string that is
written at the beginning of each log file entry. For information about
the options supported, please see the log_line_prefix documentation (in
the Postgres core documentation), available at:
http://www.postgresql.org/docs/current/static/runtime-config-logging.html
Use the Statements drop-down list box to specify which SQL statements
will be included in the server log. The default is none; valid options
are:
Specify none to disable logging of SQL statements.
Specify ddl to instruct the server to log ddl (data definition language) statements, such as CREATE, ALTER, and DROP.
Specify mod to instruct the server to log all ddl statements, as well as all dml (data modification language) statements, such as INSERT, UPDATE, DELETE, TRUNCATE and COPY FROM.
Specify all to instruct the server to log all SQL statements.
Click Next to continue.

The Schedule Logging Changes dialog
Use options on the Schedule logging changes dialog to
specify when logging configuration changes will be applied:
Set the
Configure logging nowswitch toYesto specify that your configuration preferences will be enabled, and the server will restart when you have completed the Log Manager wizard.Set
Configure logging nowtoNoto use the Schedule it for some other time calendar selector to specify a convenient time for logging configuration preferences to be applied, and the server to restart.
Note that when you apply the configuration changes specified by the Log Manager wizard, the server restart will temporarily interrupting use of the database server for users.
Click Finish to exit the wizard, and either restart the server, or
schedule the server restart for the time specified on the scheduling
dialog.
Reviewing the Server Log Analysis Dashboard
After invoking the Log Manager wizard, and importing your log files to
PEM, you can use the Server Log Analysis dashboard to review the log
files for a selected server. To open the Server Log Analysis dashboard,
right-click on the name of a monitored server in the PEM client tree
control, and navigate through the Dashboards menu, selecting Server Log
Analysis.

The Server Log Analysis dashboard
The header information on the Server Log Analysis dashboard displays the date and time that the server was started, the
date and time that the page was last updated, and the current number of
triggered alerts.
Entries in the Server Log table are displayed in chronological order, with the
most-recent log entries first. Use the scroll bars to navigate through
the log entries, or to view columns that are off of the display.
Headings at the top of the server log table identify the information stored in each column; hover over a column heading to view a tooltip that contains a description of the content of each column.
You can use filtering to limit the number of server log records that are
displayed. Click Show Filters to expose the filters panel and define a
filter.

Defining a Server Log filter
Use the fields within the filter definition box to describe the
selection criteria that PEM will use to select a subset of a report for
display:
Use the
Fromfield to specify a starting date for the displayed server log.Use the
Tofield to specify an ending date for the displayed server log.Enter a role name in the
Usernamefield display only transactions performed by that user.Enter a database name in the
Database fieldto specify that the server should limit the displayed records to only those transactions that were performed against the specified database.Use the
Command Typefield to specify a selection criteria for the commands that will be displayed in the filtered report.
When you’ve described the criteria by which you wish to filter the
server logs, click Filter to display the filtered server log in the
Server Log table.
Postgres Log Analysis Expert
The PEM Log Analysis Expert analyzes the log files of servers that are registered with Postgres Enterprise Manager, and produces a report that provides an analysis of your Postgres cluster’s usage based on log file entries. You can use information on the Log Analysis Expert reports to make decisions about optimizing your cluster usage and configuration to improve performance.
Before using the PEM Log Analysis Expert, you must specify the Service ID on the Advanced tab of the Server Properties dialog, and use the Log Manager wizard to enable log collection by the PEM server.
To open the Postgres Log Analysis Expert wizard, select the Postgres Log Analysis Expert... option from the Management menu of the PEM client. The wizard’s Welcome dialog opens; click Next to continue:
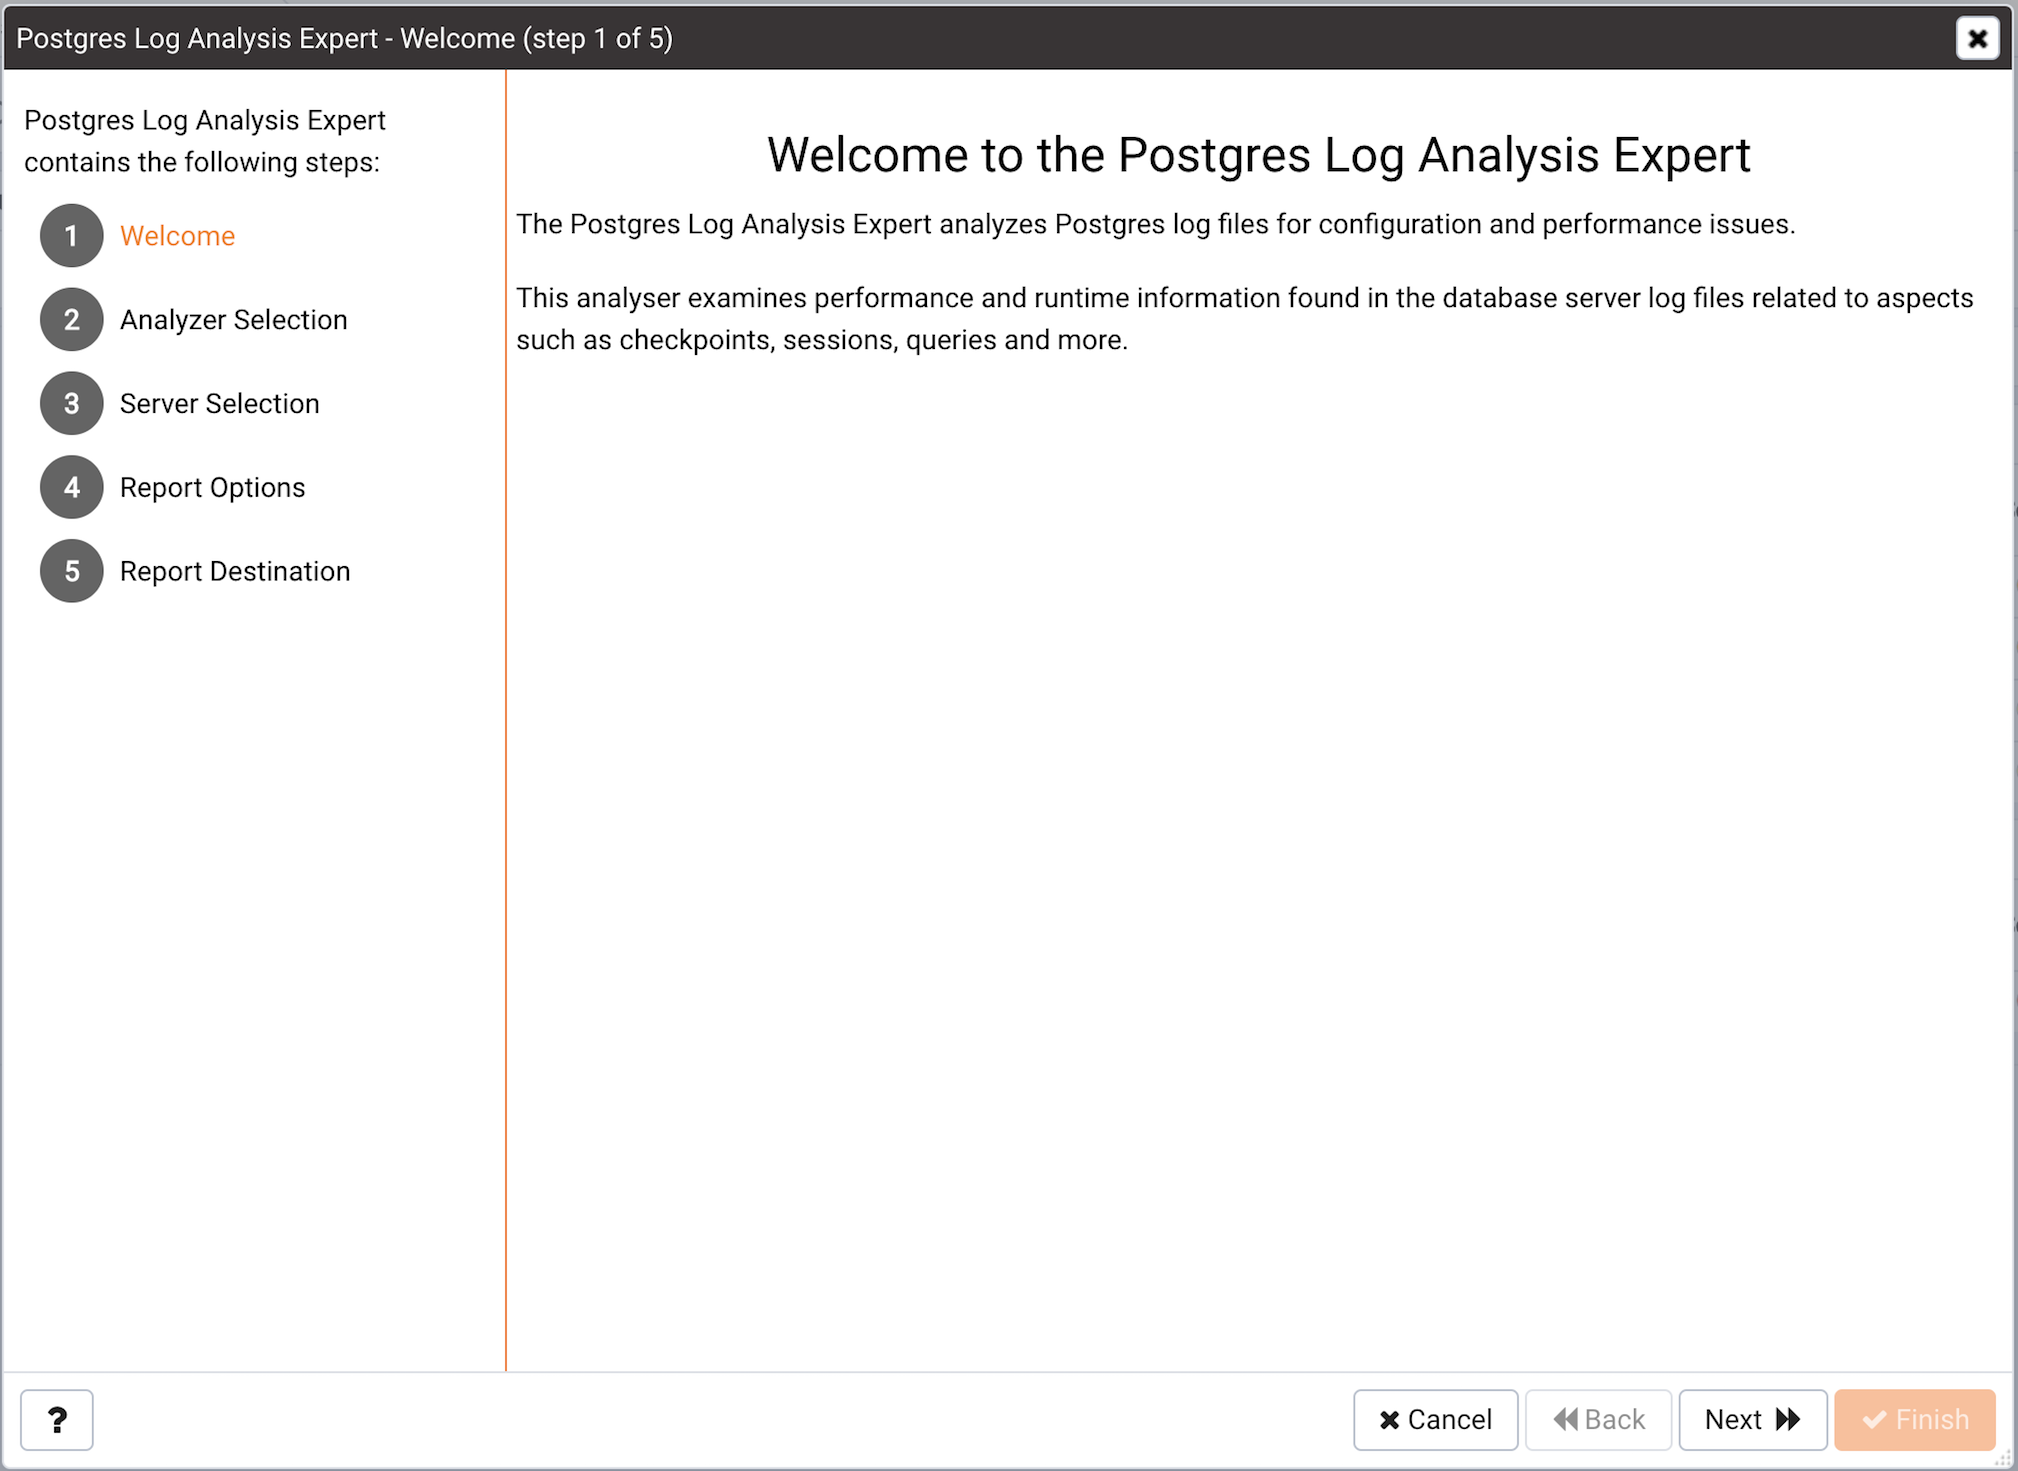
The Log Analysis Expert Welcome dialog
The wizard’s Analyzer selection dialog displays a list
of Analyzers from which you can select. Each Analyzer generates a
corresponding table, chart, or graph that contains information gleaned
from the log files.
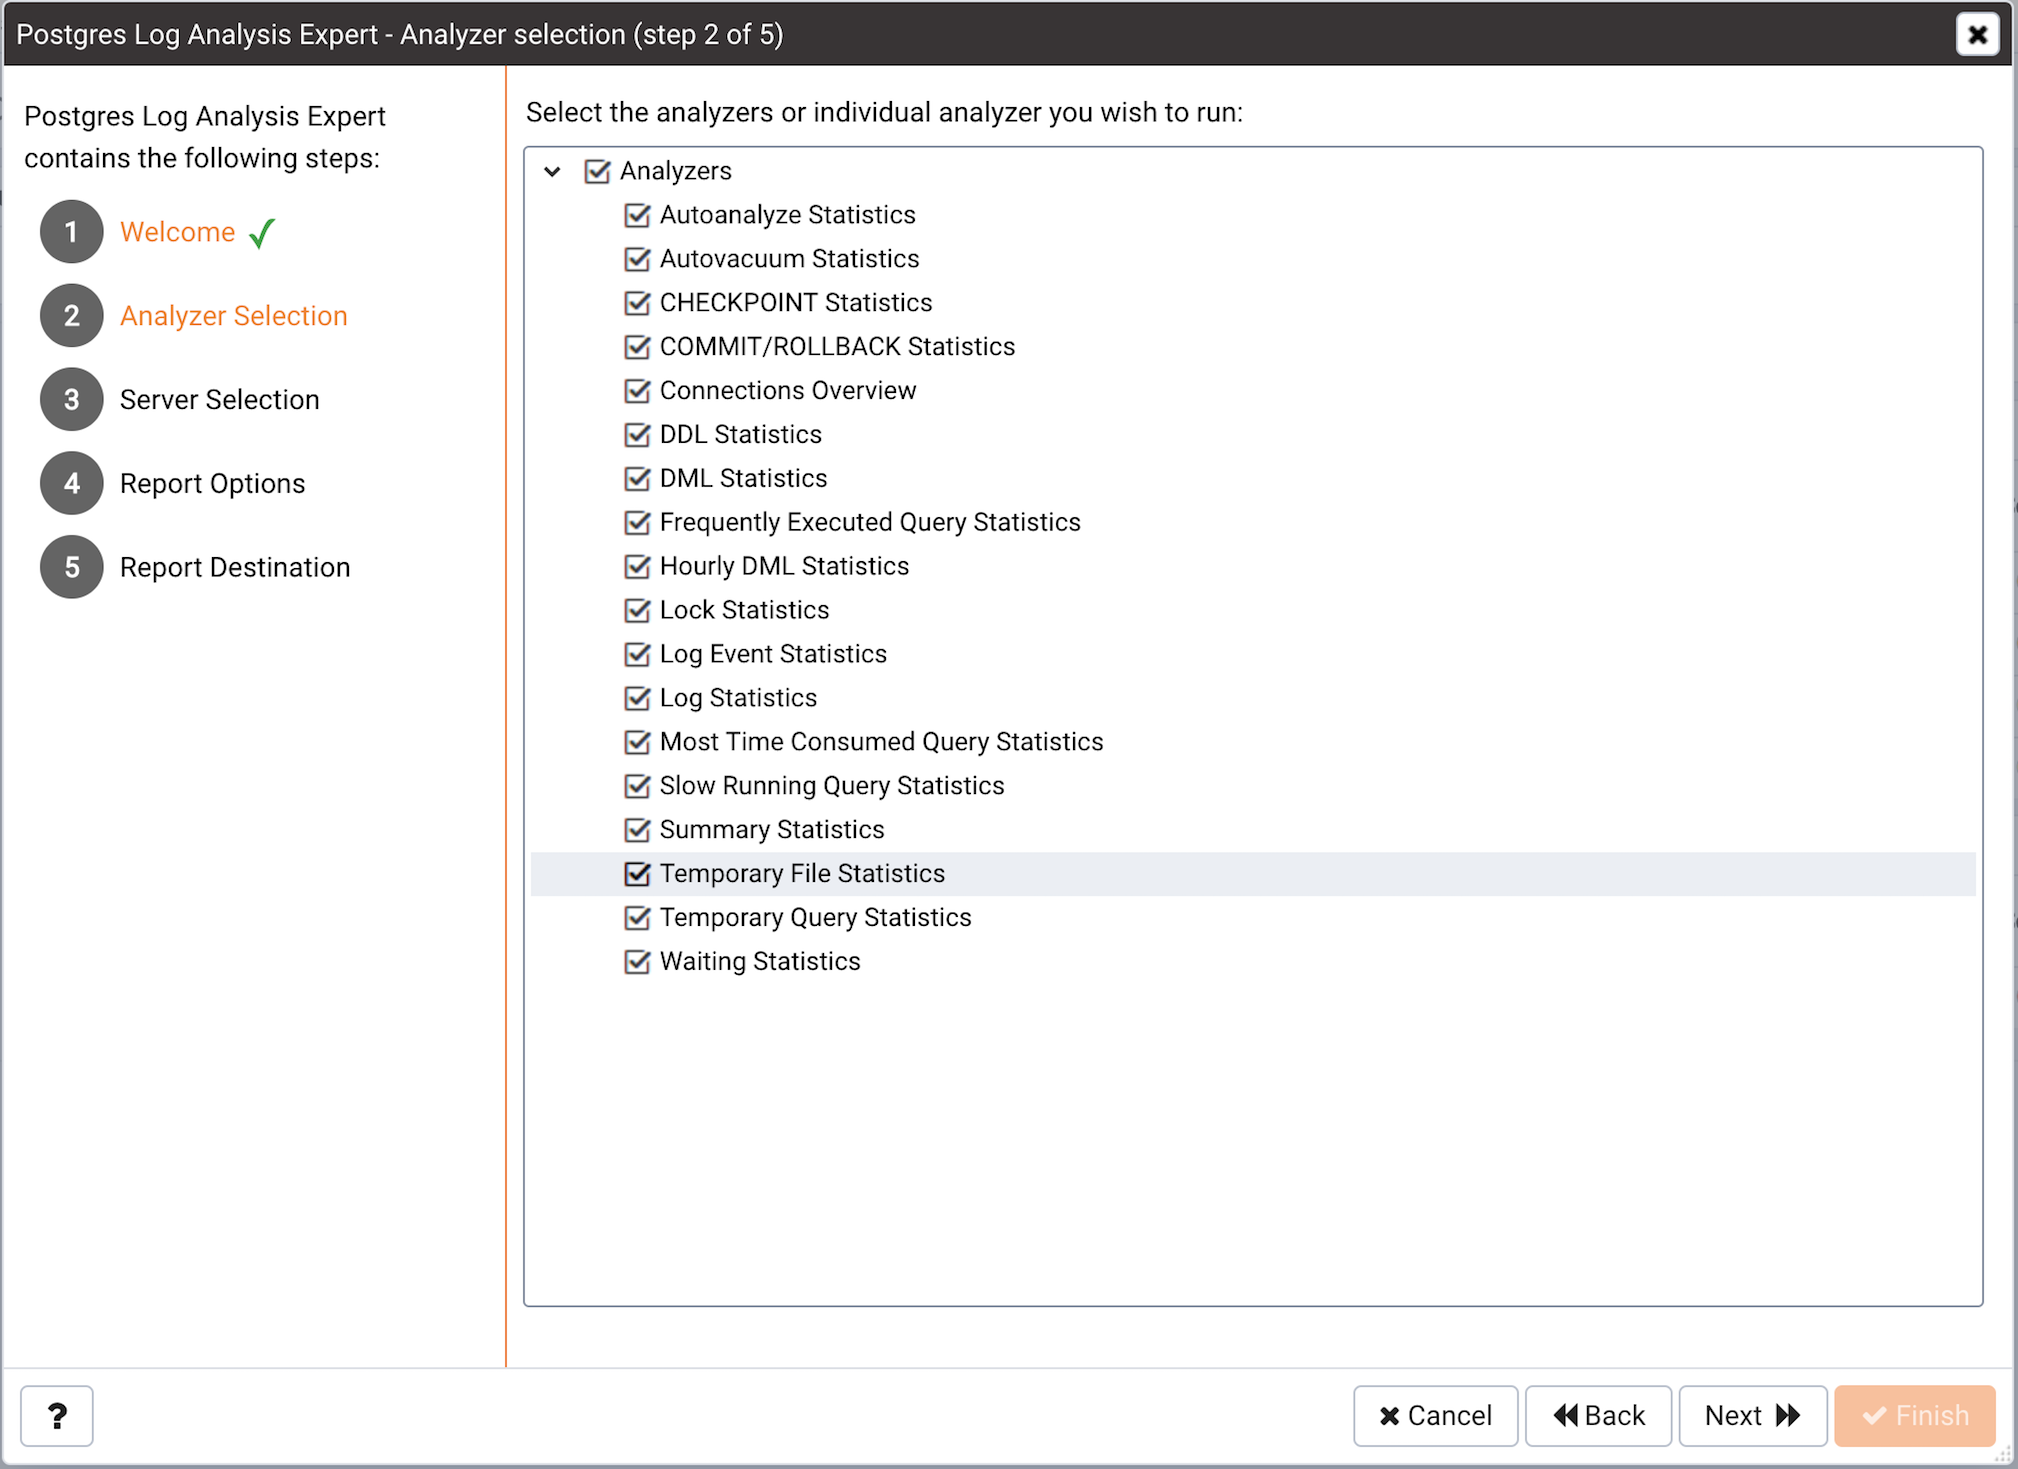
The Analyzer selection dialog
Check the box to the left of an Analyzer to indicate that the Log
Analysis Expert should prepare the corresponding table, chart or graph.
After making your selections, click Next to continue to the Server
selection tree control.

The Server selection dialog
Use the tree control to specify which servers you would like the
Postgres Log Analysis Expert to analyze. If you select multiple servers,
the resulting report will contain the corresponding result set for each
server in a separate (but continuous) list. Click Next to continue to
the Report options dialog.

The Report options dialog
Use the fields in the Options section to specify the analysis method and
the maximum length of any resulting tables:
Use the
Aggregate methoddrop-down to select the method used by the Log Analysis Expert to consolidate data for the selected time span. You can select from:SUMinstructs the analyzer to calculate a value that is the sum of the collected values for the specified time span.AVGinstructs the analyzer to calculate a value that is the average of the collected values for the specified time span.MAXinstructs the analyzer to use the maximum value that occurs within a specified time span.MINinstructs the analyzer to use the minimum value that occurs within a specified time span.
Use the
Time spanfield to specify the number of minutes that the analyzer will incorporate into each calculation for a point on a graph. For example, if the Time span is 5 minutes, and the Aggregate method is AVG, each point on the given graph will contain the average value of the activity that occurred within a five minute time span.Use the
Rows limitfield to specify the maximum number of rows to include in a table.
Use the fields in the Time Intervals section to specify the time range
that the Log Analysis Expert will analyze:
Set
Relative daysto Yes to enable the (+/-)From date field and specify the number of days before or after the date and time selected in the From field.Use the
Fromfield to specify the starting date and time for the analysis.Use the
Tofield to specify the ending date and time for the analysis.Use the
(+/-)From date selector to specify the number of days before or after the From date that should be included in the analysis.
When you’ve specified the report options, click Next to continue to the
Report destination dialog.

The Report destination dialog
You can choose the default option and select Finish to view the Log
Analysis Expert report in the PEM client’s tabbed browser, or click the
radio button next to Download the report to save a copy of the report to
an HTML file for later use.
If you have specified that the report should be saved to a file, the report will be downloaded.
Reviewing the Postgres Log Analysis Expert Report
If you’ve elected to review the report immediately, the Postgres Log Analysis Expert report will be displayed in the PEM Client window. The report header displays the date and time that the report was generated, the time period that the report spans, and the aggregation method specified when defining the report. The name of the server for which information is displayed is noted at the start of each section of the report.
The report displays the tables, graphs and charts that were selected in
the Log Analysis Expert wizard. Use the Jump To button (located in the
lower-right hand corner of the screen) to navigate to a specific
graphic.

The Postgres Log Analysis Expert Report
If the report contains an analysis of more than one monitored server, charts and tables will be displayed in sets; first the graphs, tables and charts that display statistics for one server, then the graphics for the next server in the report.