PEM 8.1 -Enterprise Features Guide
EnterpriseDB
PEM Enterprise Features Guide
This guide will acquaint you with the tools and wizards that are built into the Postgres Enterprise Manager (PEM) web interface that make it easier for you to monitor and manage your system.
This guide is not a comprehensive resource; rather, it is meant to serve as an aid to help you evaluate the tool and bring you up to speed with the basics of how to use the product. For more detailed information about using PEM’s functionality, please see the online help made available by the PEM client.
This document uses Postgres to mean either the PostgreSQL or EDB Postgres Advanced Server database or EDB Postgres Extended (formerly known as 2ndQPostgres).
what’s_new pem_query_tool pem_schema_diff_tool pem_erd_tool performance_monitoring_and_management capacity_manager audit_manager log_manager sql_profiler tuning_wizard postgres_expert reports monitoring_BDR_node monitoring_failover_manager monitoring_xdb_replication_cluster performance_diagnostic reference conclusion
What’s New
The following changes have been made to Postgres Enterprise Manager to create version 8.1.0:
- Added ability to monitor a BDR (Bi-Replication Replication) server using the PEM console.
- Added support for Kerberos (GSSAPI) authentication for the PEM Server on Linux Platforms Web Console.
- Added support of EDB Postgres Extended (formerly known as 2nQPostgres) for Administration and Monitoring.
- Added Entity-Relationship Diagram (ERD) design tool to create ER diagrams of the databases.
- Added support for adding Publishers and Subscribers of Logical Replication via PEM Console.
- Added Quick Search option to locate features and relevant help articles quickly.
- Added ability to configure the parameters through the following PEM tools without restarting the database server:
- Log Manager
- Audit Manager
- Tuning Wizard
The PEM Query Tool
PEM contains a feature-rich Interactive Development Environment (IDE) that allows you to issue ad-hoc SQL queries against Postgres servers.
You can access the Query Tool via the Query Tool menu option on the Tools menu, or through the context menu of select nodes of the Browser tree control. The Query Tool allows you to:
- Issue ad-hoc SQL queries.
- Execute arbitrary SQL commands.
- Edit the result set of a SELECT query if it is updatable.
- Displays current connection and transaction status as configured by the user.
- Save the data displayed in the output panel to a CSV file.
- Review the execution plan of a SQL statement in either a text, a graphical format or a table format (similar to https://explain.depesz.com).
- View analytical information about a SQL statement.
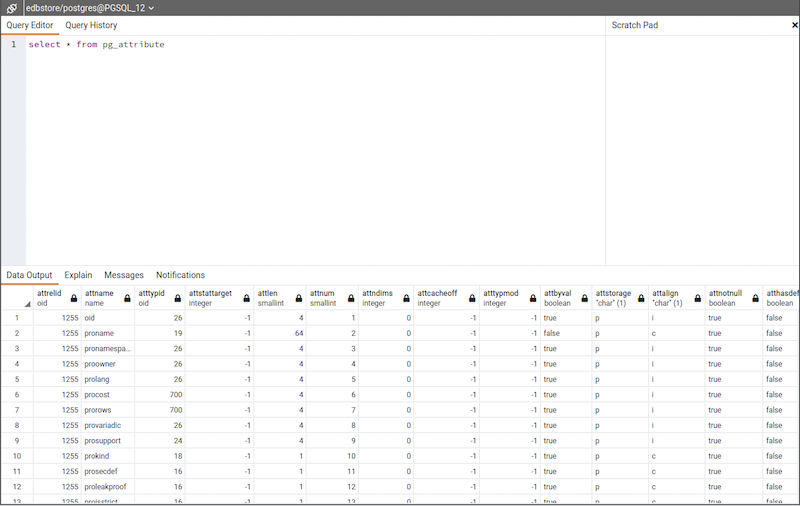
You can open multiple copies of the Query tool in individual tabs simultaneously. To close a copy of the Query tool, click the X in the upper-right hand corner of the tab bar.
The Query Tool features two panels:
- The upper panel displays the
SQL Editor. You can use the panel to enter, edit, or execute a query. It also shows theHistorytab which can be used to view the queries that have been executed in the session, and aScratch Padwhich can be used to hold text snippets during editing. If the Scratch Pad is closed, it can be re-opened (or additional ones opened) by right-clicking in the SQL Editor and other panels and adding a new panel. - The lower panel displays the
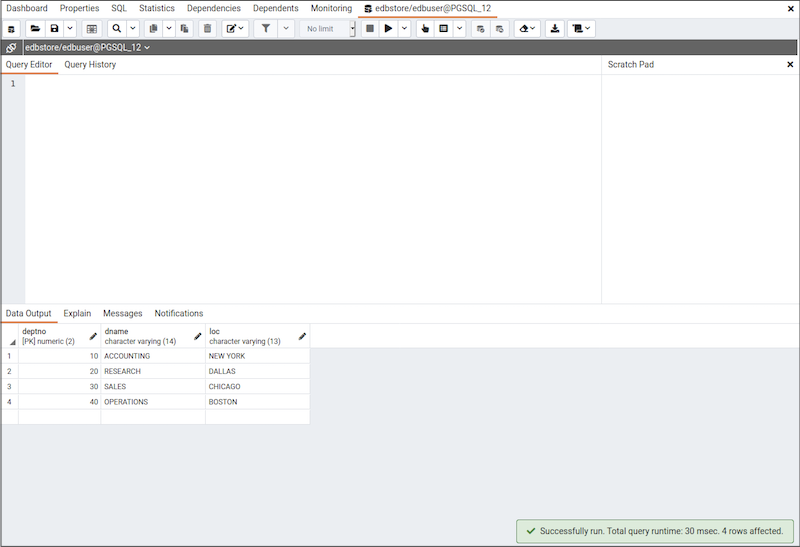
Data Outputpanel. The tabbed panel displays the result set returned by a query, information about a query’s execution plan, server messages related to the query’s execution and any asynchronous notifications received from the server.
The Query Tool Toolbar
The Query Tool toolbar uses context-sensitive icons that provide shortcuts to frequently performed tasks. If an icon is highlighted, the option is enabled; if the icon is grayed-out, the task is disabled.

Hover over an icon to display a tool-tip that describes the icon’s functionality:
| Icon | Behavior | Shortcut |
|---|---|---|
Open File |
Click the Open File icon to display a previously saved query in the SQL Editor. |
Accesskey + O |
Save |
Click the Save icon to perform a quick-save of a previously saved query, or to access the Save menu:- Select Save to save the selected content of the SQL Editor panel in a file.- Select Save As to open a new browser dialog and specify a new location to which to save the selected content of the SQL Editor panel. |
Accesskey + S |
Save Data Changes |
Click the Save Data Changes icon to save the data changes (insert, update, or delete) in the Data Output Panel to the server. |
F6 |
Find |
Use the Find menu to search, replace, or navigate the code displayed in the SQL Editor:- Select Find to provide a search target, and search the SQL Editor contents.- Select Find next to locate the next occurrence of the search target.- Select Find previous to move to the last occurrence of the search target.- Select Pesistent find to identify all occurrences of the search target within the editor.- Select Replace to locate and replace (with prompting) individual occurrences of the target.- Select Replace all to locate and replace all occurrences of the target within the editor.- Select Jump to navigate to the next occurrence of the search target. |
Cmd+F Cmd+G Cmd+Shift+G Cmd+Shift+F Alt+G |
Copy |
Click the Copy icon to copy the content that is currently highlighted in the Data Output panel. when in View/Edit data mode. |
Accesskey + C |
Paste |
Click the Paste icon to paste a previously row into a new row when in View/Edit data mode. |
Accesskey + P |
Delete |
Click the Delete icon to mark the selected rows for deletion. These marked rows get deleted when you click the Save Data Changes icon. |
Accesskey + D |
Edit |
Use options on the Edit menu to access text editing tools; the options operate on the text displayed in the SQL Editor panel when in Query Tool mode:- Select Indent Selection to indent the currently selected text.- Select Unindent Selection to remove indentation from the currently selected text.- Select Inline Comment Selection to enclose any lines that contain the selection in SQL style comment notation.- Select Inline Uncomment Selection to remove SQL style comment notation from the selected line.- Select Block Comment to enclose all lines that contain the selection in C style comment notation. This option acts as a toggle. |
Tab Shift+Tab Cmd+/ Cmd+. Shift+Cmd+/ |
Filter |
Click the Filter icon to set filtering and sorting criteria for the data when in View/Edit data mode. Click the down arrow to access other filtering and sorting options:-Click Sort/Filter to open the sorting and filtering dialogue.- Click Filter by Selection to show only the rows containing the values in the selected cells.- Click Exclude by Selection to show only the rows that do not contain the values in the selected cells.- Click Remove Sort/Filter to remove any previously selected sort or filtering options. |
Accesskey + F |
Limit Selector |
Select a value in the Limit Selector to limit the size of the dataset to a number of rows. |
Accesskey + R |
Stop |
Click the Stop icon to cancel the execution of the currently running query. |
Accesskey + Q |
Execute/Refresh |
Click the Execute/Refresh icon to either execute or refresh the query highlighted in the SQL editor panel. Click the down arrow to access other execution options:- Add a check next to Auto-Rollback to instruct the server to automatically roll back a transaction if an error occurs during the transaction.- Add a check next to Auto-Commit to instruct the server to automatically commit each transaction. Any changes made by the transaction will be visible to others, and durable in the event of a crash. |
F5 |
Explain |
Click the Explain icon to view an explanation plan for the current query. The result of EXPLAIN is displayed graphically on the Explain tab of the output panel, and in text form on the Data Output tab. |
F7 |
Explain analyze |
Click the Explain analyze icon to invoke an EXPLAIN ANALYZE command on the current query.Navigate through the Explain Options menu to select options for the EXPLAIN command:- Select Verbose to display additional information regarding the query plan.- Select Costs to include information on the estimated startup and total cost of each plan node, as well as the estimated number of rows and the estimated width of each row.- Select Buffers to include information on buffer usage.- Select Timing to include information about the startup time and the amount of time spent in each node of the query.- Select Summary to include the summary information about the query plan. |
|
Commit |
Click the Commit icon to commit the transaction. |
Shift+CTRL+M |
Rollback |
Click the Rollback icon to rollback the transaction. |
Shift+CTRL+R |
Clear |
Use options on the Clear drop-down menu to erase display contents:- Select Clear Query Window to erase the content of the SQL Editor panel.- Select Clear History to erase the content of the History tab. |
Accesskey + L |
Download as CSV |
Click the Download as CSV icon to download the result set of the current query to a comma-separated list. You can specify the CSV settings through Preferences -> SQL Editor -> CSV output dialogue. |
F8 |
Macros |
Click the Macros icon to manage the macros. You can create, edit or clear the macros through Manage Macros option. |
The SQL Editor Panel
The SQL editor panel is a workspace where you can manually provide a query, copy a query from another source, or read a query from a file. The SQL editor features syntax coloring and auto-completion.
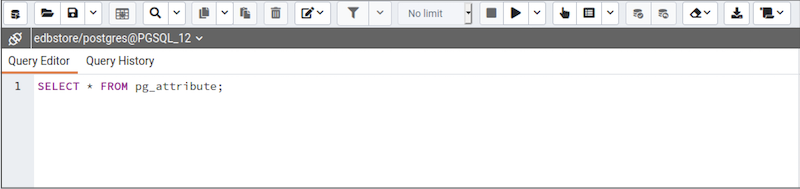
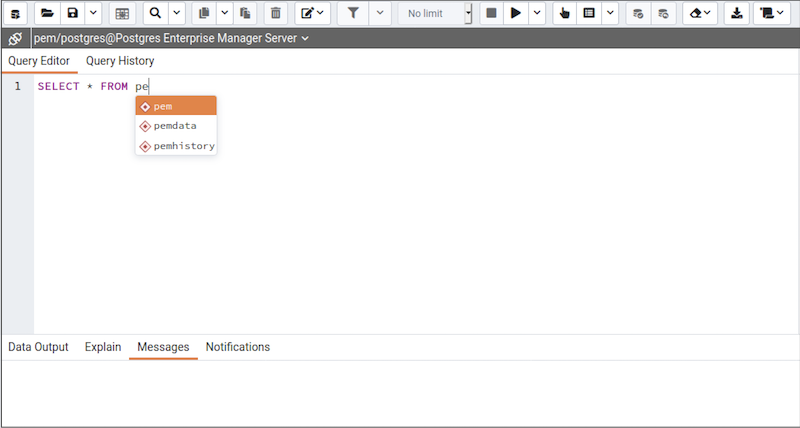
To use auto-complete, begin typing your query; when you would like the Query editor to suggest object names or commands that might be next in your query, press the Control+Space key combination. For example, type \*SELECT \* FROM\* (with a trailing space), and then press the Control+Space key combination to select from a popup menu of auto-complete options.
After entering a query, select the Execute/Refresh icon from the toolbar. The complete contents of the SQL editor panel will be sent to the database server for execution. To execute only a section of the code that is displayed in the SQL editor, highlight the text that you want the server to execute, and click the Execute/Refresh icon.
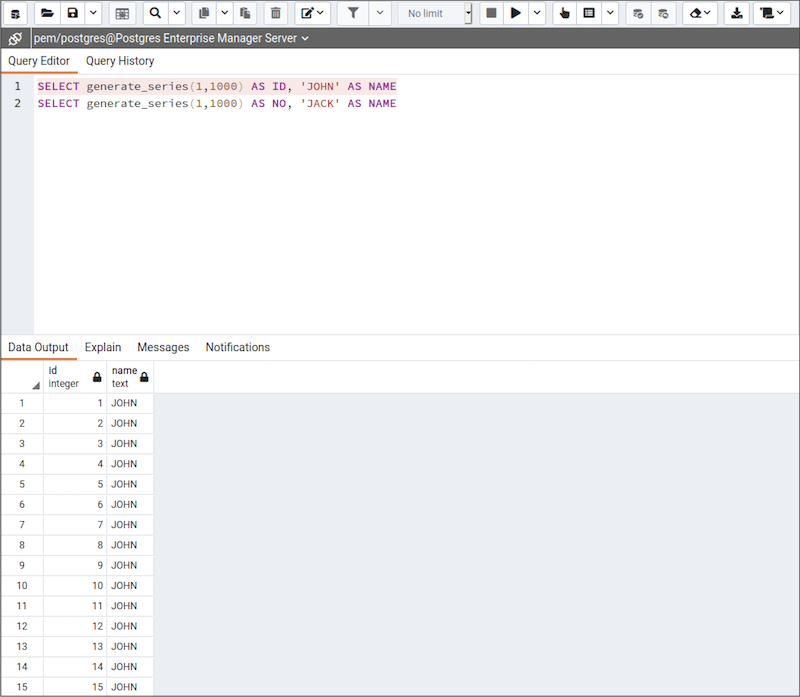
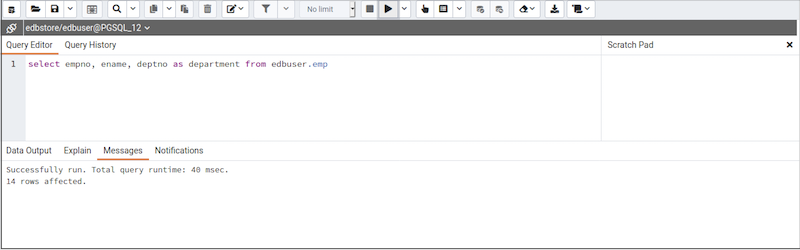
The message returned by the server when a command executes is displayed on the Messages tab. If the command is successful, the Messages tab displays execution details.
Options on the Edit menu offer functionality that helps with code formatting and commenting:
- The auto-indent feature will automatically indent text to the same depth as the previous line when you press the Return key.
- Block indent text by selecting two or more lines and pressing the Tab key.
- Implement or remove SQL style or toggle C style comment notation within your code.
You can also drag and drop certain objects from the tree-view to save time spent typing long object names. Text containing the object name will be fully qualified with the schema name. Double quotes will be added if required. For functions and procedures, the function name along with parameter names will be pasted in the Query Tool.
The Data Output Panel
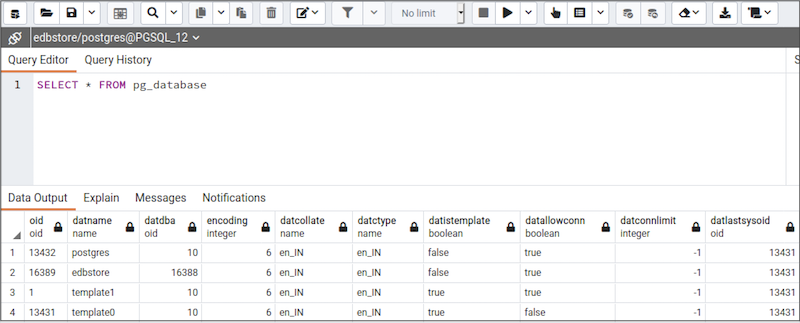
The Data Output panel displays data and statistics generated by the most recently executed query.
Data Output Tab
The Data Output tab displays the result set of the query in a table format. You can:
- Select and copy from the displayed result set.
- Use the
Execute/Refreshoptions to retrieve query execution information and set query execution options. - Use the
Download as CSVicon to download the content of theData Outputtab as a comma-delimited file. - Edit the data in the result set of a
SELECTquery if it is updatable.
A result set is updatable if:
- All columns are either selected directly from a single table, or they are not actually a table column (for example, the concatenation of two columns). Only columns that are selected directly from the table are editable, other columns are read-only.
- All the primary key columns or OIDs of the table are selected in the result set.
Any columns that are renamed or selected more than once are also read-only.
Note To work with an updatable query result set, you must have
psycopg2driver version 2.8 or above installed.
Editable and read-only columns are identified using pencil and lock icons (respectively) in the column headers.

An updatable result set is similar to the Data Grid in View/Edit Data mode, and can be modified in the same way.
If Auto-commit is off, data changes are made as part of the ongoing transaction; if no transaction is ongoing a new one is initiated. The data changes are not committed to the database unless the transaction is committed.
If any errors occur during saving (for example, trying to save a NULL into a column with a NOT NULL constraint) the data changes are rolled back to an automatically created SAVEPOINT to ensure any previously executed queries in the ongoing transaction are not rolled back.
All rowsets from previous queries or commands that are displayed in the Data Output panel will be discarded when you invoke another query; open another query tool browser tab to keep your previous results available.
Explain Tab
To generate the Explain or Explain Analyze plan of a query, click on Explain or Explain Analyze button in the toolbar.
More options related to Explain and Explain Analyze can be selected from the drop down on the right side of Explain Analyze button in the toolbar.
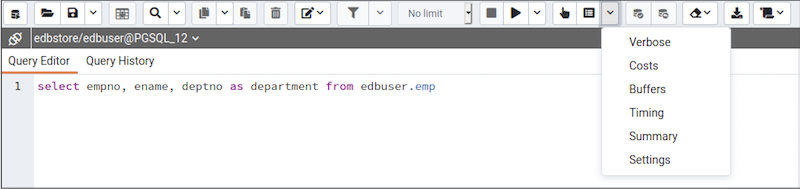
Please note that PEM generates the Explain [Analyze] plan in JSON format.
On successful generation of Explain plan, it will create three tabs/panels under the Explain panel.
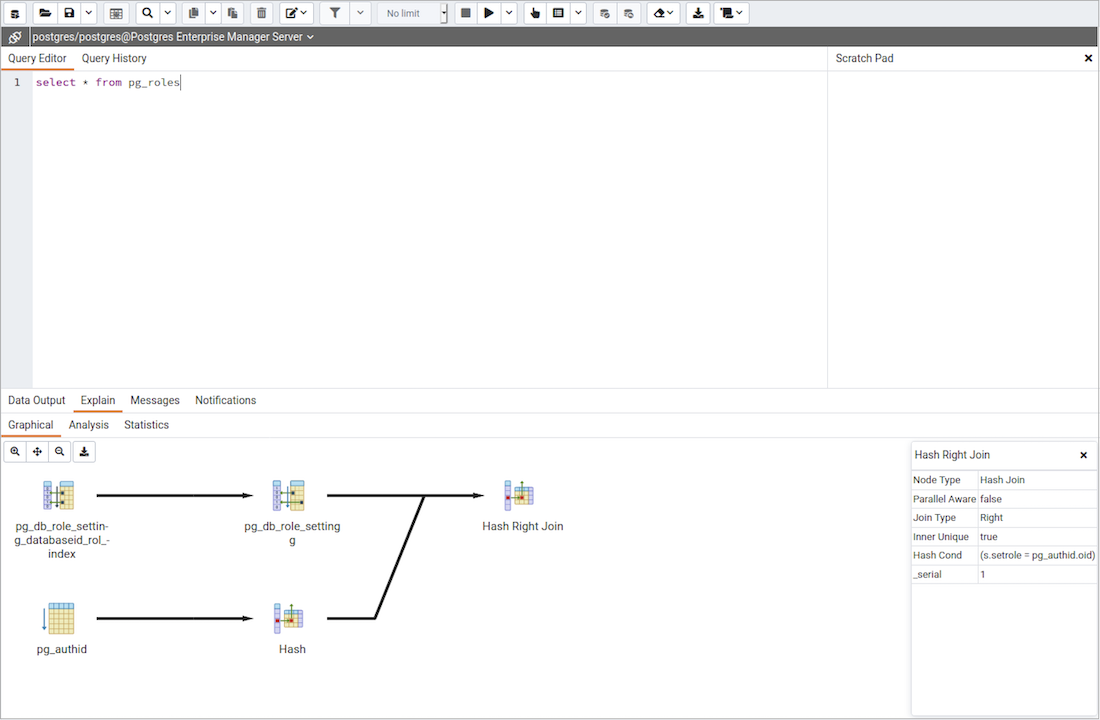
Graphical Tab
Hover over an icon on the Graphical tab to review information about that item; a popup window will display information about the selected object. For information on JIT statistics, triggers and a summary, hover over the icon on top-right corner; a similar popup window will be displayed when appropriate.
Please note that EXPLAIN VERBOSE cannot be displayed graphically.
Use the download button on top left corner of the Explain canvas to download the plan as an SVG file. Please note that Download as SVG feature is not supported on Internet Explorer.
The query plan that accompanies the Explain analyze is available on the Data Output tab.
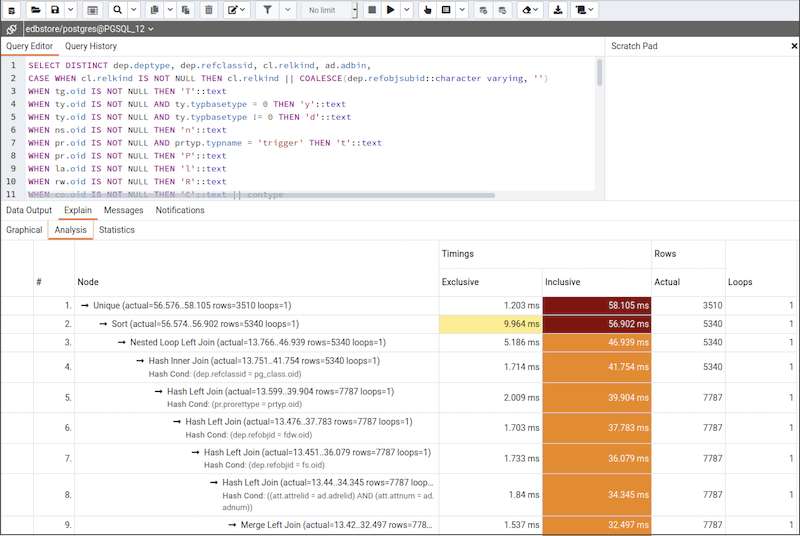
Analysis Tab
The Analysis tab shows the plan details in table format, it generates a format similar to the format available at explain.depsez.com. Each row of the table represents the data for a Explain Plan Node. The output may contain the node information, exclusive timing, inclusive timing, actual vs. planned rows, actual rows, planned rows, or loops. When you select a row, the child rows of that selected row are marked with an orange dot.
If the percentage of the exclusive/inclusive timings of the total query time is:
Greater than 90 –> Red
Greater than 50 –> Orange (between red and yellow)
Greater than 10 –> Yellow
If the planner has misestimated the number of rows (actual vs planned) by:
10 times –> Yellow color
100 times –> Orange (between Red and Yellow) color
1000 times –> Red color
Statistics Tab
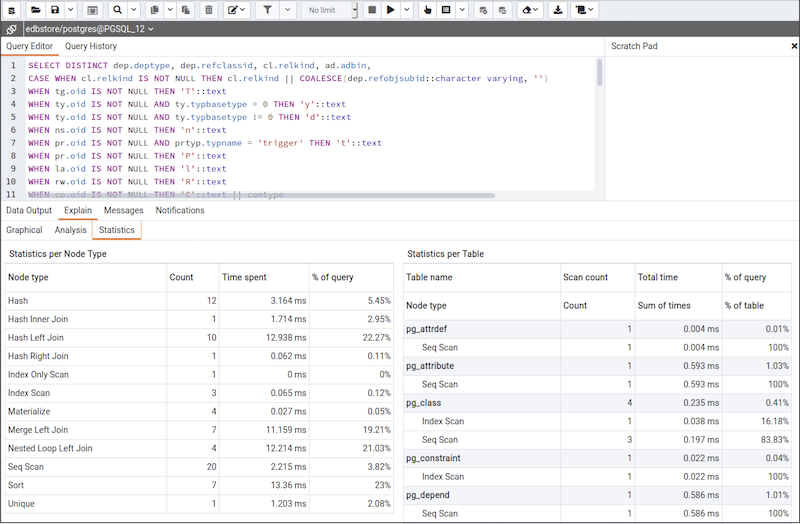
The Statistics tab displays information in two tables:
Statistics per Node Typetells you how many times each node type was referenced.Statistics per Tabletells you how many times each table was referenced by the query.
Messages Tab
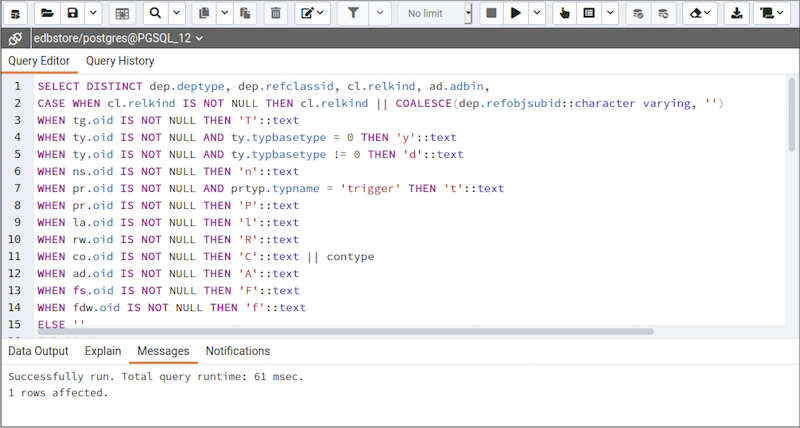
Use the Messages tab to view information about the most recently executed query:
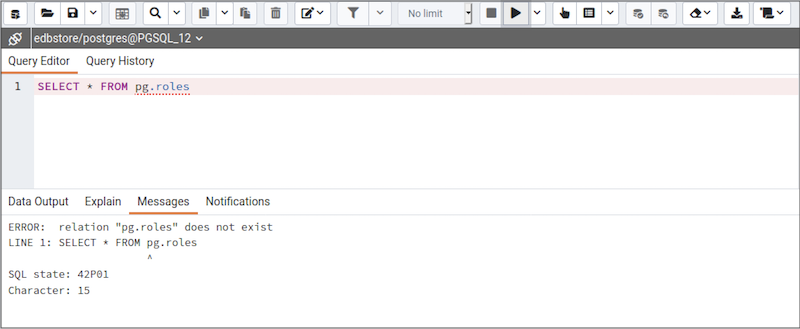
If the server returns an error, the error message will be displayed on the Messages tab, and the syntax that caused the error will be underlined in the SQL editor. If a query succeeds, the Messages tab displays how long the query took to complete and how many rows were retrieved:
Notifications Tab
Use the Notifications tab to view the notifications using PostgreSQL Listen/Notify feature. For more details, see PostgreSQL documentation.
Example:
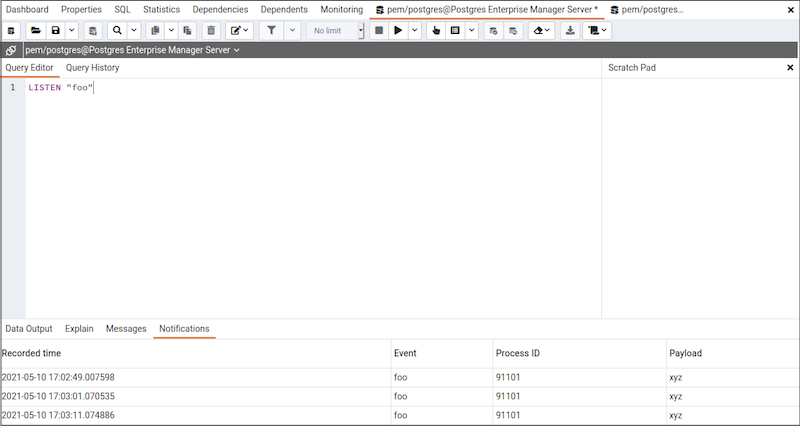
- Execute
LISTEN "foo"in firstQuery Toolsession.

- In the another
Query Toolsession, executeNotifycommand orpg_notifyfunction to send the notification of the event together with the payload.
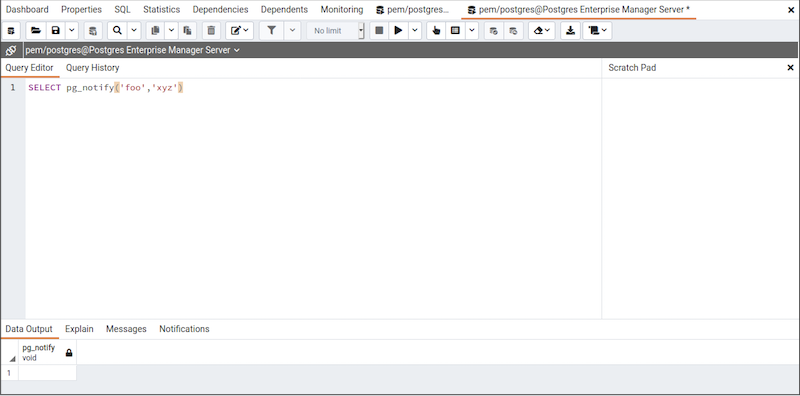
- You can observe the
Notificationtab in the firstQuery Toolsession where it shows the Recorded time, Event, Process ID, and the Payload of the particular channel.
Query History Panel
Use the Query History tab to review activity for the current session:
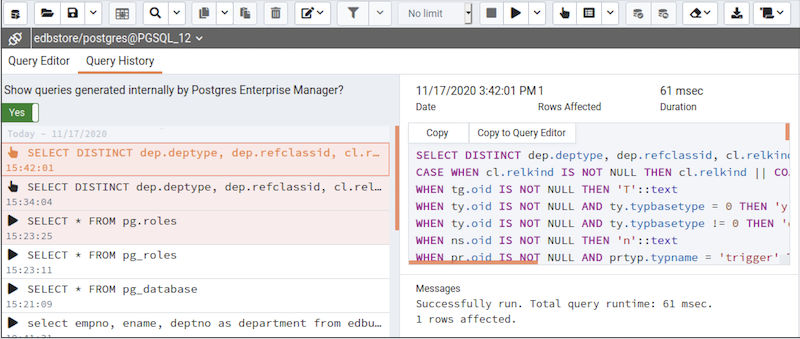
The Query History tab displays information about recent commands:
- The date and time that a query was invoked.
- The text of the query.
- The number of rows returned by the query.
- The amount of time it took the server to process the query and return a result set.
- Messages returned by the server (not noted on the
Messagestab). - The source of the query (indicated by icons corresponding to the toolbar).
You can show or hide the queries generated internally by pgAdmin (during View/Edit Data or Save Data operations).
To erase the content of the Query History tab, select Clear history from the Clear drop-down menu.
Query history is maintained across sessions for each database on a per-user basis when running in Query Tool mode. In View/Edit Data mode, history is not retained. By default, the last 20 queries are stored for each database. This can be adjusted in config_local.py by overriding the MAX_QUERY_HIST_STORED value.
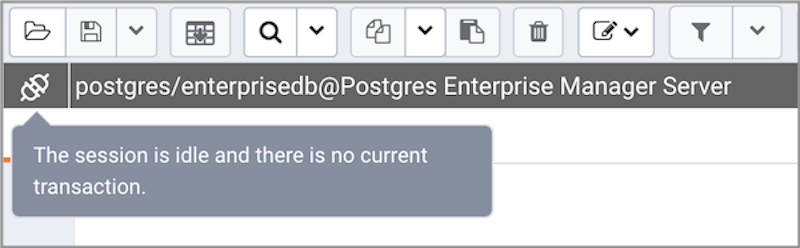
Connection Status
Use the Connection status feature to view the current connection and transaction status by clicking on the status icon in query tool:
Macros
Query Tool Macros enable you to execute pre-defined SQL queries with a single key press. Pre-defined queries can contain the placeholder SELECTION. Upon macro execution, the placeholder will be replaced with the currently selected text in the Query Editor pane of the Query Tool.

To create a macro, select the Manage Macros option from the Macros menu on the Query Tool. Select the key you wish to use, enter the name of the macro, and the query, optionally including the selection placeholder, and then click the Save button to store the macro.
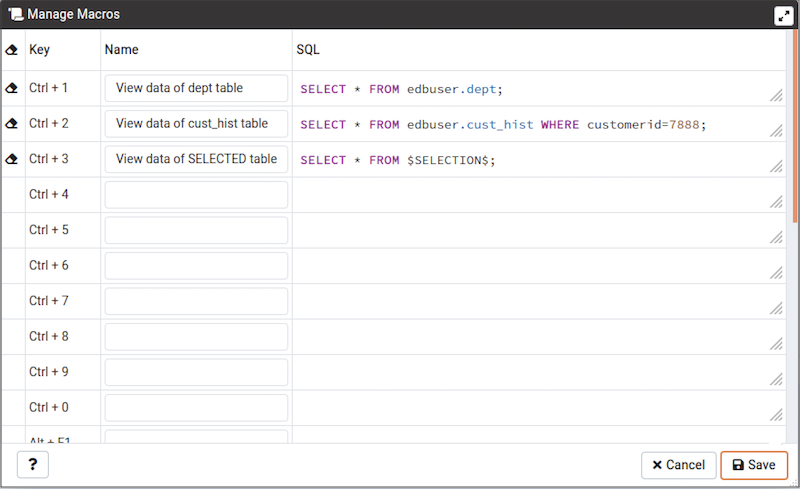
To clear a macro, select the macro on the Manage Macros dialogue, and then click the Clear button.
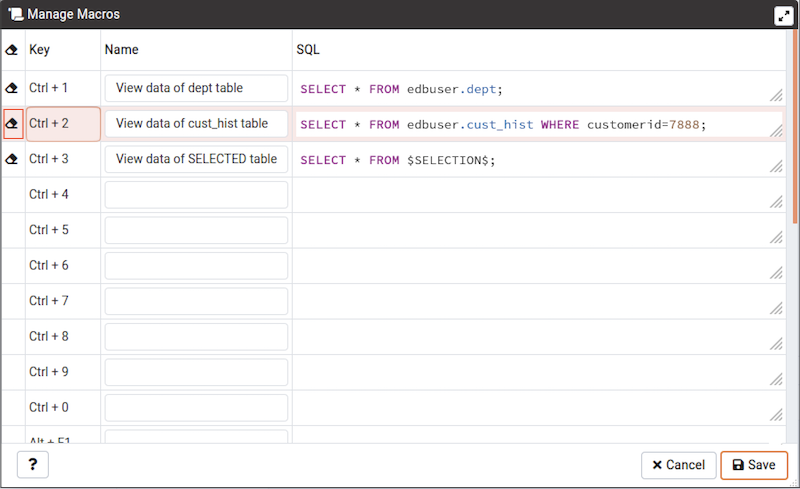
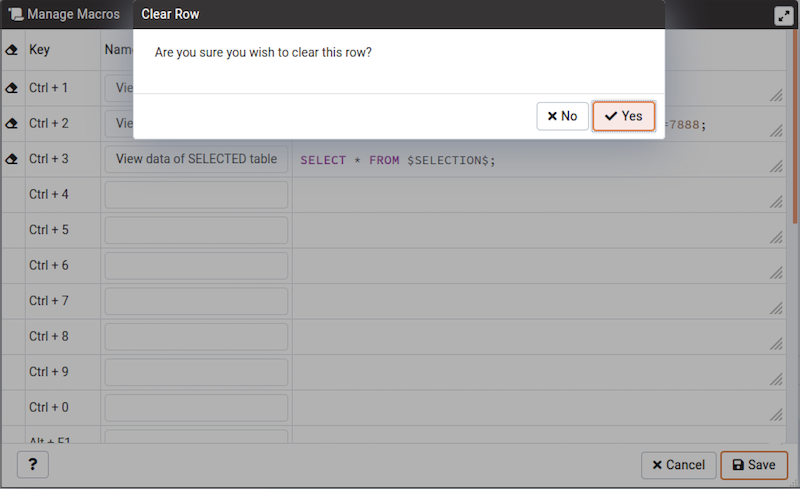
The server will prompt you for confirmation to clear the macro.
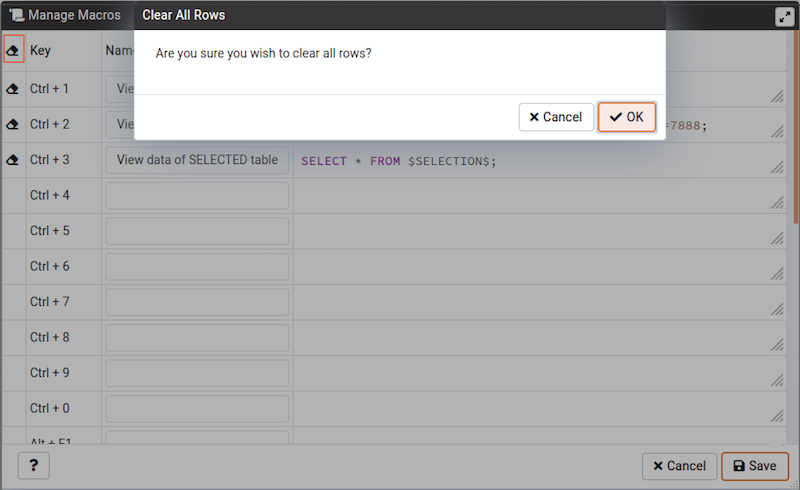
To clear all macros, click on the Clear button on left side of the key. The server will prompt you for confirmation to clear all the rows.
To execute a macro, simply select the appropriate shortcut keys, or select it from the Macros menu.
The PEM Schema Diff Tool
Schema Diff is a feature that allows you to compare schema objects between two database schemas. Use the Tools menu to access Schema Diff.
The Schema Diff feature allows you to:
- Compare and synchronize the database schemas (from source to target).
- Visualize the differences between database schemas.
- List the differences in SQL statement for target schema objects.
- Generate synchronization scripts.
Note The source and target databases must be of the same major version.
Click on Schema Diff under the Tools menu to open a selection panel. Choose the source and target servers, databases, and schemas that will be compared. After selecting the objects, click on the Compare button.
You can open multiple copies of Schema Diff in individual tabs simultaneously. To close a tab, click the X in the upper-right hand corner of the tab bar.
Use the Preferences dialog to specify if Schema Diff should open in a new browser tab. Set Open in new browser tab option to true.
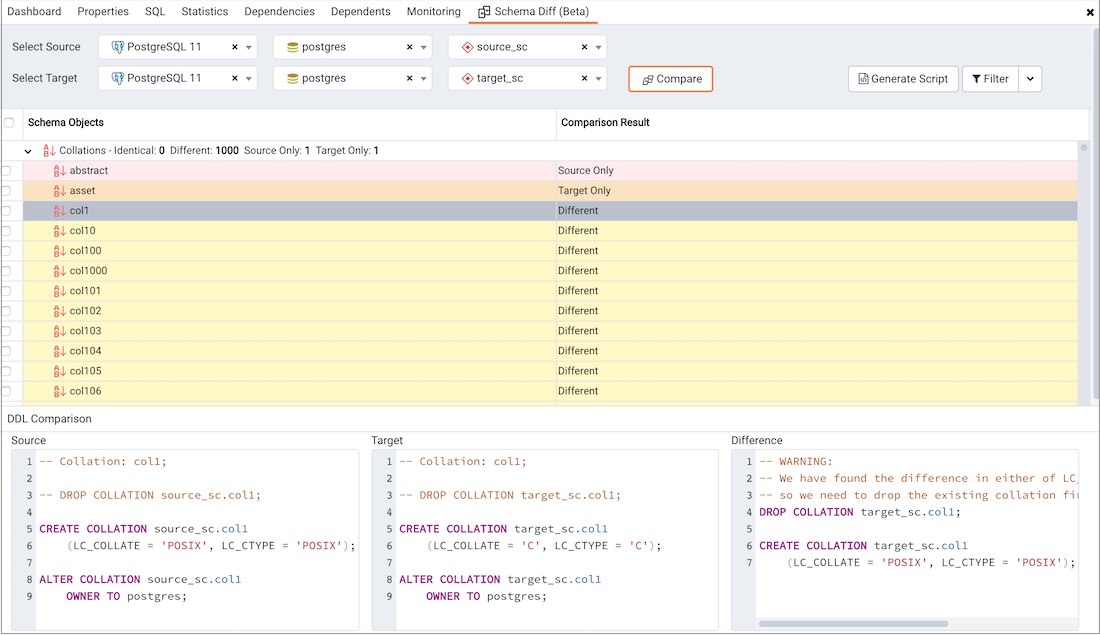
The Schema Diff panel is divided into two panels; an Object Comparison panel and a DDL Comparison panel.
The Schema Diff Object Comparison Panel
In the object comparison panel, you can select the source and target servers of the same major version, databases, and schemas to be compared. You can select any server listed under the browser tree whether it is connected or disconnected. If you select a server that is not connected then it will prompt you for the password before using the server.
Next, select the databases that will be compared. The databases can be the same or different (and within the same server or from different servers).
Lastly, select the source and target schemas which will be compared.
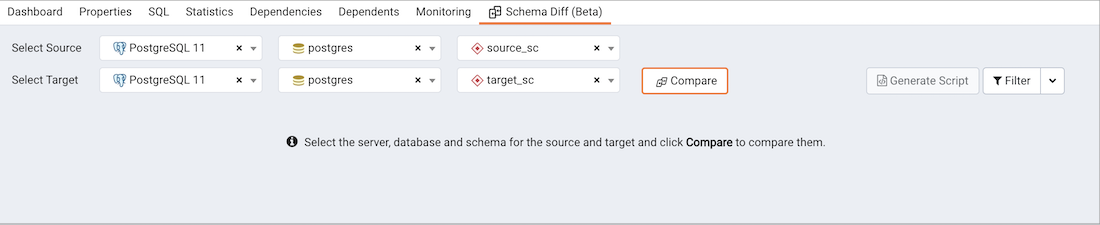
After you select servers, databases, and schemas, click on the Compare button to obtain the Comparison Result.
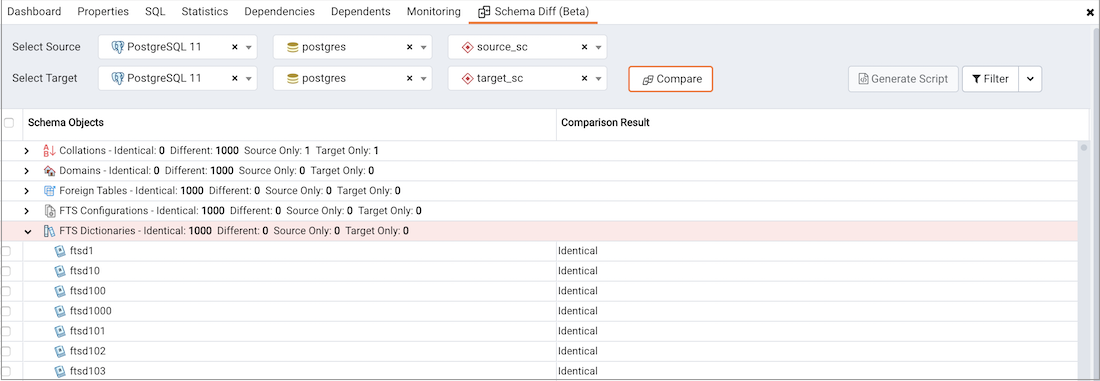
Use the drop-down lists of Functions, Materialized Views, Tables, Trigger Functions, Procedures, and Views to view the DDL statements of all the schema objects.
In the upper-right hand corner of the object comparison panel is a Filter option that you can use to filter the schema objects based on the following comparison criteria:
Identical– If the object is found in both schemas with the same SQL statement, then the comparison result is identical.Different– If the object is found in both schemas but have different SQL statements, then the comparison result is different.Source Only– If the object is found in source schema only and not in target schema, then the comparison result is source only.Target Only– If the object is found in target schema only and not in source schema, then the comparison result is target only.

Click on any of the schema objects in the object comparison panel to display the DDL statements for that object in the DDL Comparison panel.
Schema Diff DDL Comparison Panel
The DDL Comparison panel displays three columns:
- The first column displays the DDL statement of the object from the source schema.
- The second column displays the DDL statement of the object from the target schema.
- The third column displays the difference in the SQL statement of the target schema object.
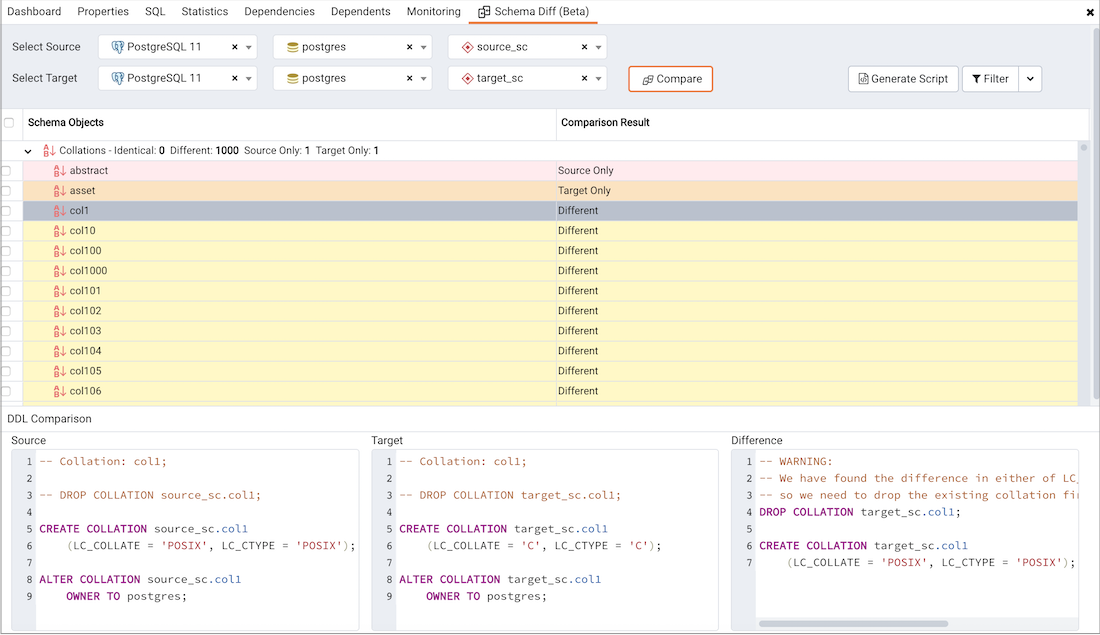
You can review the DDL statements of all the schema objects to check for the differences in the SQL statements.
You can also use the Schema Diff tool to generate a SQL script of the differences found in the target schema object based on the SQL statement of the source schema object. To generate the script, select the checkboxes of the schema objects in the object comparison panel and then click on the Generate Script button in the upper-right hand corner of the object comparison panel.
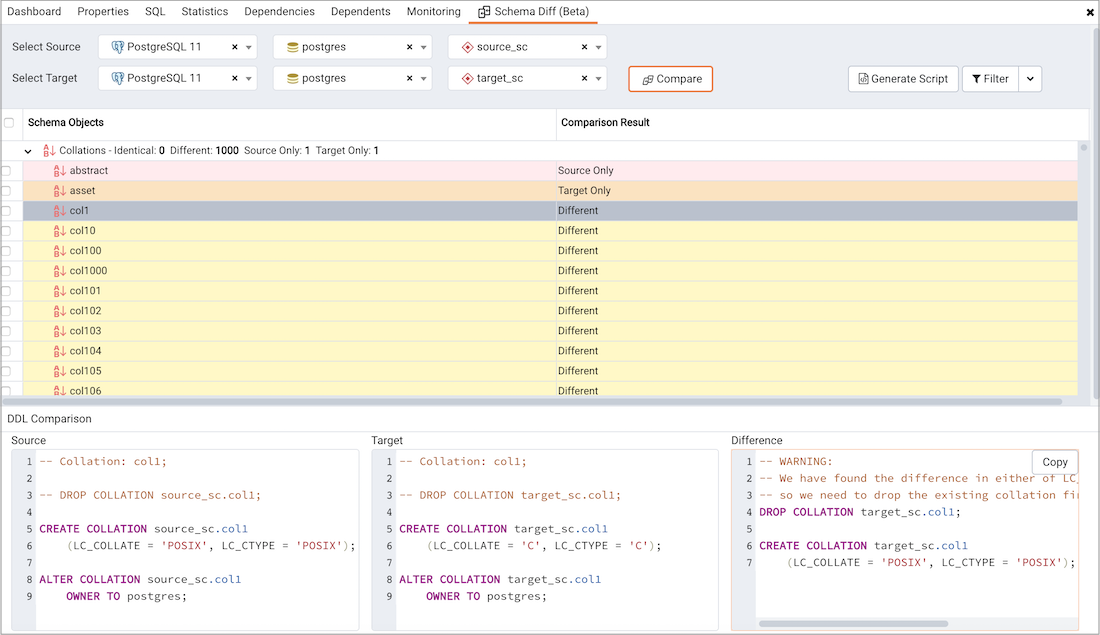
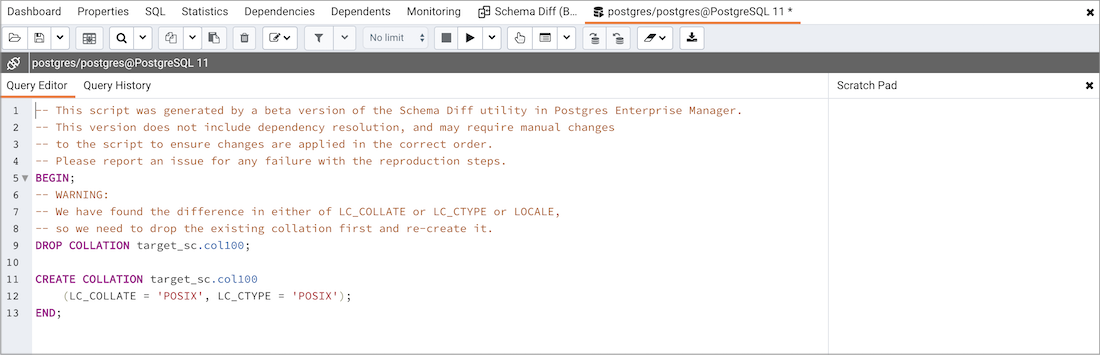
Select the schema objects and click on the Generate Script button to open the Query Tool in a new tab, with the difference in the SQL statement displayed in the Query Editor.
If you have clicked on the schema object to check the difference generated in the DDL Comparison Panel, and you have not selected the checkbox of the schema object, PEM will open the Query Tool in a new tab, with the differences in the SQL statements displayed in the Query Editor.
You can also use the Copy button to copy the difference generated in the DDL Comparison panel.
Apply the SQL Statement in the target schema to synchronize the schemas.
The ERD Tool
The Entity-Relationship Diagram (ERD) tool is a database design tool that provides a graphical representation of database tables, columns, and inter-relationships. ERD can give sufficient information for the database administrator to follow when developing and maintaining the database. You can access the ERD Tool via the ERD Tool menu option on the Tools menu. The ERD Tool allows you to:
- Design and visualize the database tables and their relationships.
- Add notes to the diagram.
- Auto-align the tables and links for cleaner visualization.
- Save the diagram and open it later to continue working on it.
- Generate ready to run SQL from the database design.
- Generate the database diagram for an existing database.
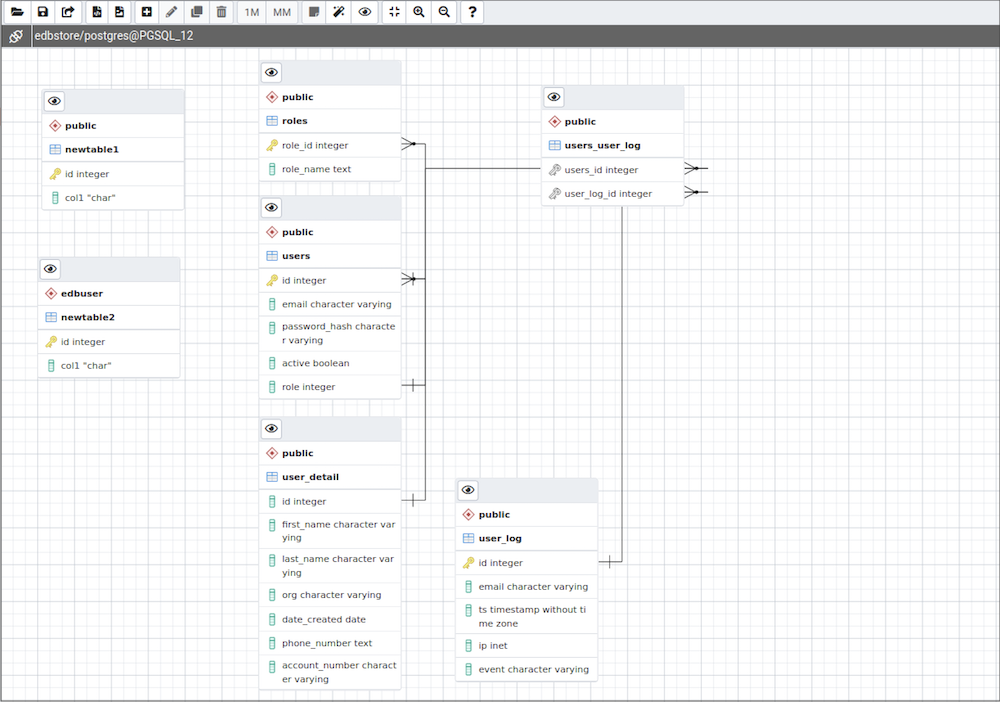
You can open multiple copies of the ERD tool in individual tabs simultaneously. To close a copy of the ERD tool, click the X in the upper-right hand corner of the tab bar.
Toolbar
The ERD Tool toolbar uses context-sensitive icons that provide shortcuts to frequently performed tasks. The option is enabled for the highlighted icon and is disabled for the grayed-out icon.

File Options
| Icon | Behavior | Shortcut |
|---|---|---|
Open File |
Click the Open File icon to load a previously saved diagram. |
Ctrl + O |
Save |
Click the Save icon to perform a quick-save of a previously saved diagram, or to save the diagram to a file. |
Ctrl + S |
Save as |
Click the Save As to open a new browser dialog and specify a new location to save the diagram. |
Ctrl + Shift + S |
Export Options
| Icon | Behavior | Shortcut |
|---|---|---|
Generate SQL |
Click the Generate SQL icon to generate the DDL SQL for the diagram and open a query tool with the generated SQL ready for execution. |
Option + Ctrl + S |
Download image |
Click the Download image icon to save the ERD diagram in a image format. |
Option + Ctrl + I |
Editing Options
| Icon | Behavior | Shortcut |
|---|---|---|
Add table |
Click this button to add a new table to the diagram. On clicking, this will open a table dialog where you can put the table details. | Option/Alt + Ctrl + A |
Edit table |
Click this button to edit a table on the diagram. On clicking, this will open a table dialog where you can change table details. This will enable when a table is selected. | Option/Alt + Ctrl + E |
Clone table |
Click this button to clone the complete table structure, name it with a auto generated name and put it in the diagram. | Option/Alt + Ctrl + C |
Drop table/link |
You can drop a table or link using this button. You need to select a table or link and click on this button to drop it. | Option/Alt + Ctrl + D |
Table Relationship Options
| Icon | Behavior | Shortcut |
|---|---|---|
1M |
Click this button to open a one-to-many relationship dialog to add a relationship between the two tables. The selected table becomes the referencing table and will have the many endpoint of the link. |
Option/Alt + Ctrl + O |
MM |
Click this button to open a many-to-many relationship dialog to add a relationship between the two tables. This option will create a new table based on the selected columns for the two relating tables and link them. | Option/Alt + Ctrl + M |
Utility Options
| Icon | Behavior | Shortcut |
|---|---|---|
Add/Edit note |
Click this button to make notes on tables nodes while designing the database. | Option/Alt + Ctrl + N |
Auto align |
Click this button to auto align all tables and links to make it look more cleaner. | Option/Alt + Ctrl + L |
Show details |
Click this button to toggle the column details visibility. It allows you to show few or more column details. | Option/Alt + Shift + D |
Zoom Options
| Icon | Behavior | Shortcut |
|---|---|---|
Zoom to fit |
Click this button to zoom in/out automatically and fit all the tables to the view. | Option/Alt + Shift + F |
Zoom in |
Click this button to zoom in the diagram. | Option/Alt + Shift + “+” |
Zoom out |
Click this button to zoom out the diagram. | Option/Alt + Shift + “-” |
Table Dialog
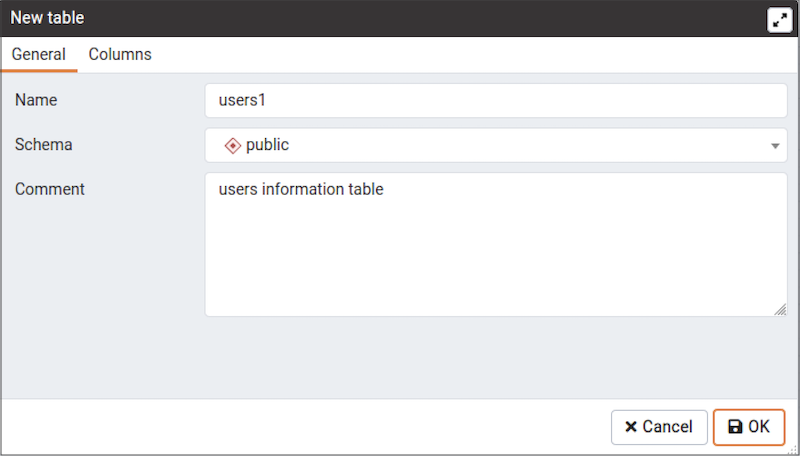
The table dialog allows you to:
- Change the table structure details.
- It can be used edit an existing table or add a new one.
- Refer Table dialog for information on different fields.
Table Node
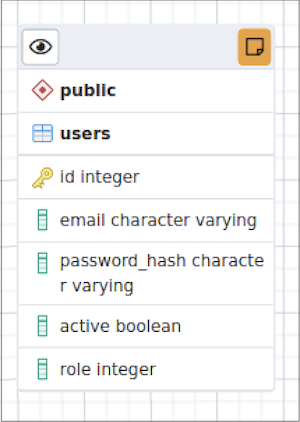
The table node shows table details in a graphical representation:
- The top bar has a
details toggle buttonthat is used to toggle column details visibility. There is also anote buttonthat is visible only if there is some note added. you can click on this button to quickly change the note. - The first row shows the schema name of the table. Eg.
publicin above image. - The second row shows the table name. Eg.
usersin above image. - All other rows below the table name are the columns of the table along with data type. If the column is a primary key then it will have lock key icon eg. id is the primary key in above image. Otherwise, it will have column icon.
- You can click on the node and drag to move on the canvas.
- Upon double click on the table node or by clicking the edit button from the toolbar, the table dialog opens where you can change the table details. Refer Table dialog for information on different fields.
The One to Many Link Dialog
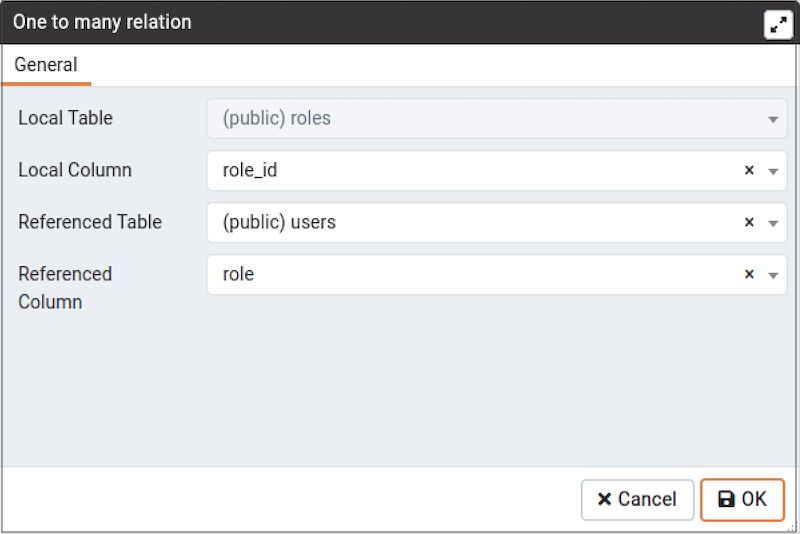
The one to many link dialog allows you to:
- Add a foregin key relationship between two tables.
Local Tableis the table that references a table and has themanyend point.Local Columnis the column that references.Referenced Tableis the table that is being referred and has theoneend point.Referenced Columnis the column that is being referred.
The Many to Many Link Dialog
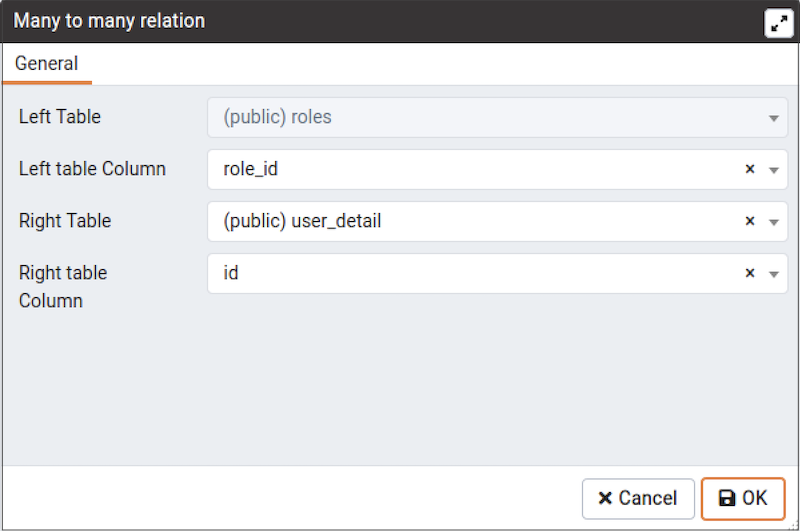
The many to many link dialog allows you to:
- Add a many to many relationship between two tables.
- It creates a relationship tables having columns derived from the two tables and link them to the tables.
Left Tableis the first table that is to be linked. It will receive theoneendpoint of the link with the new relation table.Left Columnis the column of the first table, that will always be a primary key.Right Tableis the second table that is to be linked. It will receive theoneendpoint of the link with the new relation table.Right Columnis the column of the second table, that will always be a primary key.
The Table Link
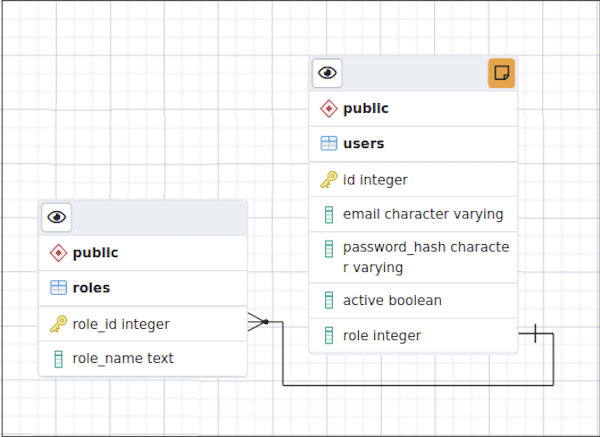
The table link shows relationship between tables:
- The single line endpoint of the link shows the column that is being referred.
- The three line endpoint of the link shows the column that refers.
- If one of the columns that is being referred or that refers is removed from the table then the link will get dropped.
- You can click on the link and drag to move on the canvas.
The Table Notes
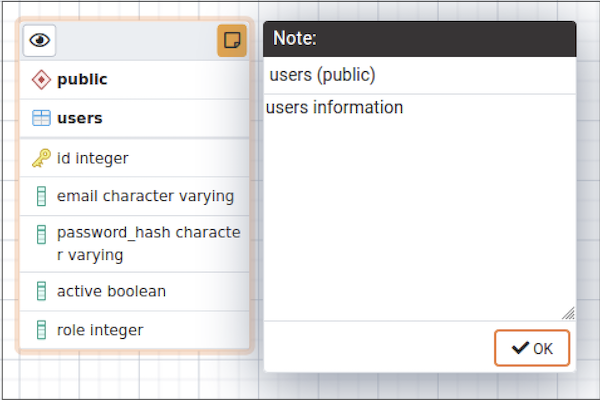
- You can use the notes popup to mark some notes while designing the database.
- You open the pop-up using the toolbar note button.
- If some note is added to a table then it will have notes button on the table node. You can click on the button to check/update notes.
Performance Monitoring and Management
PEM contains built-in functionality that implements enterprise-wide performance monitoring of all managed servers. While you can customize many aspects of the various performance monitoring aspects of PEM, you can also elect to accept the recommended defaults that come out-of-the-box with the product.
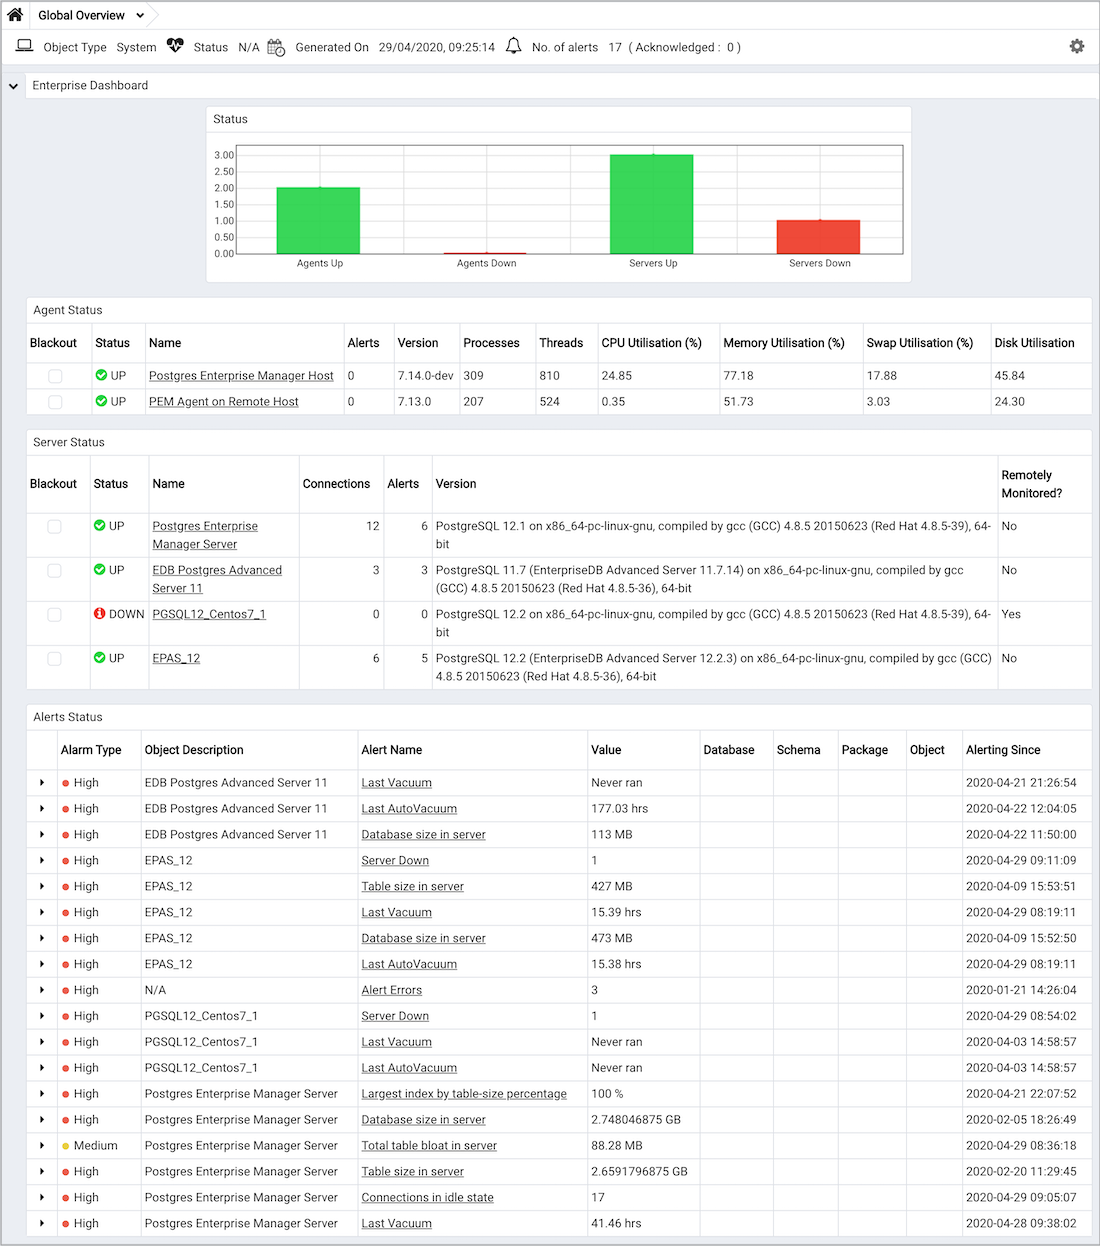
The top-level dashboard is the Global Overview. The Global Overview presents a status summary of all the servers and agents that are being monitored by the PEM server, a list of the monitored servers, and the state of any currently triggered alerts.
Using Dashboards to View Performance Information
PEM displays performance statistics through a number of dashboards; each dashboard contains a series of summary views that contain charts, graphs and tables that display the statistics related to the selected object.
The PEM client displays the Global Overview dashboard when it connects to the PEM server. Additional dashboards provide statistical information about monitored objects. These include the:
Alerts Dashboard
The Alerts dashboard displays the currently triggered alerts. If opened from the Global Overview, the dashboard displays the current alerts for all monitored nodes on the system; if opened from a node within a server, the report will reflect alerts related to that node, and all monitored objects that reside below that object in the tree control.
Audit Log Analysis Dashboard
For Advanced Server users, the Audit Log Analysis dashboard allows you to browse the audit logs that have been collected from instances that have audit logging and collection enabled.
BDR Admin Dashboard
The BDR Admin dashboard displays the overview of information about BDR node, BDR group, and BDR worker.
BDR Group Monitoring Dashboard
The BDR Group Monitoring dashboard displays the information about BDR group Subscription and BDR group replication slots.
BDR Node Monitoring Dashboard
The BDR Node Monitoring dashboard displays the information about BDR node slots, BDR node Replication rates, and BDR conflict history summary for the selected node.
Database Analysis Dashboard
The Database Analysis dashboard displays performance statistics for the selected database.
I/O Analysis Dashboard
The I/O Analysis dashboard displays I/O activity across various areas such as object DML activity, log operations and more.
Memory Analysis Dashboard
The Memory Analysis dashboard supplies statistics concerning various memory-related metrics for the Postgres server.
Object Activity Analysis Dashboard
The Object Activity Analysis dashboard provides performance details on tables/indexes of a selected database.
Operating System Analysis Dashboard
The Operating System Analysis dashboard supplies information regarding the performance of the underlying machine’s operating system.
Probe Log Analysis Dashboard
The Probe Log Analysis dashboard displays any error messages returned by a PEM agent.
Server Analysis Dashboard
The Server Analysis dashboard provides general performance information about the overall operations of a selected Postgres server.
Server Log Analysis Dashboard
The Server Log Analysis dashboard allows you to filter and review the contents of server logs that are stored on the PEM server.
Session Activity Analysis Dashboard
The Session Activity Analysis dashboard provides information about the session workload and lock activity for the selected server
Session Waits Analysis Dashboard
The Session Waits Analysis dashboard provides an overview of the current DRITA wait events for an Advanced Server session.
Storage Analysis Dashboard
The Storage Analysis dashboard displays space-related metrics for tablespaces and objects.
System Waits Analysis Dashboard
The System Waits Analysis dashboard displays a graphical analysis of system wait information for an Advanced Server session.
Streaming Replication Analysis Dashboard
The Streaming Replication Analysis dashboard displays statistical information about WAL activity for a monitored server and allows you to monitor the status of Failover Manager clusters.
There are two ways to open a dashboard; you can:
- Select an active dashboard name from the
Dashboardsmenu (accessed via the Management menu). - Right click on the name of a monitored object in the tree control and select the name of the dashboard you would like to review from the Dashboards menu.
Each dashboard is displayed on the Monitoring tab in the main panel of the client window. After opening a dashboard, you can navigate to other dashboards within the same tab.
Each dashboard header includes navigation menus that allow you to navigate to other dashboards; use your browsers forward and back icons to scroll through previously-viewed dashboards. Use the Refresh icon to update the current dashboard.
Options on the Dashboard Configuration dialog allow you to link the time lines of all of the line graphs on the dashboard. To open the Dashboard Configuration dialog, click the Settings icon displayed in the dashboard header.
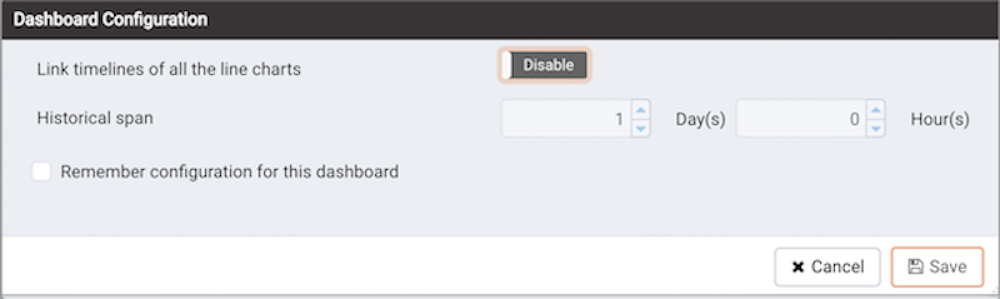
Use fields on the Dashboard Configuration dialog to control attributes of the charts displayed on the dashboard:
- Set the Link timelines of all the line charts slider to Enable to indicate that the specified timeline should be applied to line graphs displayed on the dashboard; if set to Disable, your preferences will be preserved for later use, but will not modify the amount of data displayed.
- Use the
Daysselector to specify the number of days of gathered data that should be displayed on line graphs. - Use the
Hour(s)selector to specify the number of hours of gathered data that should be displayed on line graphs. - Check the box next to Remember configuration for this dashboard to indicate that the customized time span should be applied to the current dashboard only; if left unchecked, the time span will be applied globally to line graphs on all dashboards.
Please note that settings specified on the Dashboard Configuration dialog are applied only to the current user’s session.
Managing Custom Dashboards
PEM displays performance statistics through a number of system-defined dashboards; each dashboard contains a series of summary views that contain charts, graphs and tables that display statistics related to the selected object. You can use the Manage Dashboards tab to create and manage custom dashboards that display the information that is most relevant to your system.
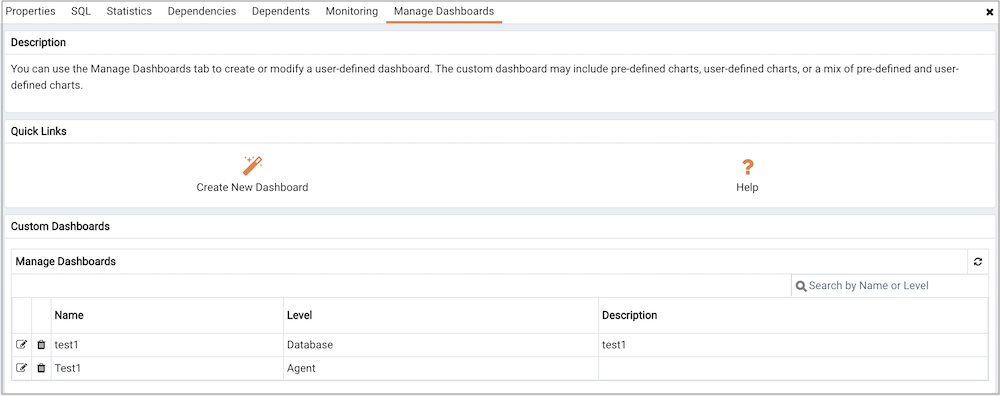
To create a custom dashboard, click the Create New Dashboard link (located in the Quick Links section of the Manage Dashboards tab).
To modify an existing dashboard, click the edit icon to the left of a dashboard name. The dashboard editor will open, displaying the definition of the dashboard. When you’ve finished modifying the dashboard’s definition, click the Save button to preserve your changes; click Cancel to exit without saving your changes.
To delete a dashboard, click the delete icon to the left of a dashboard name. A popup will ask you to confirm that you wish to delete the dashboard; click OK to delete the selected dashboard.
Creating a Custom Dashboard
You can use the PEM dashboard editor to create or modify a user-defined dashboard. The custom dashboard may include pre-defined charts, user-defined charts or a mix of pre-defined and user-defined charts.
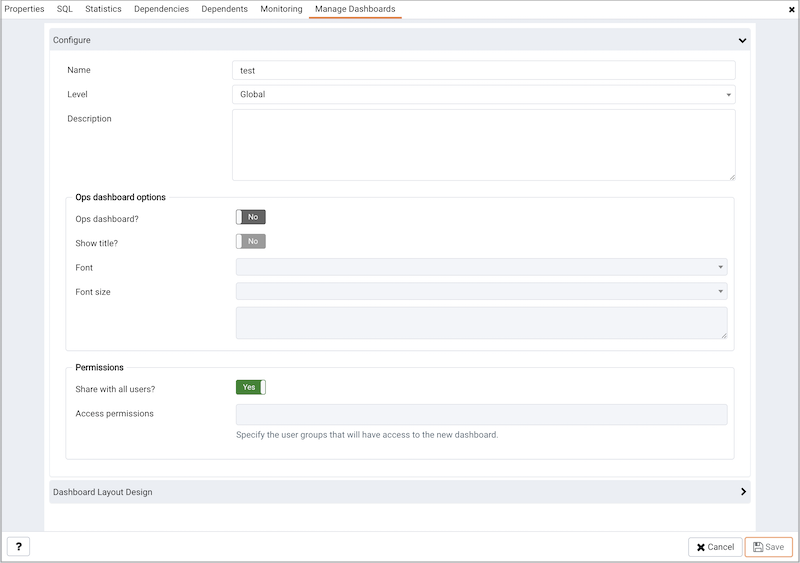
Use the fields in the Configure section to specify general information about the dashboard:
- Specify a name for the dashboard in the
Namefield. The name specified will also be the title of the dashboard if the title is displayed. - Use the
Leveldrop-down listbox to specify the level of the PEM hierarchy within the PEM client on which the dashboard will be displayed. A dashboard may be accessed via the Dashboards menu on a Global level, an Agent level, the Server level or the Database level. Each selected level within the list will expose a different set of metrics on which the custom dashboard’s charts may be based. - Provide a description of the dashboard in the Description field.
Provide information in the fields in the Ops dashboard options box if the dashboard will be used as an Ops dashboard:
- Set the
Ops Dashboard?field to Yes to instruct the server to create a dashboard that is formatted for display on an Ops monitor. - Set the
Show Title?field to Yes to display the dashboard name at the top of the Ops dashboard. - Use the
Fontdrop-down list box to select a custom font style for the title. The selected font style will be displayed in the Preview box. - Use the
Font sizedrop-down list box to select a custom font size for the title. The selected font style will be displayed in the Preview box.
Use the Permissions box to specify the users that will be able to view the new dashboard:
- Set the
Share with all sliderto Yes to instruct the server to allow all Teams to access the dashboard, or set Share with all to No to enable the Access permissions field. - Use the
Access permissionsfield to specify which roles can view the new dashboard. Click in the field, and select from the list of users to add a role to the list of users with dashboard access.
When you’ve completed the Configure Dashboard section, click the arrow in the upper-right corner to close the section, and access the Dashboard Layout Design section.
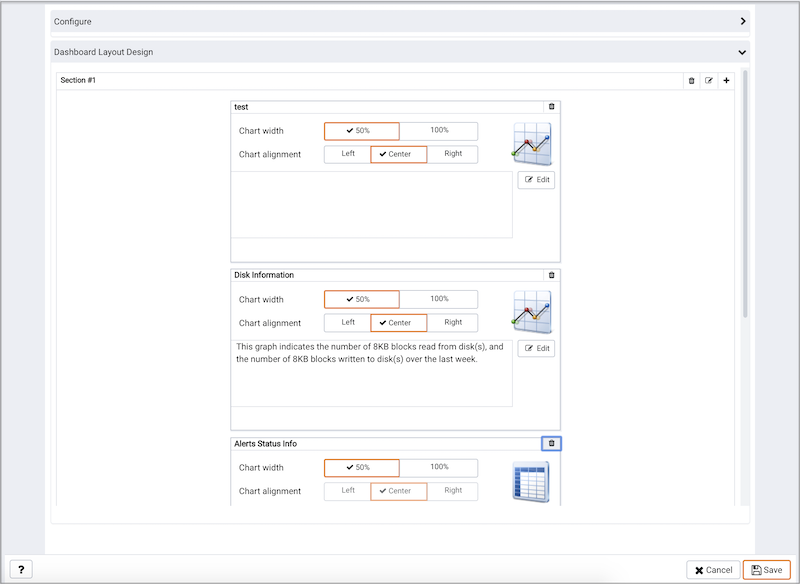
Click the edit icon in a section header to specify a section name; then, click the add icon (+) to add a chart to the section.
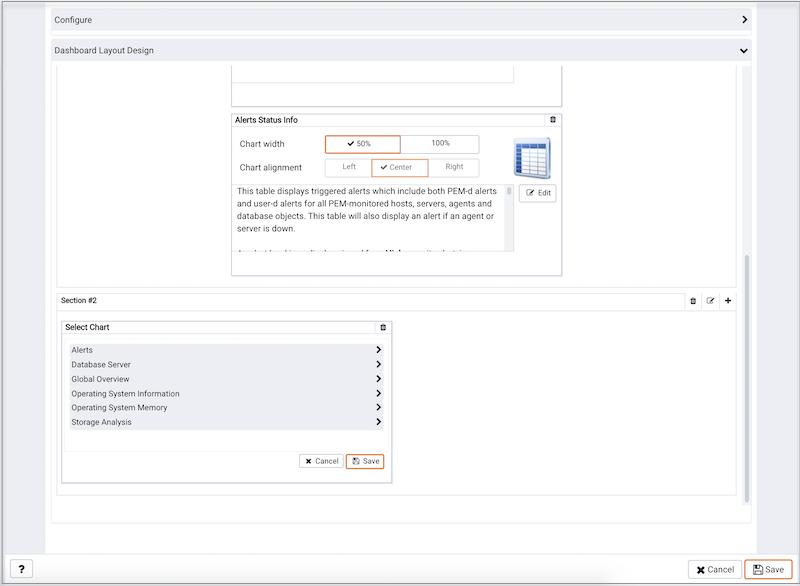
Use the arrows to the right of each chart category to display the charts available and select a chart.
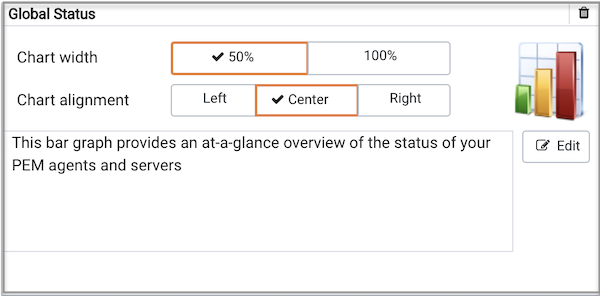
Use the chart detail selectors to specify placement details for the chart:
Use the
Chart widthselector to indicate the width of the chart; select 50% to display the chart in half of the dashboard, or 100% to use the whole dashboard width.Use the
Chart alignmentselector to indicate the position of the chart within the section:Select
Leftto indicate that the chart should be left-justified.Select
Centerto indicate that the chart should be centered.Select
Rightto indicate that the chart should be right-justified.
Please note that tables are always displayed centered.
When creating or editing a custom dashboard, you can use drag and drop to re-arrange the charts within a section or to move a chart to a different section.
To add another chart to your dashboard, click the add icon (+) in the section header. When you’ve finished editing the dashboard, click the Save button to save your edits and exit.
To exit without saving your changes, click the Cancel button.
Creating an Ops Dashboard
You can use the PEM dashboard editor to create a custom dashboard formatted for display on an Ops monitor. An Ops dashboard displays the specified charts and graphs, while omitting header information and minimizing extra banners, titles, and borders.
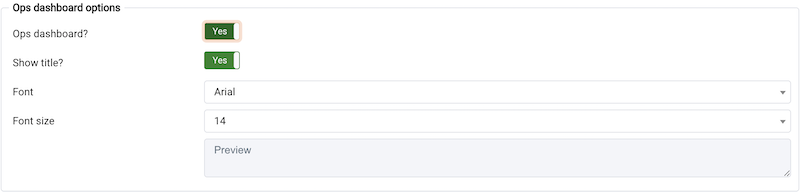
To create an Ops dashboard, provide detailed information about the Ops display in the Ops dashboard options section of the Create Dashboard dialog.
- Set the
Ops Dashboard?field toYesto instruct the server to create a dashboard that is formatted for display on an Ops monitor. - Set the
Show Title?field toYesto display the dashboard name at the top of the Ops dashboard. - Use the
Fontdrop-down list box to select a custom font style for the title. The selected font style will be displayed in thePreviewbox. - Use the
Font sizedrop-down list box to select a custom font size for the title. The selected font style will be displayed in thePreviewbox.
After adding charts and tables to the Ops dashboard, click the Save button to save your work. You can then access the dashboard by navigating through the Dashboards menu of the hierarchy level specified in the Level field on the New Dashboard dialog.
Using the Manage Charts tab
You can use the Manage Charts tab to access dialogs that allow you to create or modify a custom line chart or table, or import a Capacity Manager template for use in a custom chart. After defining a chart, you can display the chart on a custom dashboard. To open the Manage Charts tab, select Manage Charts... from the PEM client Management menu.
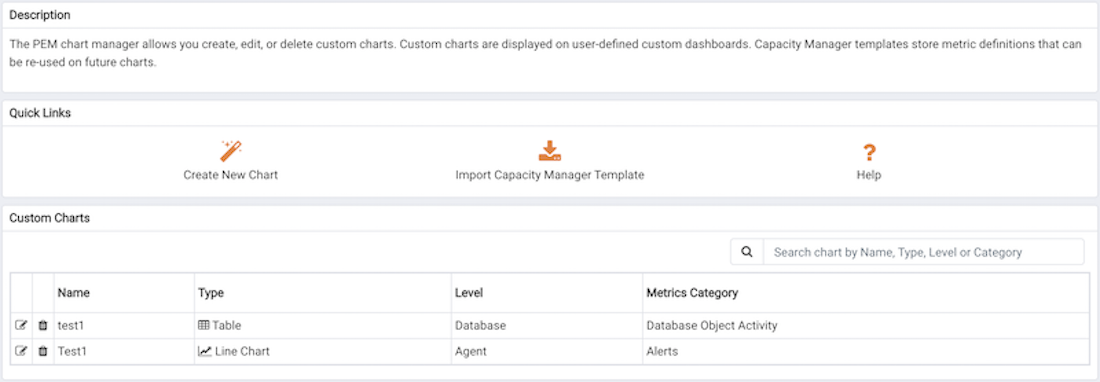
The Manage Charts tab provides a Quick Links menu that allows you to access dialogs to:
Create a New Chartfor use on a custom dashboard.Import a Capacity Managertemplate to use as a template for creating a custom chart.- Access online
Help.
The Custom Charts table displays a list of user-defined charts; when a chart is newly added, the font displays in green. When you add an additional chart or refresh the screen, the name of the chart is displayed in black.

Use the search box in the upper-right hand corner of the Custom Charts table to search through your custom charts. Specify a:
- Chart name
- Type
- Level
- Metrics Category
Use icons to the left of a charts name in the Custom Charts table to manage a chart:
- Click the edit icon to open the
Chart Configurationwizard and modify aspects of the chart or table. - Click the delete icon to delete the selected chart.
Creating a Custom Chart
Click the Create New Chart icon in the Quick Links section of the Manage Charts tab to open the Create Chart wizard. The wizard will walk you through the steps required to define a new chart.
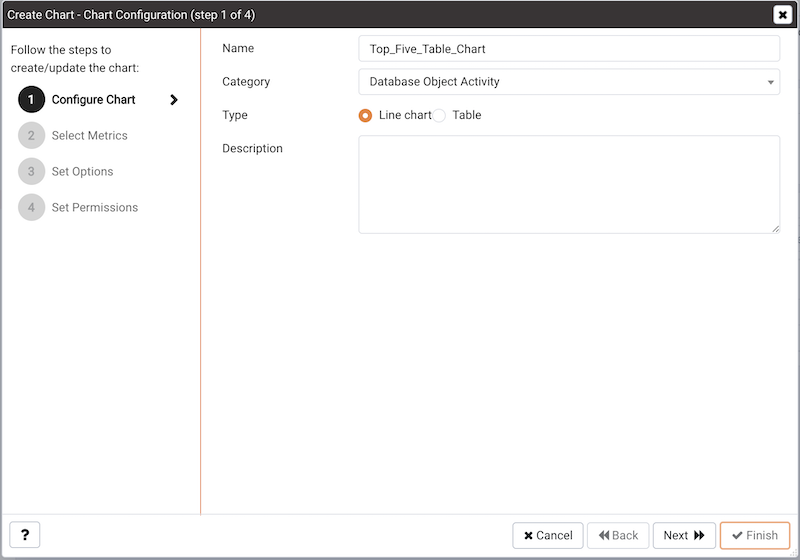
Use the fields on the Configure Chart dialog to specify general information about the chart:
- Specify the name of the chart in the
Namefield. - Use the drop-down listbox in the
Categoryfield to specify the category in which this chart will be displayed; when adding a custom chart to a custom dashboard, the chart will be displayed for selection in the category specified. - Use the radio buttons in the
Typefield to specify if the chart will be aLine chartor aTable. - Provide a description of the chart in the
Descriptionfield. The description will be displayed to the user viewing the chart (on a custom dashboard) when they click the information icon.
When you’ve completed the fields on the Configure Chart dialog, click Next to continue.
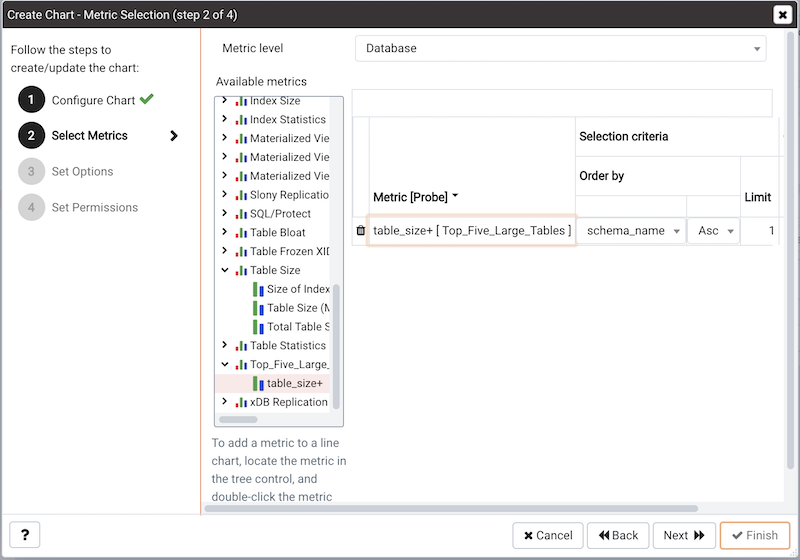
Use the fields on the Select Metrics dialog to select the metrics that will be displayed on the chart.
Use the
Metric leveldrop-down listbox to specify the level of the PEM hierarchy from which you wish to select metrics. You can specify Agent, Database, or Server. Each level offers access to a unique set of probes and metrics.Use the tree control in the Available metrics box to select the metrics that will be displayed on the chart.
If you are creating a table, you may only select metrics from one probe; each node of the tree control lists the metrics returned by a single probe. Expand a node of the tree control, and check the boxes to the left of a metric name to include that metric data in the table.
If you are creating a line chart, expand the nodes of the tree control and double-click each metric that you would like to include in the chart.
Use the fields in the Selected metrics panel to specify how the metric data will be displayed in your chart. The selection panel displays the name of the metric in the (non-modifiable) Metric [Probe] column. You can:
- Click the garbage can icon to delete a metric from the list of selected metrics.
- Use the drop-down listboxes in the
Selection Criteriacolumn to specify the order of the data displayed. - Use the
Limitfield to specify the number of rows in a table or lines in a chart:
The maximum number of lines allowed in a chart is 32.
The maximum number of rows allowed in a table is 100.
If you are creating a line chart, PEM supports comparisons of cross-hierarchy metrics.
- Click the
compare iconto open a selection box that allows you to select one or more probe-specific attributes (i.e. CPUs, interfaces, databases, etc.) to compare in the chart. - Click the
copyicon to apply your selections to all of the metrics for the same probe. When the popup opens, clickYesto confirm that other selections for the same probe will be overwritten, orNoto exit the popup without copying the attributes.
- Click the
When you’ve completed the fields on the Select Metrics dialog, click Next to continue.
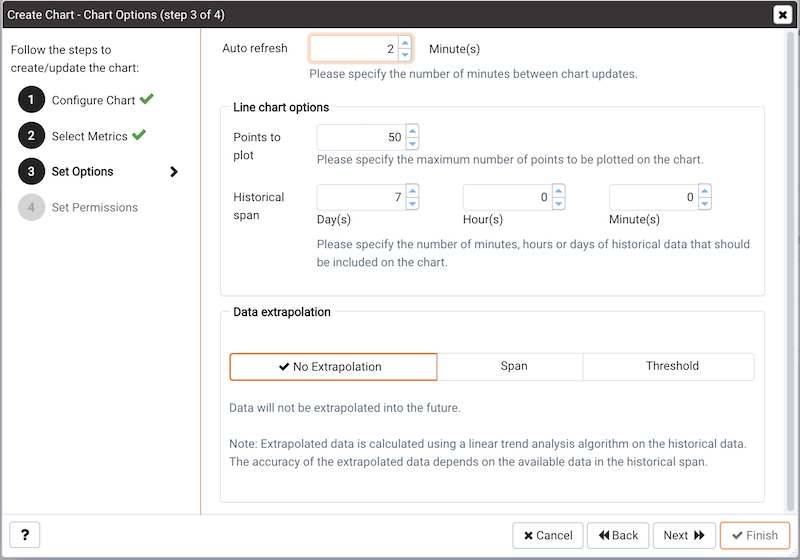
Use the fields on the Set Options dialog to specify display options for your chart:
- Use the
Auto Refreshfield to specify the number of minutes between chart updates - choose a value from 1 to 120. The default auto refresh rate is 2 minutes.
Use fields under the Line chart options heading to specify display preferences for a line chart:
- Use the
Points to plotfield to specify the maximum number of points that will be plotted on the chart. - Use the fields to the right of the Historical span label to specify how much historical data should be displayed on the chart:
- Use the
Day(s)field to specify the number of days of historical data that should be included on the chart. - Use the
Hour(s)field to specify the number of hours of historical data that should be included on the chart. - Use the
Minute(s)field to specify the number of minutes of historical data that should be included on the chart.
Use the fields in the Data extrapolation box to specify if PEM should generate extrapolated data based on historical data:
- Click the
No Extrapolationlabel to omit extrapolated data from the chart. - Click the
Spanlabel to use the Days and Hours selectors to specify the period of time spanned by the metrics on the chart. - Click the
Thresholdlabel to use threshold selectors to specify a maximum or minimum value for the chart.
When you’ve completed the fields on the Set Options dialog, click Next to continue.
Use the fields on the Set Permissions dialog to specify display options for your chart.
- Set the
Share with all slidertoYesto indicate that the chart will be available to all authorized users, orNoto restrict access to the users or groups specified in the Access permissions field. - Use the
Access permissionsfield to select the group or groups that will have access to the chart.
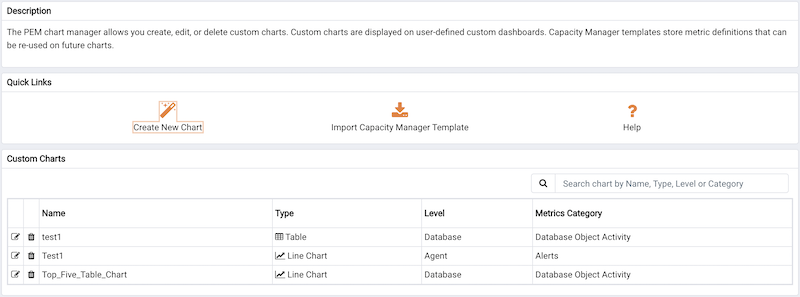
When you’ve finished defining the chart, click Finish to save your edits and add your chart to the list on the Manage Charts tab.
Importing a Capacity Manager Template
Click the Import Capacity Manager Template icon in the Quick Links section of the Manage Charts tab to open the Create Chart dialog, and use a Capacity Manager template as a starting point for a chart or table.
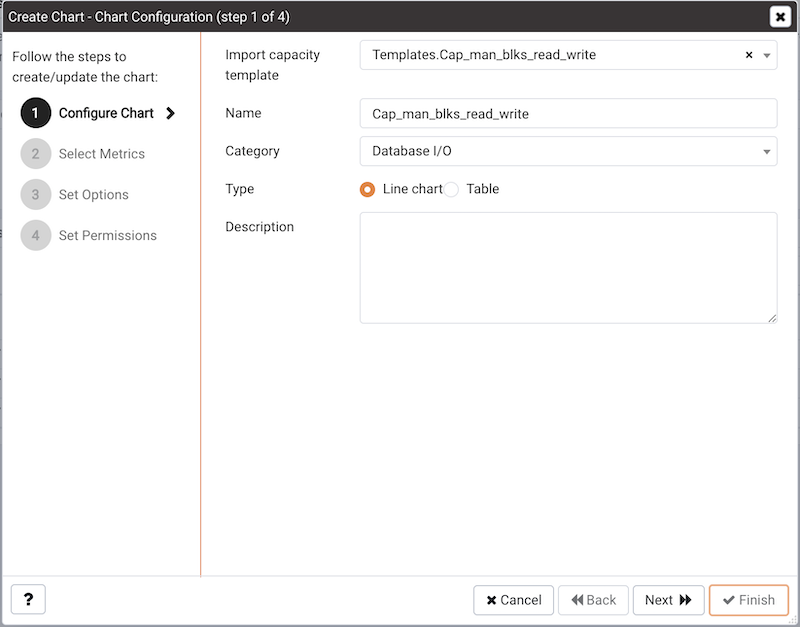
When the Create Chart dialog opens, provide information about the custom chart:
- Use the drop-down listbox in the
Import capacity templatefield to select the name of the template on which the chart will be based. - Specify the name of the chart in the
Namefield. - Use the drop-down listbox in the
Categoryfield to specify the category in which this chart will be displayed. When adding a custom chart to a custom dashboard, the chart will be displayed for selection in the Category specified. - Use the radio buttons in the
Typefield to specify if the chart will be aLine chartor aTable. - Provide a description of the chart in the
Descriptionfield. The description will be displayed to the user viewing the chart (on a custom dashboard) when they click the information icon.
Click Next to continue to the Select Metrics dialog.
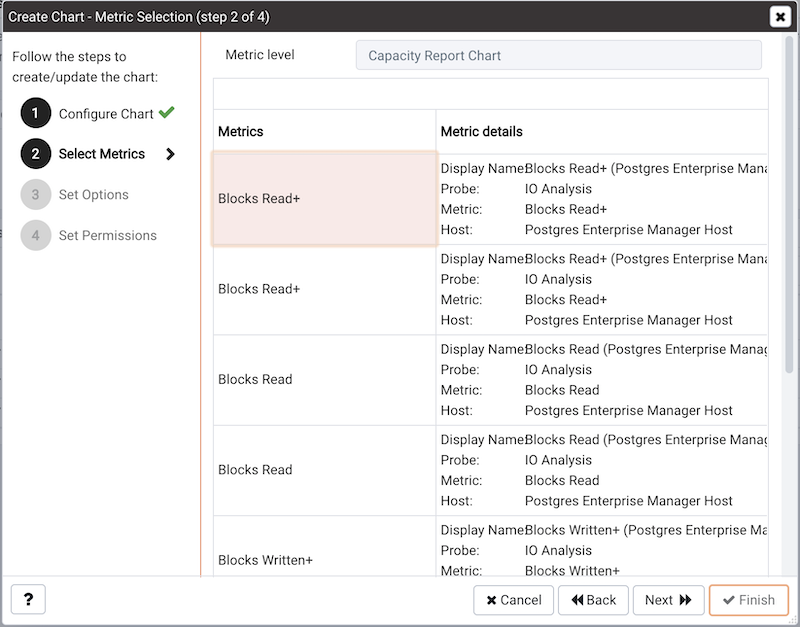
The Select Metrics window allows you to review the metrics specified by the selected template. The bottom panel of the chart editor displays the metrics that will be included in the chart. The metrics included in the chart are not modifiable via the chart editor; to modify the metrics, you must use the Capacity Manager utility to update the template.
When you’ve reviewed the metrics, click Next to continue to the Set Options dialog.
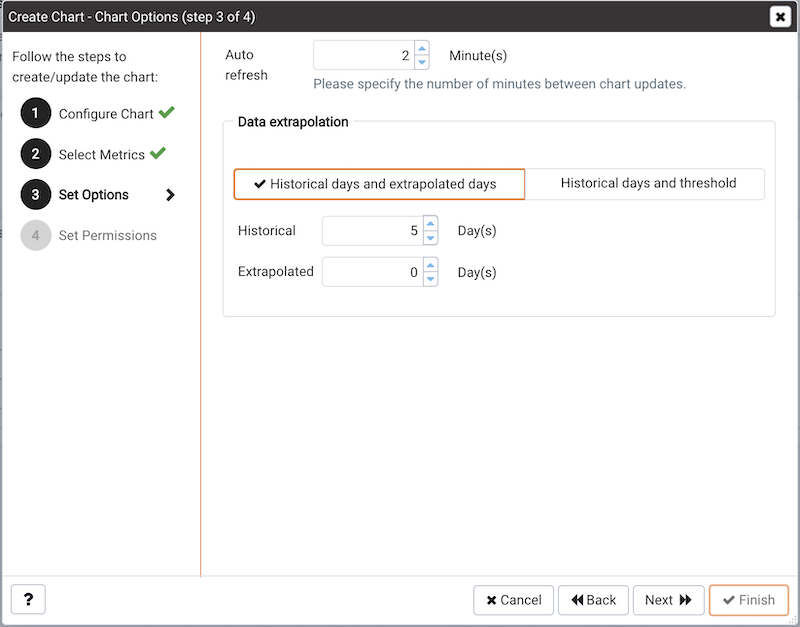
Use the fields on the Set Options window to specify display options for your chart:
- Use the
Auto Refreshfield to specify the number of minutes between chart updates - choose a value from 1 to 120. The default auto refresh rate is 2 minutes.
Use the fields in the Data extrapolation box to specify the time period covered by the chart. You can either:
- click the
Historical days and extrapolated dayslabel and provide:- the number of days of historical data that should be charted in the
Historicalfield. - the number of projected days that should be charted in the
Extrapolatedfield.
- the number of days of historical data that should be charted in the
- or, click the Historical days and threshold label and provide:
- the number of days of historical data that should be charted in the
Historicalfield - the
thresholdvalue at which the chart will end.
- the number of days of historical data that should be charted in the
When you’ve completed the Set Options window, click Next to continue.
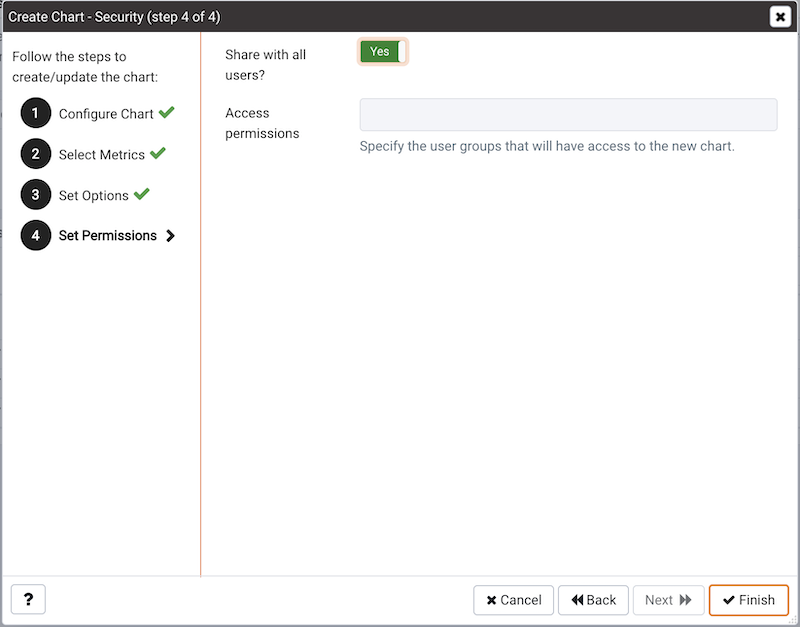
Use the fields on the Set Permissions window to specify display options for your chart:
- Set the
Share with all sliderto Yes to indicate that the chart will be available to all authorized users, or No to restrict access to the users or groups specified in the Access permissions field. - Use the
Access permissionsfield to select the group or groups that will have access to the chart.
When you’ve finished defining the chart, click Finish to save your edits and add your chart to the list on the Manage Charts tab.
Probes
A probe is a scheduled task that retrieves information about the database objects that are being monitored by the PEM agent. PEM uses the collected information to build the graphs displayed on each homepage. The Manage Probes tab (accessed via the Management menu) allows you to modify the data collection schedule and the length of time that PEM will retain information returned by a specific probe.
System Probes
Unless otherwise noted, Postgres Enterprise Manager enables the probes listed in the table below:
| Probe Name | Information Monitored by Probe | Level |
|---|---|---|
| Background Writer Statistics | This probe monitors information about the background writer. The information includes: The number of timed checkpoints The number of requested checkpoints The number of buffers written (by checkpoint) The number of buffers written (by background writer) The number of background writer cycles The number of background buffers written The number of buffers allocated |
Server |
| Blocked Session Information | This probe provides information about blocked sessions. | Server |
| CPU Usage | This probe monitors CPU Usage information. | Agent |
| Data and Log File Analysis | This probe monitors information about log files. The information includes: The name of the log file The directory in which the log file resides |
Server |
| Database Frozen XID | This probe monitors the frozen XID of each database. | Server |
| Database Size | This probe monitors information about the size of the monitored databases.The information includes: The time the information was gathered The database name The database size (in MB’s). |
Server |
| Database Statistics | This probe monitors database statistics. The information includes: The number of backends The number of transactions committed The number of transactions rolled back The number of blocks read The number of blocks hit The number of rows returned The number of rows fetched The number of rows inserted The number of rows updated The number of rows deleted |
Server |
| Disk Busy Info | This probe monitors information about disk activity. Note: This probe is not supported on Mac OS X, Solaris or HP-UX |
Agent |
| Disk Space | This probe monitors information about disk space usage. The information includes: The amount of disk space used The amount of disk space available |
Agent |
| EDB Audit Configuration | This probe monitors the audit logging configuration of EDB Postgres Advanced Server. | Server |
| Failover Manager Cluster Info | This probe monitors a Failover Manager cluster, returning information about the cluster. This probe is disabled unless a cluster name and path of the Failover Manager binary is provided on the Server Properties dialog. | Server |
| Failover Manager Node Status | This probe monitors a Failover Manager cluster, returning detailed about each node within the cluster. This probe is disabled unless a cluster name and path of the Failover Manager binary is provided on the Server Properties dialog. | Server |
| Function Statistics | This probe monitors a database, retrieving information about functions. The information includes: Function names Argument types Return values |
Database |
| Index Size | This probe monitors a database, retrieving information about indexes. The information includes: The name of the index The time the data was gathered The size of the index (in MB’s) |
Database |
| Index Statistics | This probe monitors index statistics. The information includes: The number of index scans The number of rows read The number of rows fetched The number of blocks read The number of blocks hit |
Database |
| Installed Packages | This probe monitors the packages that are currently installed. The information gathered includes: The name of the installed package The version of the installed package The date and time that the probe executed |
Agent |
| IO Analysis | This probe monitors disk I/O information in. The information includes: The number of blocks read The number of blocks written The date and time that the probe executed Note: This probe is not supported on Mac OS X |
Agent |
| Load Average | This probe monitors CPU load averages. The information includes: The 1-minute load average The 5-minute load average The 15-minute load average Note: This probe is not supported on Windows |
Agent |
| Lock Information | This probe monitors lock information. The information includes: The database name The lock type The lock mode The process holding the lock |
Server |
| Memory Usage | This probe monitors information about system memory usage.The information includes: Total RAM in MB Free RAM in MB Total swap memory in MB Free swap memory in MB Shared system memory in MB(It is used by tuning wizard to tune the memory parameters for the database server) - On non-windows system, it is shmmax value and read from /proc/sys/kernel/shmmax.- On windows, it is same as total memory. |
Agent |
| Network Statistics | This probe monitors network statistics. The information includes: The interface IP address The number of packets sent The number of packets received The number of bytes sent The number of bytes received The link speed (in MB/second) |
Agent |
| Number of Prepared Transactions | This probe stores the number of prepared transactions. | Server |
| Number of WAL Files | This probe monitors the number of WAL files. | Server |
| Object Catalog: Database | This probe monitors a list of databases and their properties The information includes: The database name The database encoding type If the database allows user connections or system connections |
Server |
| Object Catalog: Foreign Key | This probe monitors a list of foreign keys and their properties. The information includes: The name of the table that contains the foreign key The name of the table that the foreign key references The name of the database in which the table resides The name of the schema in which the table resides |
Schema |
| Object Catalog: Function | This probe monitors a list of functions and their properties. The information includes: The name of the function The name of the schema in which the function resides The name of the database in which the function resides |
Schema |
| Object Catalog: Index | This probe monitors a list of indexes and their properties. The information includes: The name of the index The name of the table that the index is associated with The name of the database in which the indexed table resides |
Schema |
| Object Catalog: Schema | This probe monitors a list of schemas and their associated databases and servers. | Database |
| Object Catalog: Sequence | This probe monitors a list of sequences and their properties. | Schema |
| Object Catalog: Table | This probe monitors a list of table information. The information includes: The table name The name of the schema in which the table resides The name of the database in which the schema resides A Boolean indicator that indicates if the table has a primary key |
Schema |
| Object Catalog: Tablespace | This probe monitors a list of tablespaces. | Server |
| Operating System Information | This probe monitors the operating system details and boot time. | Agent |
| Package Catalog | This probe monitors the packages that are currently available for installation. The information gathered includes: The package name The package version |
Agent |
| PG HBA Conf | This probe monitors authentication configuration information from the pg_hba.conf file. | Server |
| Server Information | This probe monitors server information. | Server |
| Session Information | This probe monitors session information. The information includes: The name of the session user The date and time that the session connected to the server The status of the session at the time that the information was gathered (idle, waiting, etc) The client address and port number |
Server |
| Settings | This probe monitors the values currently assigned to GUC variables. | Server |
| SQL Protect | This probe monitors a server, retrieving information about SQL injection attacks. | Server |
| Slony Replication | This probe monitors lag data for clusters replicated using Slony. | Database |
| Streaming Replication | This probe monitors a cluster that is using streaming replication, retrieving information about: The sent Xlog location (in bytes) The write Xlog location (in bytes) The flush Xlog location (in bytes) The replay Xlog location (in bytes) The Xlog lag (in segments) The Xlog lag (in pages) |
Server |
| Streaming Replication Lag Time | This probe monitors a cluster that is using streaming replication, retrieving lag information about: Replication lag time (in seconds) Current status of replication (running/paused) |
Server |
| Streaming Replication Database Conflicts | This probe monitors a database that is using streaming replication, retrieving information about any conflicts that arise. This includes information about queries that have been canceled due to: The # of drop tablespace conflicts The # of lock timeout conflicts The # of old snapshot conflicts The # of pinned buffer conflicts The # of deadlock conflicts |
Server |
| Table Bloat | This probe monitors information about the current table bloat. The information includes: The name of the table The name of the schema in which the table resides The estimated number of pages The estimated number of wasted pages The estimated number of bytes per row |
Database |
| Table Frozen XID | This probe monitors the frozen XID of each table. | Schema |
| Table Size | This probe monitors information about table size. The information includes: Table size (in MB’s) Total index size (in MB’s) Total table size, with indexes and TOAST (in MB’s) |
Database |
| Table Statistics | This probe monitors table statistics. The information includes: The number of sequential scans The number of sequential scan rows The number of index scans The number of index scan rows The number of rows inserted The number of rows updated The number of rows deleted The number of live rows The number of dead rows The last VACUUM The last auto-vacuum The last ANALYZE The last auto-analyze The number of pages estimated by ANALYZE The number of rows estimated by ANALYZE |
Database |
| Tablespace Size | This probe monitors a list of tablespaces and their sizes. | Server |
| User Information | This probe monitors a list of the current users. The stored information includes: The user name The user type (superuser vs. non-superuser) The server to which the user is connected |
Server |
| WAL Archive Status | This probe monitors the status of the WAL archive. The stored information includes: The # of WAL archives done The # of WAL archives pending The last archive time The # of WAL archives failed The time of the last failure |
Server |
| xDB Replication | This probe monitors lag data for clusters replicated using xDB replication. | Database |
BDR Probes
To monitor the BDR Group via BDR dashboards, the following probes must be enabled. All these probes are configured at server level.
The user with bdr_superuser will be able to view information from all the following probes.
All the following probes works with BDR Enterprise Edition.
| Probe Name | Information Monitored by Probe | bdr_monitor role required? |
Works with BDR SE? |
|---|---|---|---|
| BDR Conflict History Summary | This probe returns information about row conflicts per conflict type. The stored information inlcudes: The local time of the conflict The type of the conflict |
Yes | Yes |
| BDR Global Locks | This probe returns information about global locks in a BDR Group. The stored information includes: The name of the node where the global lock has originated The PID of the process holding the lock The type of lock (DDL or DML) The name of the locked relation(for DML Locks) or Keys(for advisory locks) The internal state of the lock acquistion process The list of backends waiting for the same global lock The time when the global lock acquire was initiated by origin node The time when the local node started trying to acquire the local lock The time acquire_stage last changed |
Yes | Yes |
| BDR Group Camo Details | This probe returns information about Camo’s in BDR Group. The stored information includes: The name of the node The node name for whom this node is partner The node name for whom this node is origin The connection status The readiness status The number of pending or unresolved camo transactions The lsn of last applied wal log The lsn of last received wal log |
No | No |
| BDR Group Replication Slot Details | This probe returns information about replication slots in BDR Group. The stored information includes: The name of the BDR Group The name of the origin node The name of the target node The slot name on the origin node used by this subscription The active status The state of the replication (catchup,streaming,disconnected,..) The approximate lag time for reported write The approximate lag time for reported flush The approximate lag time for reported replay The bytes difference between sent_lsn and current WAL write position The bytes difference between write_lsn and current WAL write position The bytes difference between flush_lsn and current WAL write position |
No | Yes |
| BDR Group Subscription Summary | This probe returns information about the summary of Subscriptions in the BDR Group. The stored information includes: The name of the origin of the subscription The name of the target of the subscription The timestamp of the last replayed transaction The lag between now and time of last replayed transaction |
No | Yes |
| BDR Monitor Group Raft | This probe returns the status and message of a cluster-wide raft check. | Yes | Yes |
| BDR Group Raft Details | This probe returns the information about raft consensus status from all the nodes in BDR Group. The stored information includes: The name of the node The raft worker state on the node The node id of the RAFT_LEADER The raft election internal id The raft snapshot internal id |
Yes | Yes |
| BDR Monitor Group Versions | This prove returns the status and message of cluster-wide version check. | Yes | Yes |
| BDR Group Versions Details | This probe returns the information about version details of the installed postgres, pglogical, bdr, and bdr edition for each node in the BDR Group. The stored information includes: The name of the node The installed postgres version on the node The installed pglogical version on the node The version of the BDR on the node The BDR edition (Standard/Enterprise) |
No | Yes |
| BDR Node Replication Rates | This probe returns information about outgoing replication activity from a given node. The stored information includes: The name of the target peer node The latest sent position The latest position reported as replayed The approximate lag time for reported replay The bytes difference between replay_lsn and current WAL write position on origin The human readable bytes difference between replay_lsn and current WAL write position Approximate time required for the peer node to catchup to all the changes that are yet to be applied |
Yes | No |
| BDR Node Slots | This probe returns information about the mapping of local BDR nodes to replication slots, their status, and replication progress. The stored information includes: The name of the slot The name of the target node The name of the BDR Group The database name on the target node The PID of the process attached to the slot The catalog XID needed by the slot The IP address of the client connection The latest sent position The latest position reported as replayed The approximate lag time for reported replay The Bytes difference between replay_lsn and current WAL write position The Human-readable bytes difference between replay_lsn and current WAL write position |
Yes | Yes |
| BDR Node Summary | This probe returns information about all the nodes in the BDR Group. The stored information includes: The name of the Node The name of the BDR group the node is part of The consistent state of the node in human readable form The state which the node is trying to reach (during join or promotion) The name of subscribed repsets |
Yes | Yes |
| BDR Workers | This probe returns information about workers in BDR node. The stored information includes: The PID of the worker process The worker query start timestamp The worker state change timestamp The worker wait event type The worker wait event The worker state The worker role name The worker commit timestamp The worker local timestamp The name of the origin node The receive LSN The receive commit LSN The last exact replay LSN The last exact flush LSN The last exact replay timestamp The worker query |
Yes | Yes |
| BDR Work Errors | This probe returns information aboutthe work errors in BDR node. The stored information includes: The process id of the worker causing the error The name of the BDR Group the node is part of The name of the origin node The name of the source node The name of the target node The name of the subscription The internal identifier of the role of this worker The name of the role of this worker The date and time of the error The age of the error The description of the error he context in which the error happened The remote relation id The subscription writer id The subscription writer name |
Yes | Yes |
Customizing Probes
A probe is a scheduled task that returns a set of performance metrics about a specific monitored object. A probe retrieves statistics from a monitored server, database, operating system or agent. You can use the Manage Probes tab to override the default configuration and customize the behavior of each probe.
To open the Manage Probes tab, select Manage Probes... from the Management menu. The Manage Probes tab opens in the PEM client.
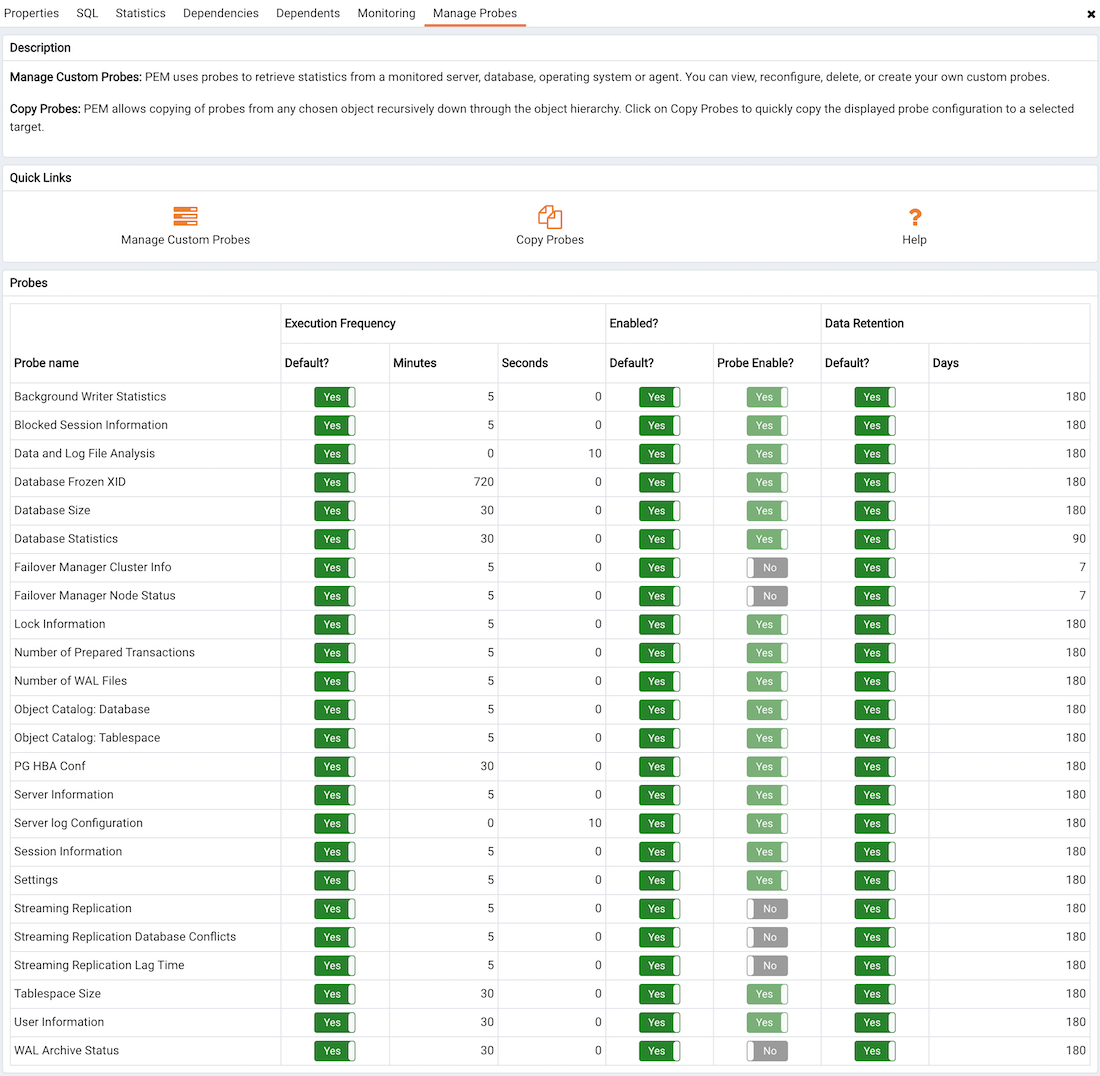
The Manage Probes tab provides a set of Quick Links that you can use to create and manage probes:
- Click the
Manage Custom Probesicon to open theCustom Probestab and create or modify a custom probe. - Click the
Copy Probesicon to open the Copy Probe dialog, and copy the probe configurations from the currently selected object to one or more monitored objects.
A probe monitors a unique set of metrics for each specific object type (server, database, database object, or agent); select the name of an object in the tree control to review the probes for that object.
To modify the properties associated with a probe, highlight the name of a probe, and customize the settings that are displayed in the Probes table:
- Move the
Defaultswitch in theExecution Frequencycolumns toNto enable the Minutes and Seconds selectors, and specify a non-default value for the length of time between executions of the probe. - Move the
Defaultswitch in theEnabled?column toNoto change the state of the probe, and indicate if the probe is active or not active.
Note If data from a disabled probe is used in a chart, the chart will display an information icon in the upper-left corner that allows you to enable the probe by clicking the provided link.
- Move the
Defaultswitch in theData Retentioncolumn toNoto enable the Day(s) field and specify the number of days that information gathered by the probe is stored on the PEM server.
The Manage Probes tab may display information about probes that cannot be modified from the current node. If a probe cannot be modified from the current dialog, the switches are disabled. Generally, a disabled probe can be modified from a node that is higher in the hierarchy of the PEM client tree control; select another object in the tree control to modify which probes are displayed or enabled in the Manage Probes tab.
Creating a Custom Probe
You can use the PEM Custom Probes tab to create a new probe or modify an existing user-defined probe. To open the Custom Probes tab, select the Manage Custom Probes... icon from the Manage Probes tab.
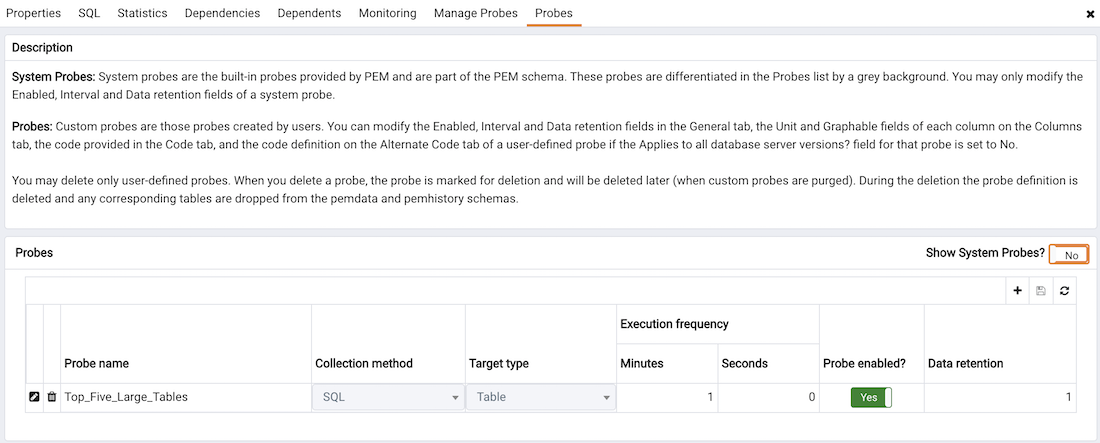
Use the Show System Probes? switch to display or conceal the system probes on the Custom Probes tab.
You can use the Custom Probes tab to create a new probe or modify an existing probe. To create a new probe, click the Add icon in the upper-right corner of the tab; provide a name for the new probe in the Probe Name column. Then, select the Edit icon (located to the left of the probe name) to review or add the probe definition.
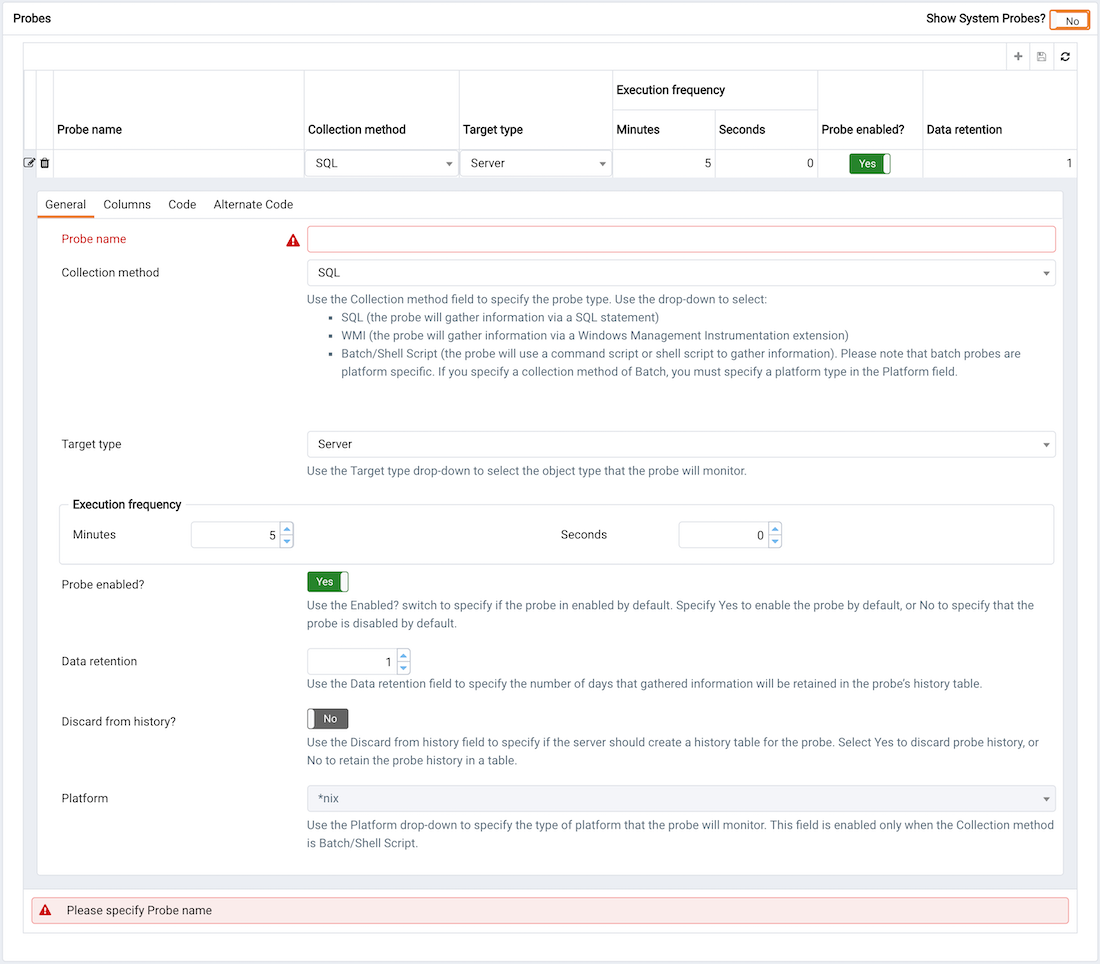
Use the fields on the General tab to modify the definition of an existing probe or to specify the properties of a new probe:
Use the
Probe Namefield to provide a name for a new probe.Use the
Collection methodfield to specify the probe type. Use the drop-down listbox to select:- SQL - the probe will gather information via a SQL statement.
- WMI - the probe will gather information via a Windows Management Instrumentation extension.
- Batch - the probe will use a command-script or shell-script to gather information.
Before creating a batch probe on a Linux system, you must modify the
agent.cfgfile, setting theallow_batch_probesparameter equal totrue, and restart the PEM agent. Theagent.cfgfile is located in one of the following directories:- If you have installed PEM using graphical installer:
/opt/edb/pem/agent/etc/agent.cfg - If you have installed PEM using RPM:
/usr/edb/pem/agent/etc/agent.cfg
On 64-bit Windows systems, agent settings are stored in the registry. Before creating a batch probe, modify the registry entry for the
AllowBatchProbesregistry entry and restart the PEM agent. PEM registry entries are located inHKEY_LOCAL_MACHINE\Software\Wow6432Node\EnterpriseDB\PEM\agent.Please note that batch probes are platform-specific. If you specify a collection method of Batch, you must specify a platform type in the Platform field.
To invoke a script on a Linux system, you must modify the entry for
batch_script_userparameter ofagent.cfgfile and specify the user that should be used to run the script. You can either specify a non-root user or root for this parameter. If you do not specify a user, or the specified user does not exist, then the script will not be executed. Restart the agent after modifying the file.To invoke a script on a Windows system, set the registry entry for
AllowBatchJobStepsto true and restart the PEM agent.Use the
Target Typedrop-down listbox to select the object type that the probe will monitor. Target type is disabled if Collection method is WMI.Use the
MinutesandSecondsselectors to specify how often the probe will collect data.Use the
Probe Enable?switch to specify if the probe in enabled by default. Specify Yes to enable the probe by default, or No to specify that the probe is disabled by default.
Note If data from a disabled probe is used in a chart, the chart will display an information icon in the upper-left corner that allows you to enable the probe by clicking the provided link.
- Use the
Data Retentionfield to specify the number of days that gathered information will be retained in the probe’s history table. - Use the switch next to
Discard from historyto specify if the server should create a history table for the probe. SelectYesto discard probe history, orNoto retain the probe history in a table. - Use the
Platformdrop-down listbox to specify the type of platform that the probe will monitor. This field is enabled only when the Collection method is Batch.
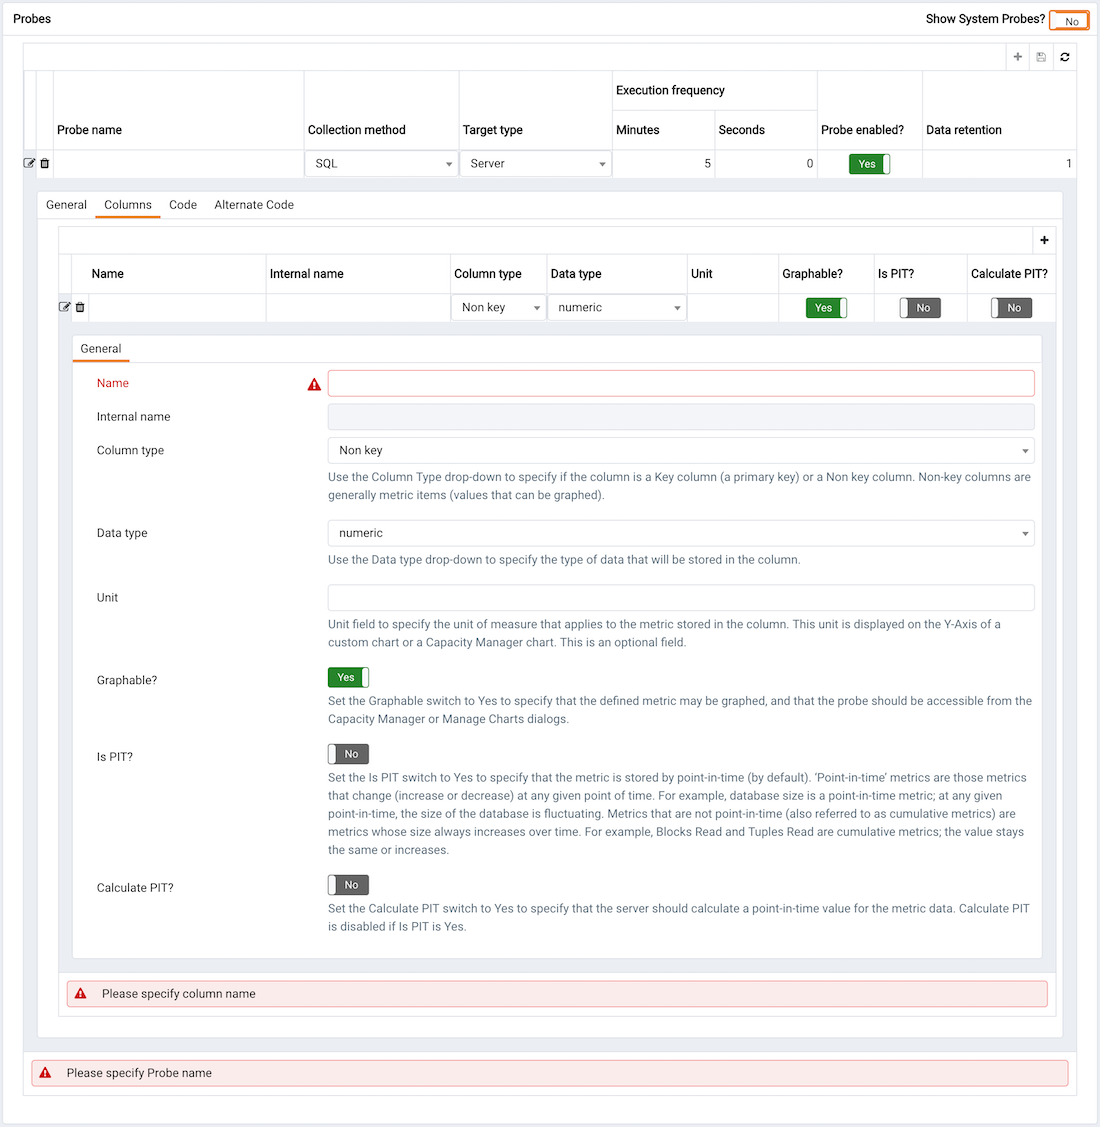
Use the Columns tab to define the columns in which the probe data will be stored. Navigate to the Columns tab, and click the Add button (in the upper-right corner) to define a new column. After a providing a column name in the Name field, click the Edit button (to the left of the new column name) to provide information about the column:
Provide a descriptive name for the column in the
Namefield.The
Internal Namefield is not enabled for user-defined probes.Use the
Column Typedrop-down listbox to specify if the column is a Key column (a primary key) or a Non key column. Non-key columns are generally metric items (values that can be graphed).Use the
Data Typedrop-down listbox to specify the type of data that will be stored in the column.Use the
Unitfield to specify the unit of measure that applies to the metric stored in the column. This unit is displayed on the Y-Axis of a custom chart or a Capacity Manager chart. This is an optional field.Use the
Graphableswitch to specify if the defined metric may be graphed, and that the probe should be accessible from the Capacity Manager or Manage Charts dialogs.Use the
Is PITswitch to specify if the metric should be stored by point-in-time.‘Point-in-time’ metrics are those metrics that change (increase or decrease) at any given point of time. For example, database size is a point-in-time metric; at any given point-in-time, the size of the database is fluctuating. Metrics that are not point-in-time (also referred to as cumulative metrics) are metrics whose size always increases over time. For example, Blocks Read and Tuples Read are cumulative metrics; the value stays the same or increases.
Use the
Calculate PITswitch to specify that the server should calculate a point-in-time value for the metric data.Calculate PITis disabled ifIs PITisYes.PEM allows you to store point-in time-values of cumulative metrics as well. PEM subtracts the last collected value of a cumulative metric from the current value, and stores the difference as a point-in-time value.
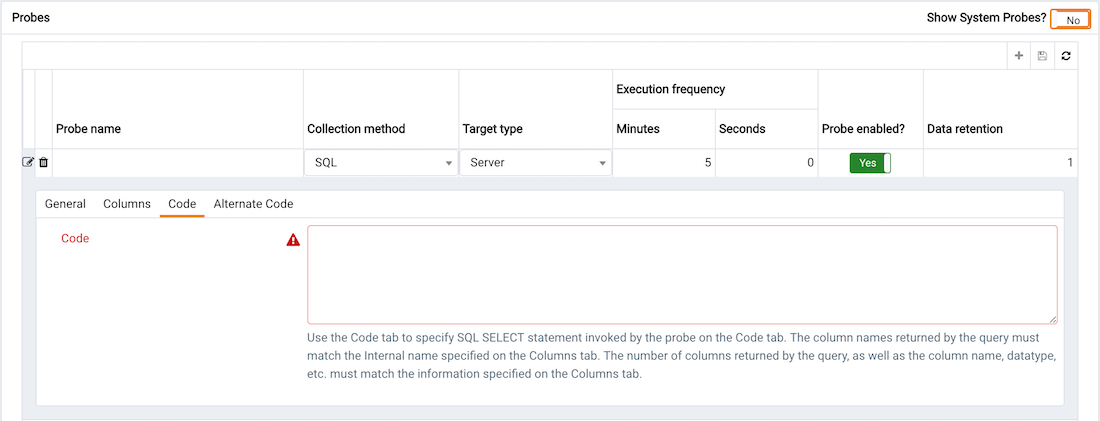
Use the Code tab to specify the default code that will be executed by the probe:
If the probe is a SQL probe, you must specify the
SQL SELECTstatement invoked by the probe on theCodetab. The column names returned by the query must match the Internal Name specified on theColumnstab. The number of columns returned by the query, as well as the column name, data type, etc. must match the information specified on theColumnstab.If the probe is a batch probe, you must specify the shell or .bat script that will be invoked when the probe runs. The output of the script should be as follows:
The first line must contain the names of the columns provided on the
Columnstab. Each column name should be separated by a tab (t) character. From the second line onwards, each line should contain the data for each column, separated by a tab character.If a specified column is defined as key column, you should ensure that the script does not produce duplicate data for that column across lines of output. The number of columns specified in the
Columnstab and their names, data type, etc. should match with the output of the script output.If the probe is a WMI probe, you must specify the WMI query as a
SELECT WMIquery. The column name referenced in theSELECTstatement should be same as the name of the corresponding column specified on theColumntab. The column names returned by the query must match theInternal Namespecified on theColumntab. The number of columns returned by the query, as well as the column name, data type, etc. must match the information specified on the Columns tab.
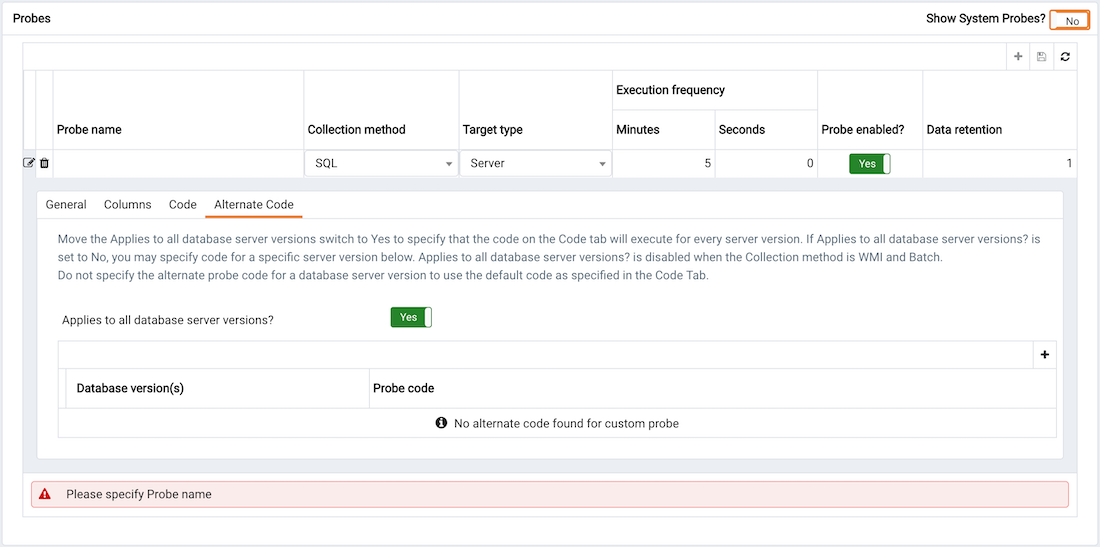
Use the Alternate Code tab to provide code that will be invoked if the probe fires on a specific version of the server. To provide version-specific code, move the Applies to any server version? switch to No, and click the Add button. Then, use the Database Version(s) drop-down listbox to select a version, and click the Edit button (to the left of the version name) to provide the code that will execute when the probe fires.
If you select a database version, and leave the Probe Code column blank, PEM will invoke the code specified on the Code tab when the probe executes on a server that matches that version.
When you’ve finished defining the probe, click the Save icon (in the corner of the Custom Probes tab) to save the definition, and make the probe data available for use on custom charts and graphs.
Deleting a Probe
Use the Delete icon (located to the left of a probe name) to delete a user-defined probe. When you delete a probe, the probe is marked for deletion and will be deleted later (when custom probes are purged). During the deletion, the probe definition is deleted and any corresponding tables are dropped from the pemdata and pemhistory schemas.
System probes are the built-in probes provided by PEM, and are part of the PEM schema. If you attempt to delete a system probe, the PEM client will display a notice, informing you that the probe cannot be deleted.
Copying a Probe
You can use the Copy Probe Configuration... dialog to copy probe definitions from one monitored object to one or more monitored objects of the same type. To open the Copy Probe Configuration... dialog, highlight the object from which you are copying probes in the PEM client tree control, and select Manage Probes from the Management menu. When the Manage Probes tab opens, click on Copy Probe to open the Copy Probe Configuration dialog:
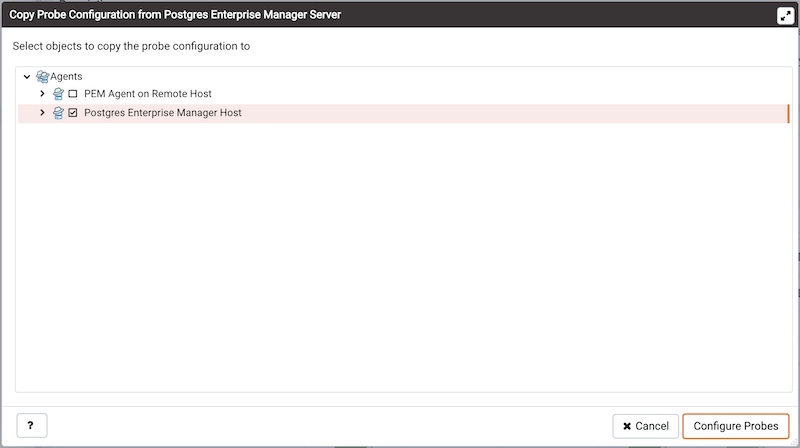
The dialog will copy the probe definitions from the object through which the Copy Probe Configuration dialog was opened, to the location(s) selected on the tree control.
Note that if you specify a parent node in the Copy Probe Configuration tree control, PEM will copy the probe configurations to each object (of the same type) that resides under that node in the tree control. For example, to copy the probe definitions from one schema to all schemas that reside within a database, select only the parent database of the target schemas. Please note that a red warning symbol is displayed to the left of the name of a listed target object if that object is the source of the probe that is being copied.
When you have selected the target object or objects, click the Configure Probes button to copy the probe definitions to the location selected on the dialog.
Alerting
PEM continually monitors registered servers and compares performance metrics against pre-defined and user-specified thresholds that constitute good or acceptable performance for each statistic. Any deviation from an acceptable threshold value triggers an alert. An alert is a system-defined or user-defined set of conditions that PEM compares to the system statistics. Alerts call your attention to conditions on registered servers that require your attention.
Viewing the Alerts via Global Dashboard
When your system statistics deviate from the boundaries specified for that statistic, the alert triggers, displaying a high (red), low (yellow), or medium (orange) severity warning in the left-most column of the Alert Status table on the Global Overview dashboard.
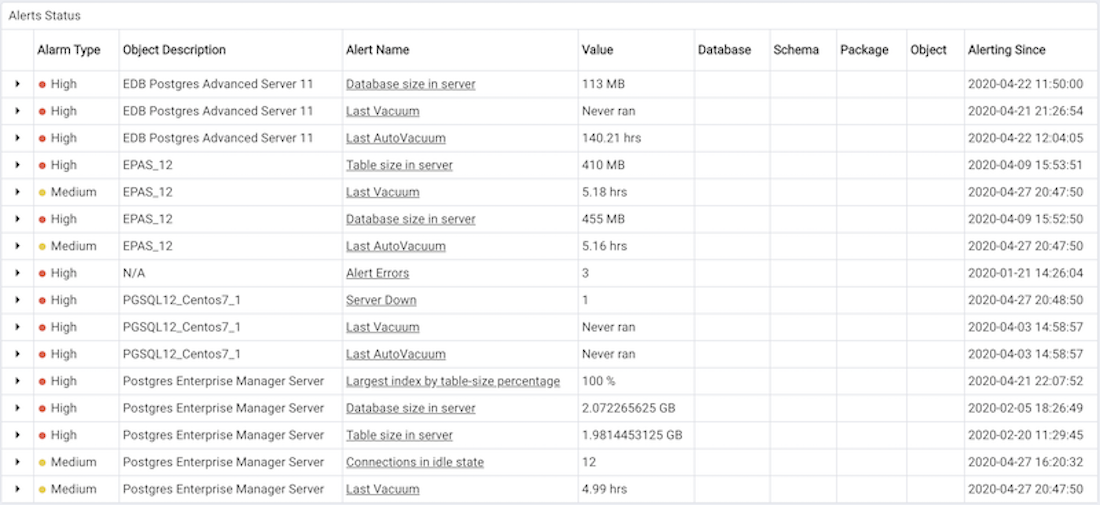
The PEM server includes a number of pre-defined alerts that are actively monitoring your servers. If the alert definition makes details available about the cause of the alert, you can click the down arrow to the right of the severity warning to access a dialog with detailed information about the condition that triggered the alert.
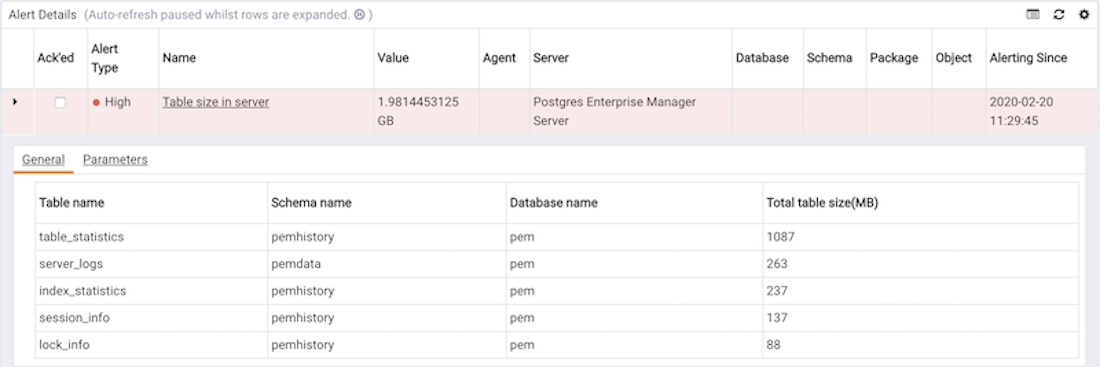
PEM also provides an interface that allows you to create customized alerts. Each alert uses metrics defined on an alert template. An alert template defines how the server will evaluate the statistics for a resource or metric. The PEM server includes a number of pre-defined alert templates, or you can create custom alert templates.
Viewing the Alerts via Alerts Dashboard
Use the Dashboards menu (on the Monitoring tab) to access the Alerts dashboard. The Alerts dashboard displays a summary of the active alerts and the status of each alert:
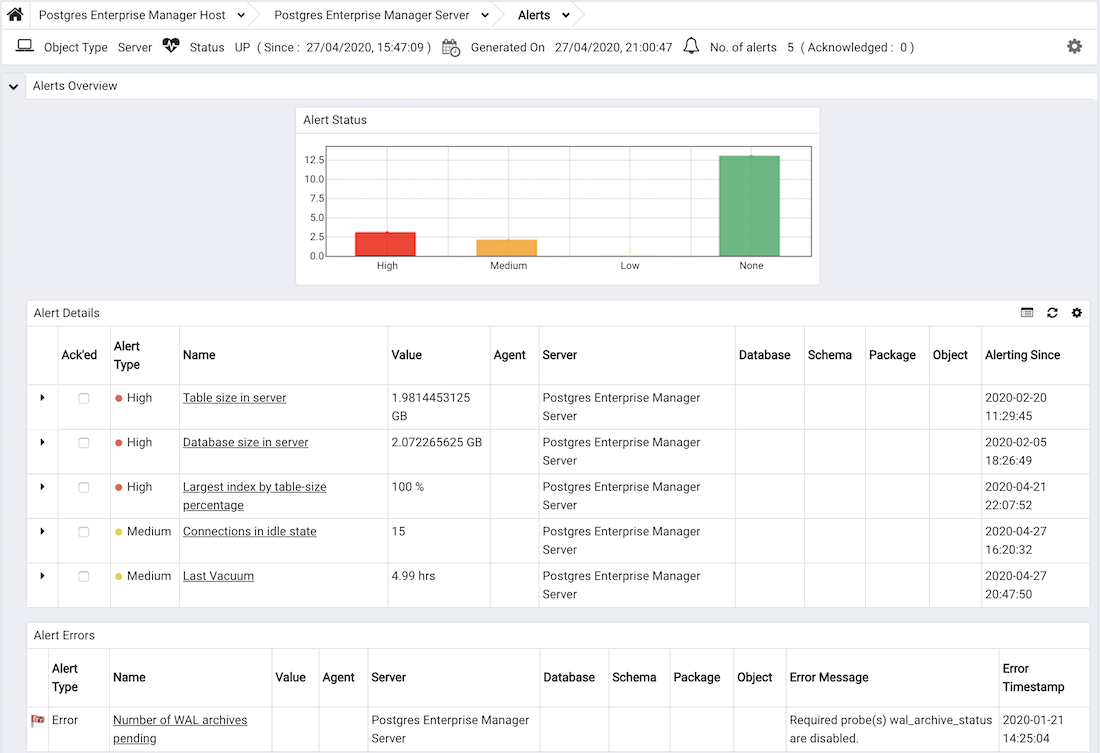
The Alerts Dashboard header displays the date and time that the dashboard was last updated, and the number of current alerts.
The Alerts Overview section displays a graphic representation of the active alerts, as well as a count of the current high, low and medium alerts. The vertical bar on the left of the graph provides the count of the alerts displayed in each column. Hover over a bar to display the alert count for the selected alert severity in the upper-right hand corner of the graph.
The Alert Details table provides a list of the alerts that are currently triggered. The entries are prioritized from high-severity to lower-severity; each entry includes information that will allow you to identify the alert and recognize the condition that triggered the alert. Click the name of an alert to review detailed information about the alert definition.
The Alert Errors table displays configuration-related errors (eg. accidentally disabling a required probe, or improperly configuring an alert parameter). You can use the information provided in the Error Message column to identify and resolve the conflict that is causing the error.
Customizing the Alerts Dashboard
You can customize tables and charts that appear on the Alerts dashboard. To customize a table or chart, click the Settings icon located in the upper-right corner.
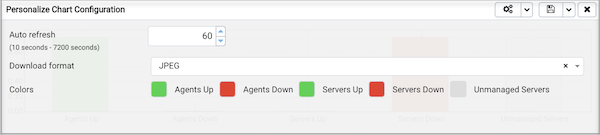
Use fields on the Personalize chart configuration dialog to provide your display preferences:
- Use the
Auto Refreshfield to specify the number of seconds between updates of the data displayed in the table or chart. - If applicable, use the
Download asfield to indicate if you would like a chart to be downloaded as a JPEG image or a PNG image. - If applicable, use the
Colours selectorsto specify the display colors that will be used on a chart. - If applicable, set the
Show Acknowledged Alertsswitch to Yes indicate that you would like the table to display alerts that you have acknowledged with a checkbox in the Ack’ed column. Set the field to No to indicate that the table should hide any acknowledged alerts. The switch acts as a toggle; acknowledged alerts are not purged from the table content until the time specified in the alert definition passes.
To save your customizations, click the Save icon (a check mark) in the upper-right corner; to delete any previous changes and revert to the default values, click the Delete icon. The Save and Delete drop-down menus allow you to specify if your preferences should be applied to All Dashboards, or to a selected server or database.
Managing Alerts
Use the PEM Client’s Manage Alerts tab to define, copy, or manage alerts. To open the Manage Alerts tab, select Manage Alerts from the Management menu.
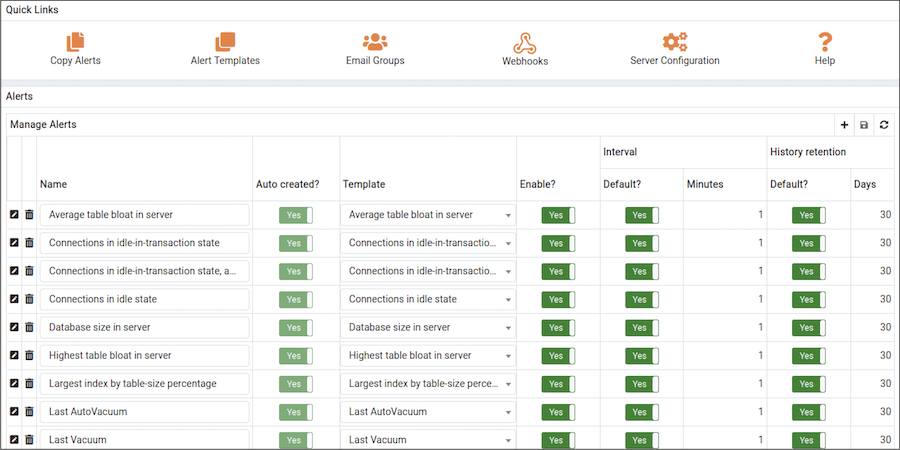
Use the Quick Links toolbar to open dialogs and tabs that will assist you when managing alerts:
- Click
Copy Alertsto open theCopy Alert Configurationdialog and copy an alert definition. - Click
Alert Templatesto open theAlert Templatetab, and modify or create an alert template. - Click
Email Groupsto open theEmail Groupstab, and modify or create an email group. - Click
Webhooksto open theWebhookstab, and create or manage the webhooks endpoints. - Click
Server Configurationsto open theServer Configurationdialog and review or modify server configuration settings. - Click
Helpto open the PEM online help in a new tab of the PEM web interface.
Use the table in the Alerts section of the Manage Alerts tab to create new alerts or manage existing alerts.
Alert Templates
An alert template is a prototype that defines the properties of an alert. An alert instructs the server to compare the current state of the monitored object to a threshold (specified in the alert template) to determine if a situation exists that requires administrative attention.
You can use the Alert Templates tab to define a custom alert template or view the definitions of existing alert templates. To open the Alert Templates tab, select the Manage Alerts... menu option from the Management menu. When the Manage Alerts tab opens, select Alert Templates from the Quick Links toolbar.
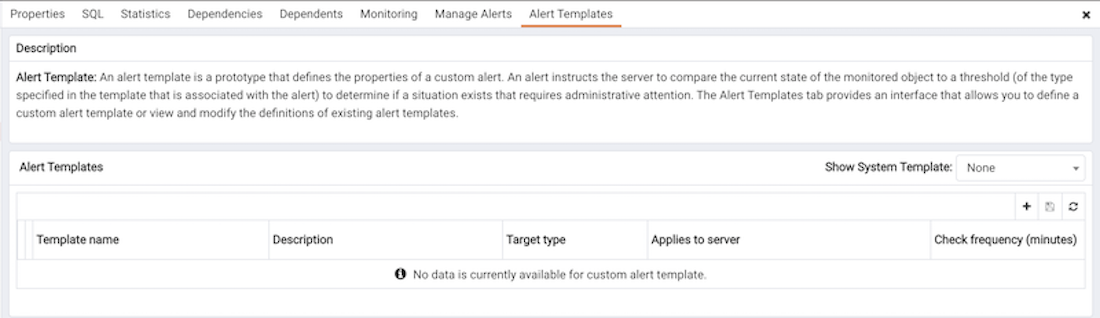
Use the Show System Template drop-down listbox to filter the alert templates that are displayed in the Alert Templates table. Use the listbox to select a level of the PEM hierarchy to view all of the templates for the selected level.
Defining a New Alert Template
To define a new alert template, use the Show System Template drop-down listbox to select None, and click the Add icon (+) located in the upper-right corner of the alert template table. The alert template editor opens.
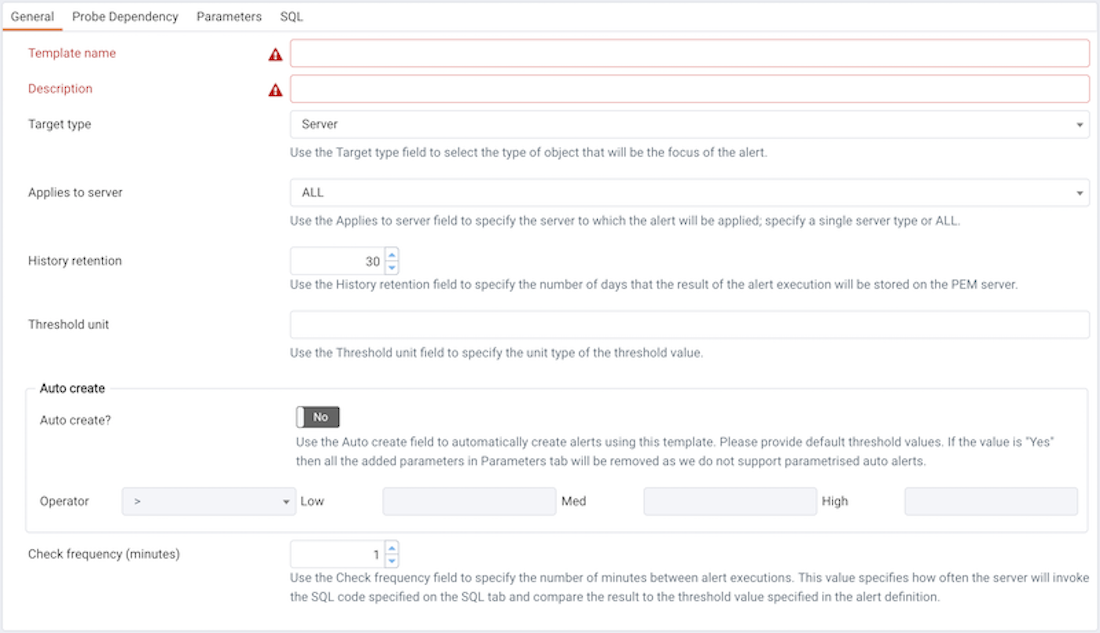
Use fields on the General tab to specify general information about the template:
Use the
Template namefield to specify a name for the new alert template.Use the
Descriptionfield to provide a description of the alert template.Use the
Target typedrop-down listbox to select the type of object that will be the focus of the alert.Use the
Applies to serverdrop-down listbox to specify the server type (EDB Postgres Advanced Server or PostgreSQL) to which the alert will be applied; you can specify a single server type, or ALL.Use the
History retentionfield to specify the number of days that the result of the alert execution will be stored on the PEM server.Use the
Threshold unitfield to specify the unit type of the threshold value.Use fields in the
Auto createbox to indicate if PEM should use the template to generate an automatic alert. If enabled, PEM will automatically create an alert when a new server or agent (as specified by the Target type drop-down listbox) is added, and delete that alert when the target object is dropped.- Move the
Auto create?slider toYesto indicate that PEM should automatically create alerts based on the template. If you modify an existing alert template, changing the Auto create? slider from No to Yes, PEM will create alerts on the existing agents and servers. Please note that if you change the slider from Yes to No, the default threshold values in existing alerts will be erased, and cannot be recovered. - Use the
Operatordrop-down listbox to select the operator that PEM will use when evaluating the current system values.
Select a greater-than sign (>) to indicate that the alert should be triggered when the system values are greater than the values entered in the Threshold values fields.
Select a less-than sign (<) to indicate that the alert should be triggered when the system values are less than the values entered in the Threshold values fields.
- Move the
Use the threshold fields to specify the values that PEM will compare to the system values to determine if an alert should be raised. Please note that you must specify values for all three thresholds (Low, Medium, and High):
Enter a value that will trigger a low-severity alert in the
Lowfield.Enter a value that will trigger a medium-severity alert in the
Mediumfield.Enter a value that will trigger a high-severity alert in the
Highfield.Use the
Check frequencyfield to specify the default number of minutes between alert executions. This value specifies how often the server will invoke the SQL code specified in the definition and compare the result to the threshold value specified in the template.

Use the fields on the Probe Dependency tab to specify the names of probes referred to in the SQL query specified on the SQL tab:
- Use the
Probesdrop-down listbox to select from a list of the available probes; highlight a probe name, and click theAddbutton to add the probe to the list of probes used by the alert template. To remove a probe from the selected probes list, highlight the probe name, and click theDeleteicon.

Use fields on the
Parameterstab to define the parameters that will be used in the SQL code specified on theSQLtab. Click theAddicon (+) and:Use the
Namefield to specify the parameter name.Use the
Data typedrop-down listbox to specify the type of parameter.Use the
Unitfield to specify the type of unit specified by the parameter.Use the
Codefield on theSQLtab to provide the text of the SQL query that the server will invoke when executing the alert. The SQL query will provide the result against which the threshold value is compared; if the alert result deviates from the specified threshold value, an alert will be raised.
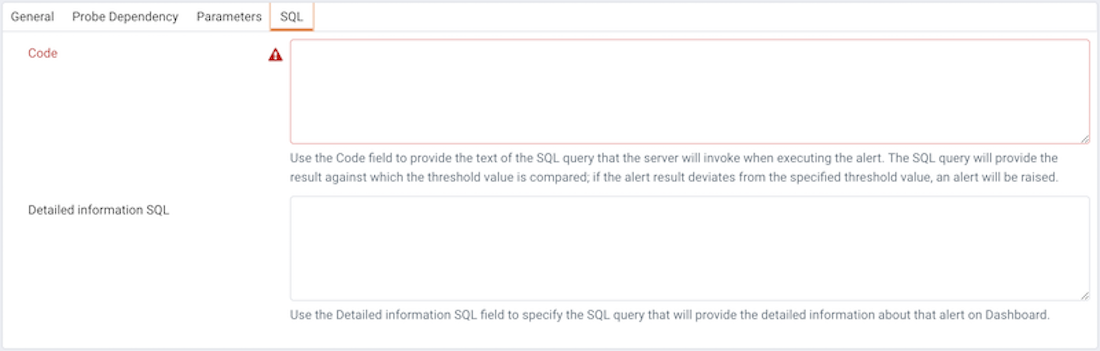
Within the query, parameters defined on the Parameters tab should be referenced sequentially by the variable param_x, where x indicates the position of the parameter definition within the parameter list. For example, param_1 refers to the first parameter in the parameter list, param_2 refers to the second parameter in the parameter list, and so on.
The query can also include the following pre-defined variables:
| Variable Description | Variable Name |
|---|---|
| agent identifier | ‘agentid′||serveridentifier|′{server_id}’ |
| database name | ‘databasename′||schemaname|′{schema_name}’ |
| Table | ‘objectname′||index|′{object_name}’ |
| sequence | ‘objectname′||functionname|′{object_name}’ |
- Use the
Detailed Information SQLfield to provide a SQL query that will be invoked if the alert is triggered. The result set of the query may be displayed as part of the detailed alert information on theAlertsdashboard orGlobal Overviewdashboard.
Note If the specified query is dependent on one or more probes from different levels within the PEM hierarchy (server, database, schema, etc.), and a probe becomes disabled, any resulting alerts will be displayed as follows:
- If the alert definition and the probe referenced by the query are from the same level within the PEM hierarchy, the server will display any alerts that reference the alert template on the
Alert Errortable of theGlobal Alertdashboard. - If the alert definition and the probe referenced by the query are from different levels of the PEM hierarchy, the server will display any triggered alerts that reference the alert template on the
Alert Detailstable of the hierarchy on which the alert was defined.
Click the Save icon to save the alert template definition and add the template name to the Alert Templates list. After saving a custom alert template, you can use the Alerting dialog to define an alert based on the template.
Modifying or Deleting an Alert Template
To view the definition of an existing template (including PEM pre-defined alert templates), use the Show System Template drop-down listbox to select the type of object monitored. When you select the object type, the Alert Templates table will display the currently defined alert templates that correspond with that object type.
Highlight a Template Name in the list, and click the Edit icon (at the left end of the row) to review the template definition.
Use the tabs on the Alert Templates dialog to view detailed information about the alert template:
- General information is displayed on the
Generaltab. - The names of probes that provide data for the template are listed on the
Probe Dependencytab. - The names of any parameters referred to in the SQL code are listed on the
Parameterstab. - The SQL code that defines the behavior of the alert is displayed on the
SQLtab.
To delete an alert template, highlight the template name in the alert templates table, and click the Delete icon. The alert history will persist for the length of time specified in the History Retention field in the template definition.
Audit Log Alerting
PEM provides alert templates that allow you to use the Alerting dialog to create an alert that will trigger when an ERROR or WARNING statement is written to a log file for a specific server or agent. To open the Alerting dialog, highlight the name of the server or agent in the PEM client Object browser tree control, and select Alerting... from the Management menu.
To create an alert that will notify you of ERROR or WARNING messages in the log file for a specific server, create an alert that uses one of the following alert templates:
Number of ERRORS in the logfile on server M in last X hours
Number of WARNINGS in the logfile on server M in last X hours
Number of ERRORS or WARNINGS in the logfile on server M in last X hours
To create an alert that will notify you of ERROR or WARNING messages for a specific agent, create an alert that uses one of the following alert templates:
Number of ERRORS in the logfile on agent M in last X hours
Number of WARNINGS in the logfile on agent M in last X hours
Number of ERRORS or WARNINGS in the logfile on agent M in last X hours
Please note that this functionality is supported only on Advanced Server.
Alerts
Use the PEM Client’s Manage Alerts tab to define, copy, or manage alerts. To open the Manage Alerts tab, select Manage Alerts from the Management menu.
Defining a New Alert
The Manage Alerts tab displays a table of alerts that are defined on the object currently selected in the PEM client tree control. You can use the Alerts table to modify an existing alert, or to create a new alert.
To open the alert editor and create a new alert, click the Add icon (+) in the upper-right corner of the table. The editor opens as shown below.
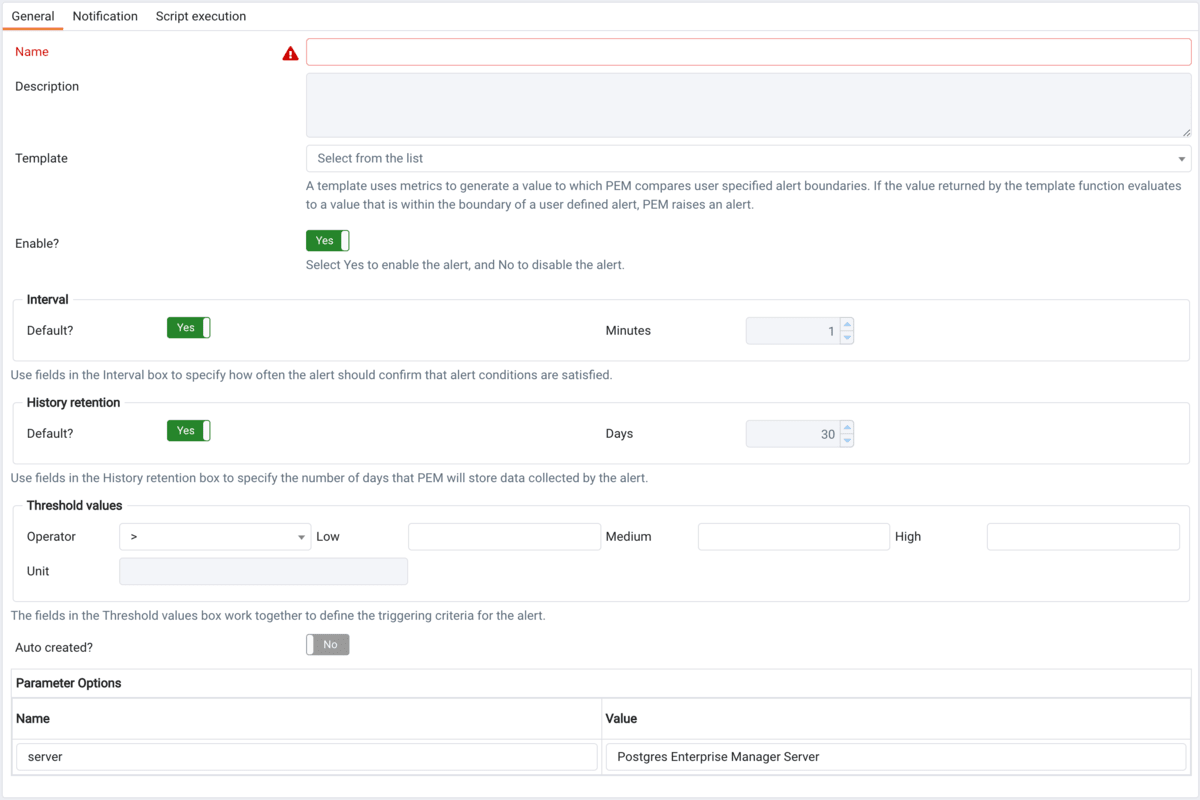
Use the fields on the General tab to provide information about the alert:
- Enter the name of the alert in the
Namefield. - Use the drop-down listbox in the
Templatefield to select a template for the alert. An alert template is a function that uses one (or more) metrics or parameters to generate a value to which PEM compares user-specified alert boundaries. If the value returned by the template function evaluates to a value that is within the boundary of a user-defined alert (as specified by the Operator and Threshold values fields), PEM raises an alert, adds a notice to the Alerts overview display, and performs any actions specified on the template. - Use the
Enable?switch to specify if the alert is enabled (Yes) or disabled (No). - Use the controls in the
Intervalbox to specify how often the alert should confirm if the alert conditions are satisfied. Use the Minutes selector to specify an interval value. Use the Default switch to set or reset the Minutes value to the default (recommended) value for the selected template. - Use controls in the
History retentionbox to specify the number of days that PEM will store data collected by the alert. Use theDaysselector to specify the number of days that the data will be stored. Use the Default switch to set or reset theDaysvalue to the default value (30 days). - Use controls in the
Threshold valuesbox to define the triggering criteria for the alert. When the value specified in the Threshold Values fields evaluates to greater-than or less-than the system value (as specified with the Operator), PEM will raise a Low, Medium or High level alert: - Use the
Operatordrop-down listbox to select the operator that PEM will use when evaluating the current system values:- Select a greater-than sign (>) to indicate that the alert should be triggered when the system values are greater than the values entered in the Threshold values fields.
- Select a less-than sign (<) to indicate that the alert should be triggered when the system values are less than the values entered in the Threshold values fields.
- Use the
thresholdfields to specify the values that PEM will compare to the system values to determine if an alert should be raised. Please note that you must specify values for all three thresholds (Low, Medium, and High):- Enter a value that will trigger a low-severity alert in the
Lowfield. - Enter a value that will trigger a medium-severity alert in the
Mediumfield. - Enter a value that will trigger a high-severity alert in the
Highfield.
- Enter a value that will trigger a low-severity alert in the
The Parameter Options table contains a list of parameters that are required by the selected template; the table displays both pre-defined parameters, and parameters for which you must specify a value. Please note that you must specify a value for any parameter that displays a prompt in the Value column.
PEM can send a notification or execute a script if an alert is triggered, or if an alert is cleared. Use the Notification tab to specify how PEM will behave if an alert is raised.
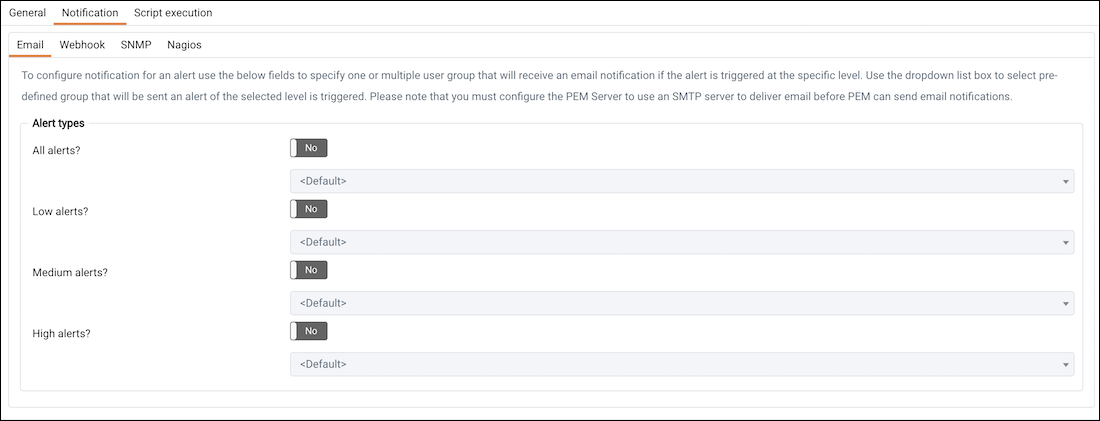
Use the fields in the Email notification box to specify the Email group that will receive an email notification if the alert is triggered at the specified level. Use the Email Groups tab to create an email group that contains the address of the user or users that will be notified when an alert is triggered. To access the Email Groups tab, click the Email Groups icon located in the Quick Links menu of the Manage Alerts tab.
- To instruct PEM to send an email when a specific alert level is reached, set the slider next to an alert level to Yes, and use the drop-down listbox to select the pre-defined user or group that will be notified.
Please note that you must configure the PEM Server to use an SMTP server to deliver email before PEM can send email notifications.
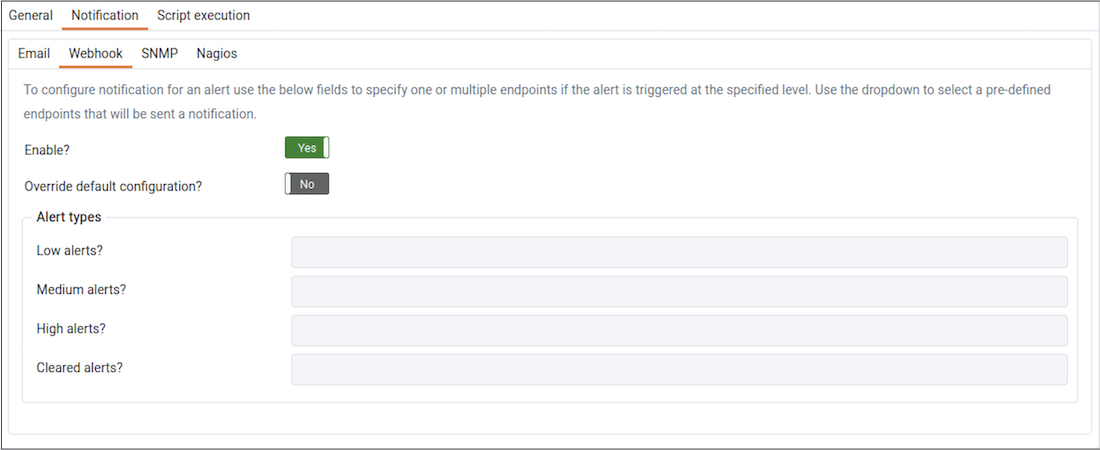
Use the Webhook notification box to specify one or multiple endpoints if the alert is triggered at the specified level. Use the webhooks tab to create a webhook endpoint that will receive the notifications when an alert is triggered. To access the Webhooks tab, click the Webhooks icon located in the Quick Links menu of the Manage Alerts tab.
- Set the
Enable?toYesto send the alert notifictions to the webhook endpoint. - Set the
Override default configuration?toYesto set the customized alert levels as per the requirement. Once it is set toYesall the alert levels are enabled to configure. - Use the dropdown to select a pre-defined endpoint that will be sent a notification for
Low alerts?,Medium alerts?,High alerts?andCleared alerts?.
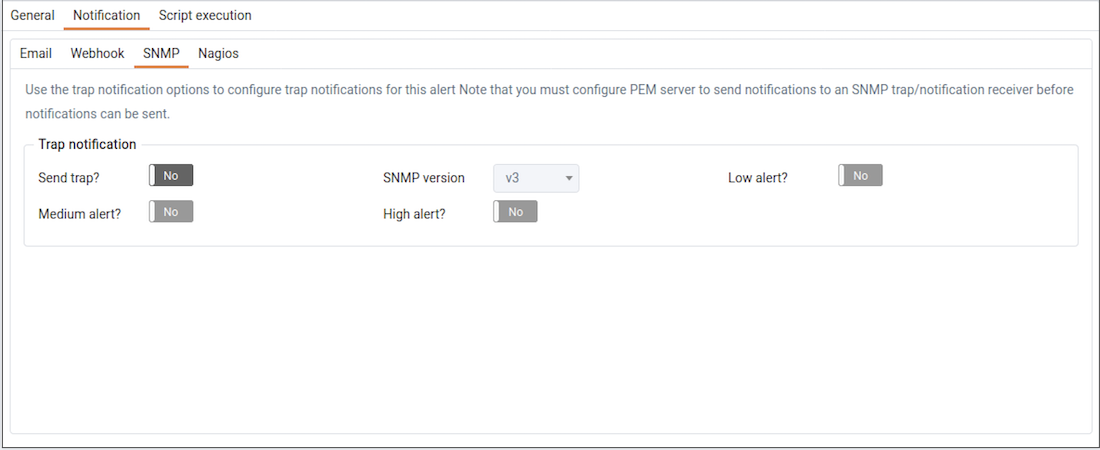
Use the Trap notification options to configure trap notifications for this alert:
- Set the
Send trapslider toYesto send SNMP trap notifications when the state of this alert changes. - Set the
SNMP Vertov1,v2, orv3to identify the SNMP version. - Use the
Low alert,Med alertandHigh alertsliders to select the level(s) of alert that will trigger the trap. For example, if you set the slider next to High alert to Yes, PEM will send a notification when an alert with a high severity level is triggered.
Please note that you must configure the PEM Server to send notifications to an SNMP trap/notification receiver before notifications can be sent. For sending SNMP v3 traps, pemAgent will use ‘User Security Model(USM)’ which is in charge of authenticating, encrypting, and decrypting SNMP packets.
Also note while sending SNMP v3 traps, agent will create snmp_boot_counter file. This file will get created in location mentioned by batch_script_dir parameter in agent.cfg, if this parameter is not configured or if directory is not accessible due to authentication restrictions then in operating systems temporary directory, if that is also not possible then in user’s home directory.
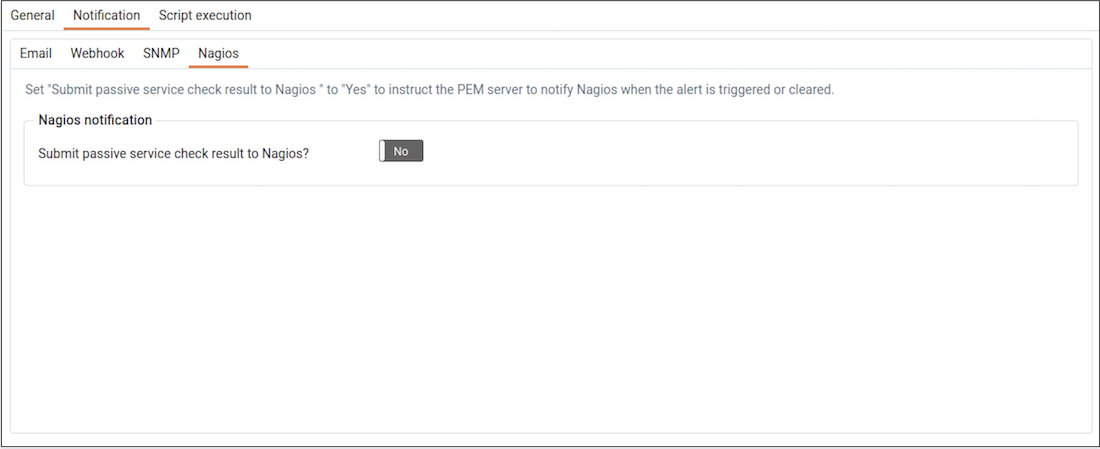
Use the field in the Nagios notification box to instruct the PEM server to notify Nagios network-alerting software when the alert is triggered or cleared. For more details see Using PEM with Nagios
- Set the
Submit passive service check result to Nagiosswitch toYesto instruct the PEM server to notify Nagios when the alert is triggered or cleared.
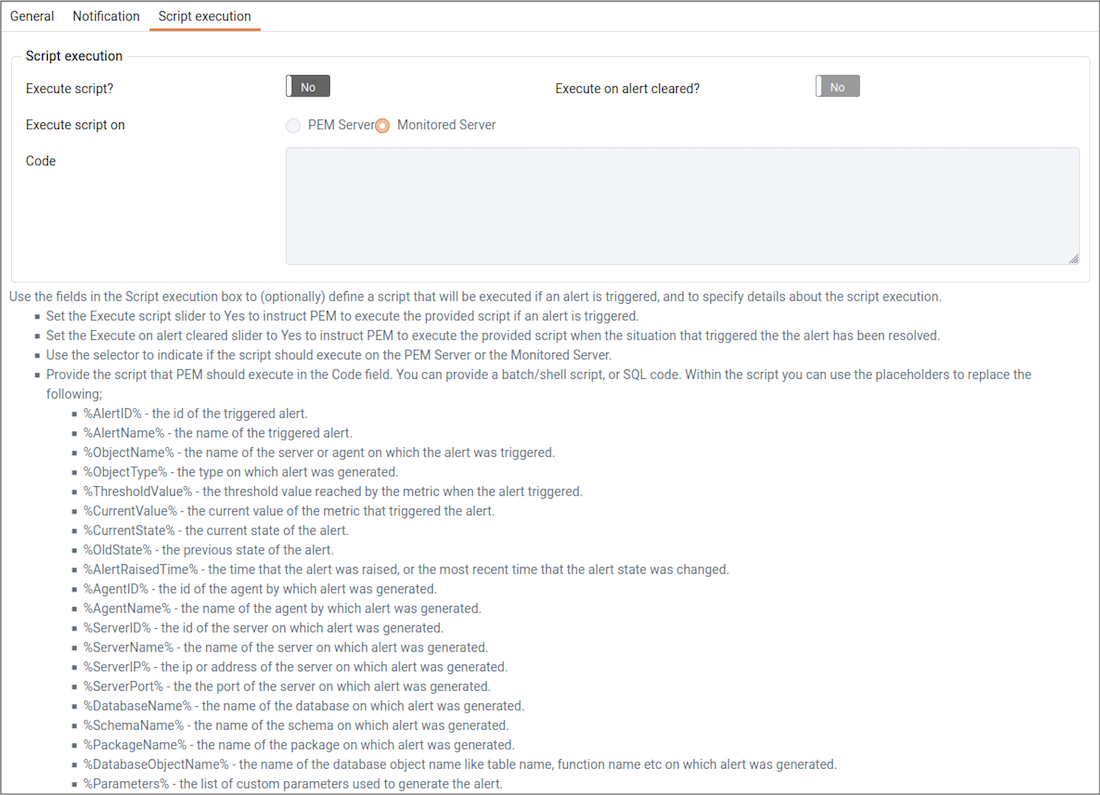
Use the fields in the Script execution box to (optionally) define a script that will be executed if an alert is triggered, and to specify details about the script execution.
Set the
Execute scriptslider toYesto instruct PEM to execute the provided script if an alert is triggered.Set the
Execute on alert clearedslider toYesto instruct PEM to execute the provided script when the situation that triggered the alert has been resolved.Use the radio buttons next to
Execute script onto indicate that the script should execute on the PEM Server or the Monitored Server.Provide the script that PEM should execute in the
Codefield. You can provide a batch/shell script, or SQL code. Within the script, you can use placeholders for the following:%AlertName%- this placeholder will be replaced with the name of the triggered alert.%ObjectName%- this placeholder will be replaced with the name of the server or agent on which the alert was triggered.%ThresholdValue%- this placeholder will be replaced with the threshold value reached by the metric when the alert triggered.%CurrentValue%- this placeholder will be replaced with the current value of the metric that triggered the alert.%CurrentState%- this placeholder will be replaced with the current state of the alert.%OldState%- this placeholder will be replaced with the previous state of the alert.%AlertRaisedTime%- this placeholder will be replaced with the time that the alert was raised, or the most recent time that the alert state was changed.To invoke a script on a Linux system, you must modify the entry for the
batch_script_userparameter of theagent.cfgfile and specify the user that should be used to run the script. You can either specify a non-root user or root for this parameter. If you do not specify a user, or the specified user does not exist, then the script will not be executed. Restart the agent after modifying the file.To invoke a script on a Windows system, set the registry entry for
AllowBatchJobStepsto true and restart the PEM agent. PEM registry entries are located in HKEY_LOCAL_MACHINE/Software/Wow6432Node/EnterpriseDB/PEM/agent.
When you have defined the alert attributes, click the edit icon to close the alert definition editor, and then the save icon (in the upper-right corner of the Alerts table). To discard your changes, click the refresh icon; a popup will ask you to confirm that you wish to discard the changes.
Note Suppose you need to use the alert configuration placeholder values in an external script. You can do it either by passing them as the command-line arguments or exporting them as environment variables. Please note that the external script must have proper execution permissions.
You can run the script with any of the placeholders as command-line argument.
For eg:
#!/bin/bash

bash <path_to_script>/script.sh "%AlertName%  %AlertLevel% %AlertDetails%"
You can define the environment variables for any of the placeholders and then use those environment variables in the script.
For eg:
#!/bin/bash

export AlertName=%AlertName%
export AlertState=%AlertState%

bash <path_to_script>/script.sh
Modifying an Alert
Use the Alerts table to manage an existing alert or create a new alert. Highlight an object in the PEM client tree control to view the alerts that monitor that object.
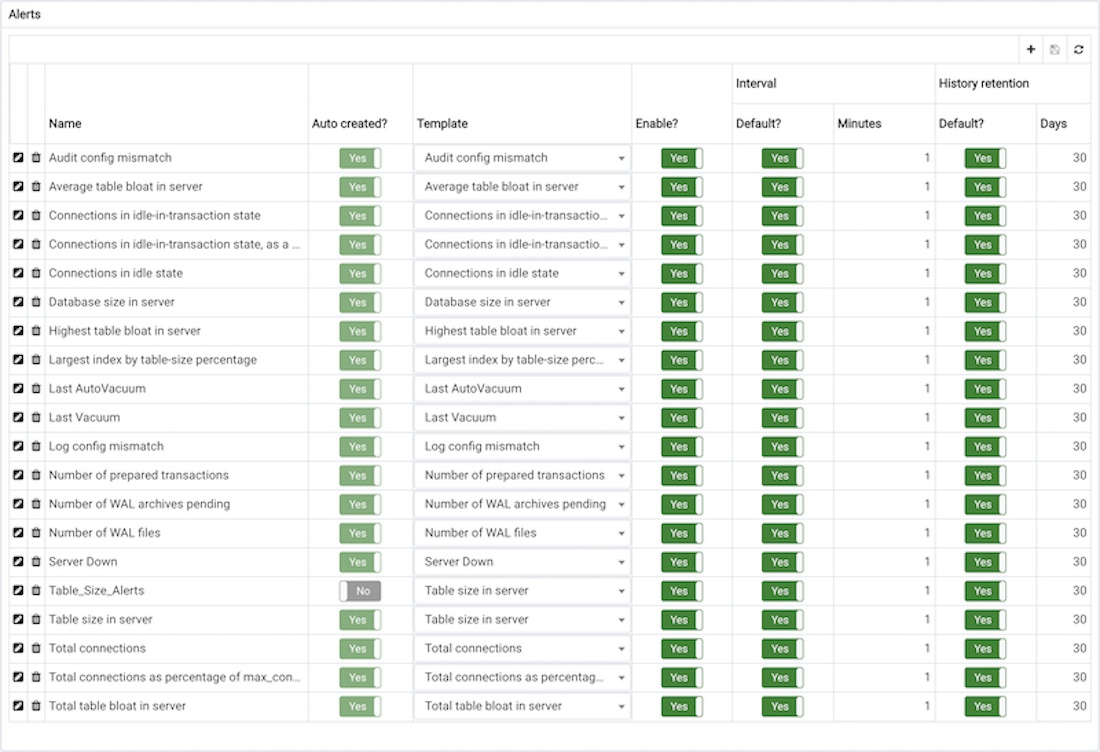
You can modify some properties of an alert in the Alerts table:
- The
Alert namecolumn displays the name of the alert; to change the alert name, simply replace the name in the table, and click the save icon. - The
Alert templatecolumn displays the name of the alert template that specifies properties used by the alert. You can use the drop-down listbox to change the alert template associated with an alert. - Use the
Alert enable?switch to specify if an alert is enabled (Yes) or disabled (No). - Use the
Intervalcolumn to specify how often PEM should check to see if the alert conditions are satisfied. Set theDefaultswitch toNoand specify an alternate value (in Minutes), or return the Default switch toYesto reset the value to its default setting. By default, PEM will check the status of each alert once every minute. - Use the
History retentionfield to specify the number of days that PEM will store data collected by the alert. Set theDefaultswitch toNoand specify an alternate value (in Days), or return the Default switch toYesto reset the value to its default setting. By default, PEM will recommend storing historical data for 30 days.
After modifying an alert, click the save icon (located in the upper-right corner of the table) to make your changes persistent.
Click the edit icon to the left of an alert name to open an editor that provides access to the complete alert definition to modify other alert attributes.
Use fields on the Alert details dialog to modify the definition of the selected alert. When you’ve finished modifying the alert definition, click Save to preserve your changes, or Cancel to exit the dialog without saving any changes.
Deleting an Alert
To mark an alert for deletion, highlight the alert name in the Alerts table and click the delete icon to the left of the name; the alert will remain in the list, but in red strike-through font.
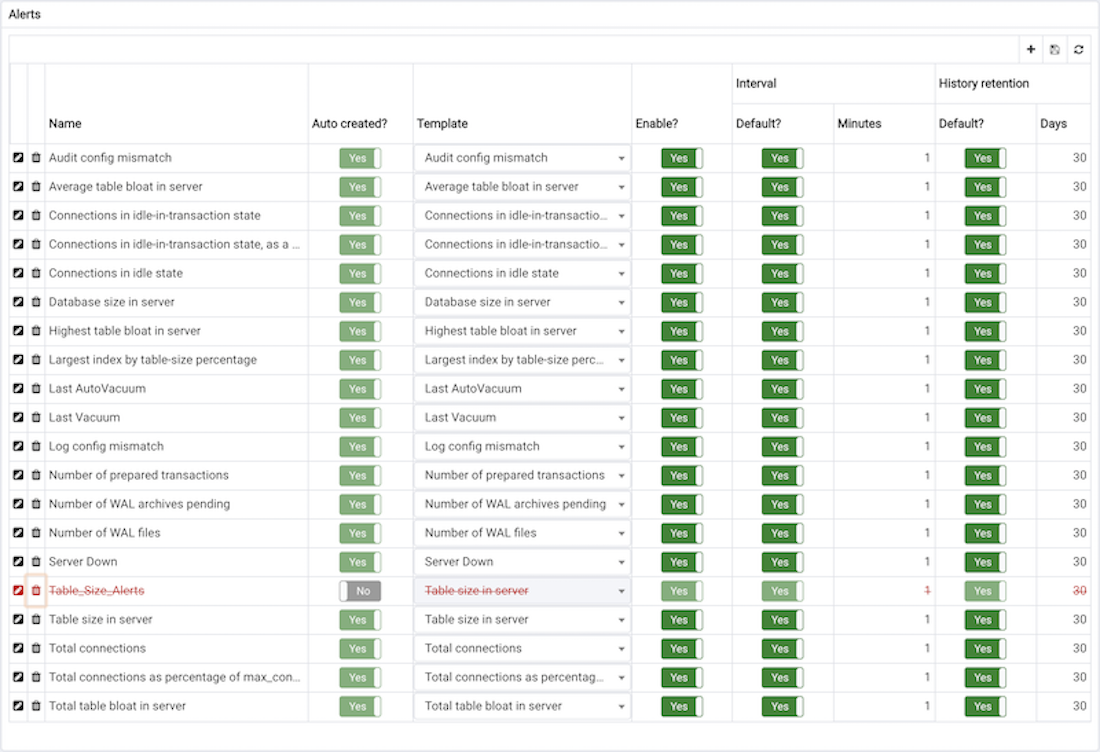
The delete icon acts as a toggle; you can undo the deletion by clicking the delete icon a second time; when you click the Save icon, the alert definition will be permanently deleted.
Copying an Alert
To speed up the deployment of alerts in the PEM system, you can copy alert definitions from one object to one or more target objects.
To copy alerts from an object, highlight the object in the PEM client tree control on the main PEM window, and select the Copy Alerts... option from the Management menu. When the Manage Alerts tab opens, click the Copy Alerts icon (located in the Quick Links toolbar) to open the Copy Alert Configuration dialog.
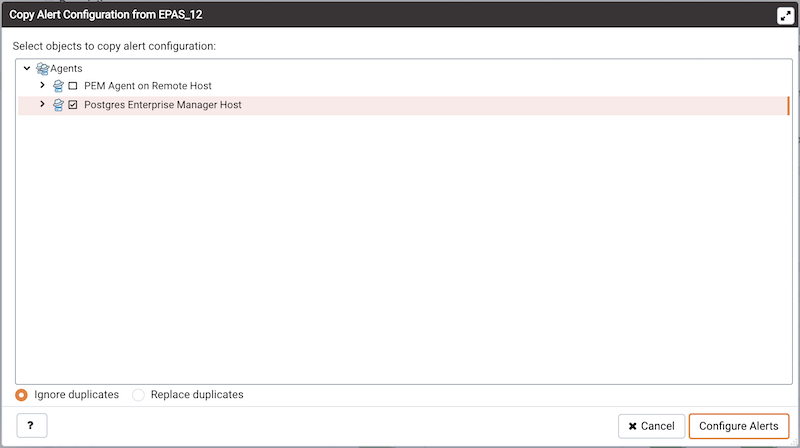
The Copy Alert Configuration dialog copies all alerts from the object highlighted in the PEM client tree control to the object or objects selected on the dialog. Expand the tree control to select a node or nodes to specify the target object(s). The tree control displays a red warning indicator next to the source object.
To copy alerts to multiple objects at once, select a parent node of the target(s). For example, to copy the alerts from one table to all tables in a schema, you can simply select the checkbox next to the schema. PEM will only copy alerts to targets that are of the same type as the source object.
Check the Ignore duplicates radio button to prevent PEM from updating any existing alerts on the target objects with the same name as those being copied. Use the Replace duplicates option to replace existing alerts with alerts of the same name from the source object.
Click the Configure Alerts button to proceed to copy the alerts from the source object to all objects of the same type in, or under those objects selected on the Copy Alert Configuration dialog.
Schedule Alert Blackout
You can use the Schedule Alert Blackout option on the Management menu to schedule an alert blackout for your Postgres servers and PEM Agents during maintenance. Alerts will not be raised during a defined blackout period.
To schedule an alert blackout, click on the Management menu and select Schedule Alert Blackout.
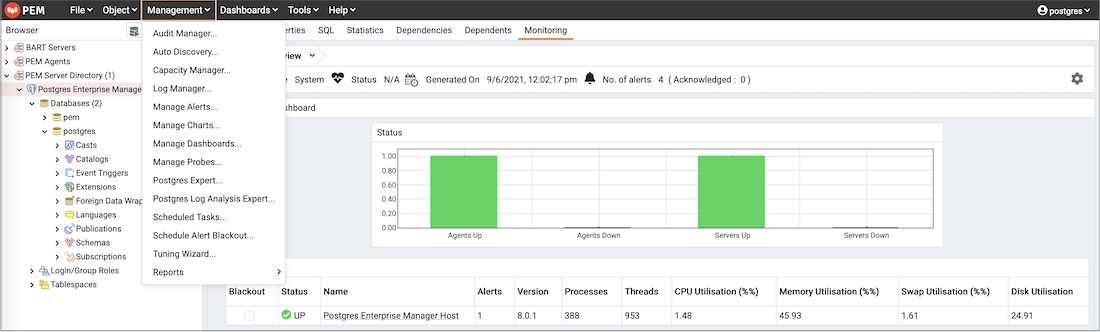
When the Schedule Alert Blackout dialog opens, use the tabs on the dialog to define the blackout period for servers and agents. Open the Server tab and click the Add icon (+) at the top right corner to add new row.
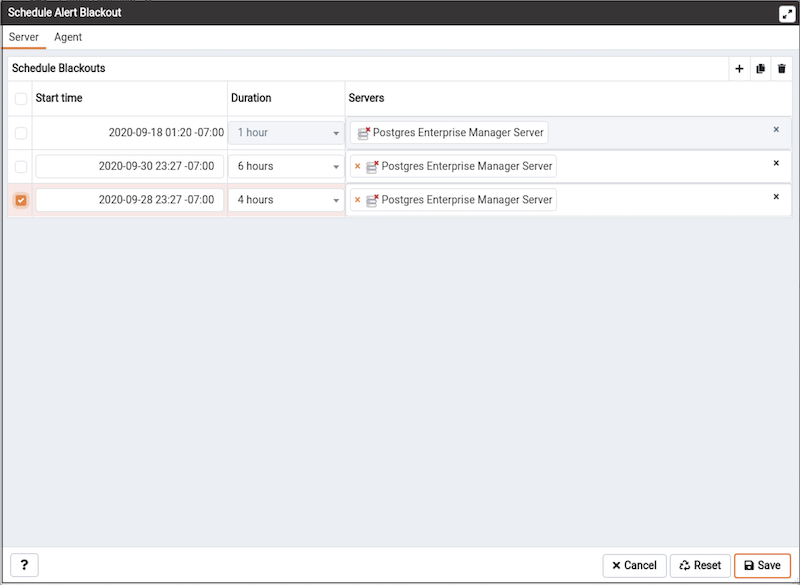
Use the fields on the Server tab to provide information about an alert blackout period:
- Use the
Start timefield to provide the date and time to start the alert blackout. - Use the
Durationfield to provide the interval for which you want to blackout the alerts. - Use the
Serversfield to provide the server name for which you want to blackout the alerts. You can also select multiple servers to blackout the alerts for those servers simultaneously.
After providing details, you can save the details by clicking on Save button on the right bottom corner of the dialog. Once saved, it cannot be edited. The alerts will not be displayed on the Alerts dashboard for the scheduled interval of that particular server.
You can also schedule a blackout period for PEM Agents via the Agent tab on the dialog. Open the Agent tab and click the Add icon (+) at the top right corner to add new row.
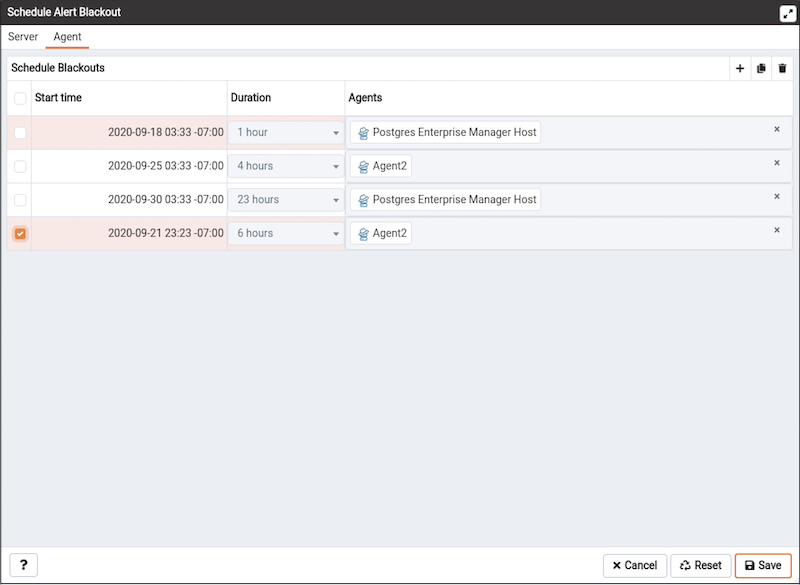
Use the fields on the Agent tab to provide the information about about an alert blackout period:
- Use the
Start timefield to provide the date and time to start the alert blackout. - Use the
Durationfield to provide the interval for which you want to blackout the alerts. - Use the
Agentsfield to provide the Agent name for which you want to blackout the alerts. All server level alerts, for the servers bound to that particular agent will blackout.
After providing details, you can save the details by clicking on Save button on the right bottom corner of the dialog. Once saved, it cannot be edited. The alerts will not be displayed on the Alert dashboard for the scheduled interval for that PEM agent.
You can use Clone button from the top right corner of dialog, to clone the scheduling of alert blackout. Select the servers or agents you want to clone and then click on Clone button to create the cloned copy of all the selected servers or agents. You can edit newly created schedules as needed, and then click Save.
You can use Delete button from the top right corner of dialog to remove a scheduled alert blackout. Select the servers or agents and then click on highlighted Delete button in the right top corner to remove the scheduled alerts associated with that server or agent.
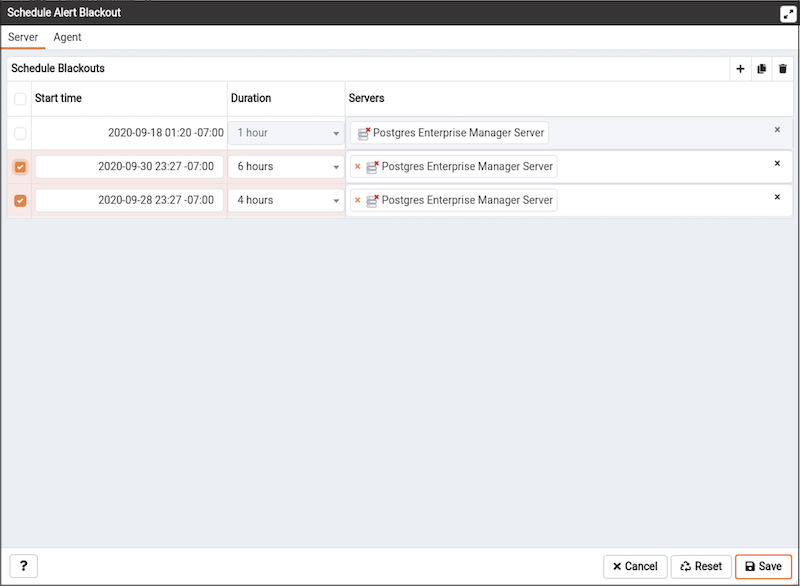
Select a server for which you wish to delete the scheduled alert backout and then click on the Delete button. The server will ask for confirmation before deleting that row.
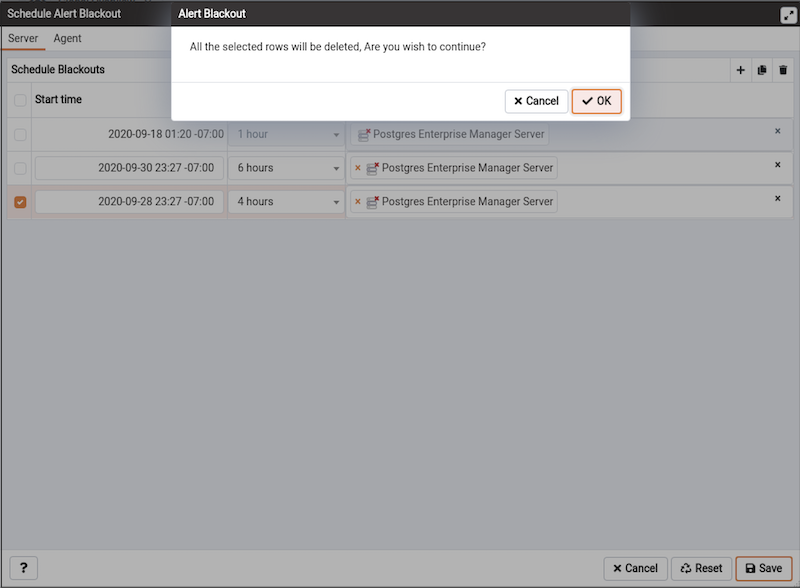
You can use the Reset button to reset the details on the Alert Blackout dialog to the default settings. Please note that all saved blackouts will remain unaffected after resetting the current dialog values.
Notifications
PEM can send a notification or execute a script if an alert is triggered, or if an alert is cleared. The Notifications can be send via following options:
- SMTP
- Webhooks
- SNMP
- Nagios
Use the Notification tab to specify how PEM will behave if an alert is raised.
SMTP
Please note that you must configure the PEM Server to use an SMTP server to deliver email before PEM can send email notifications.
Creating an Email Group
Postgres Enterprise Manager monitors your system for conditions that require user attention. You can use an email group to specify the email addresses of users that the server will notify if current values deviate from threshold values specified in an alert definition. An email group has the flexibility to notify multiple users, or target specific users during user-defined time periods.
Use the Email Groups tab to configure groups of SMTP email recipients. To access the Email Groups tab, select Manage Alerts... from the PEM client’s Management menu; when the Manage Alerts tab opens, select Email Groups from the Quick Links toolbar.
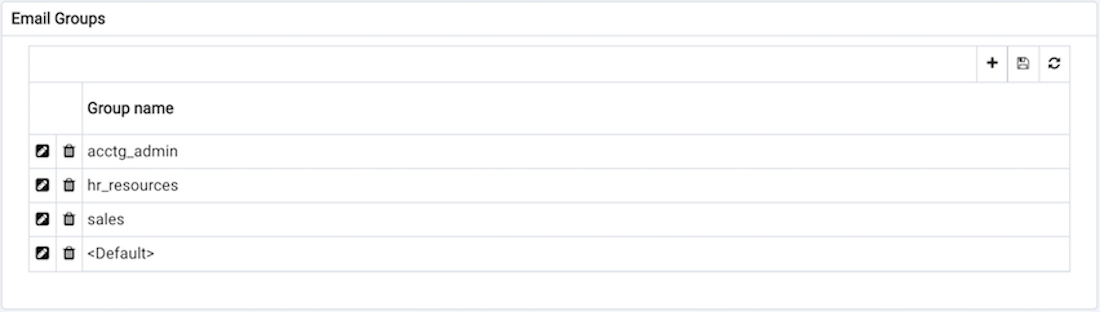
The Email Groups tab displays a list of the currently defined email groups. Highlight a group name and click the Edit icon (at the far left end of the row) to modify an existing group.
To define a new email group, click the Add icon (+) in the upper-right corner of the Email Groups table. The Email Group definition dialog opens.
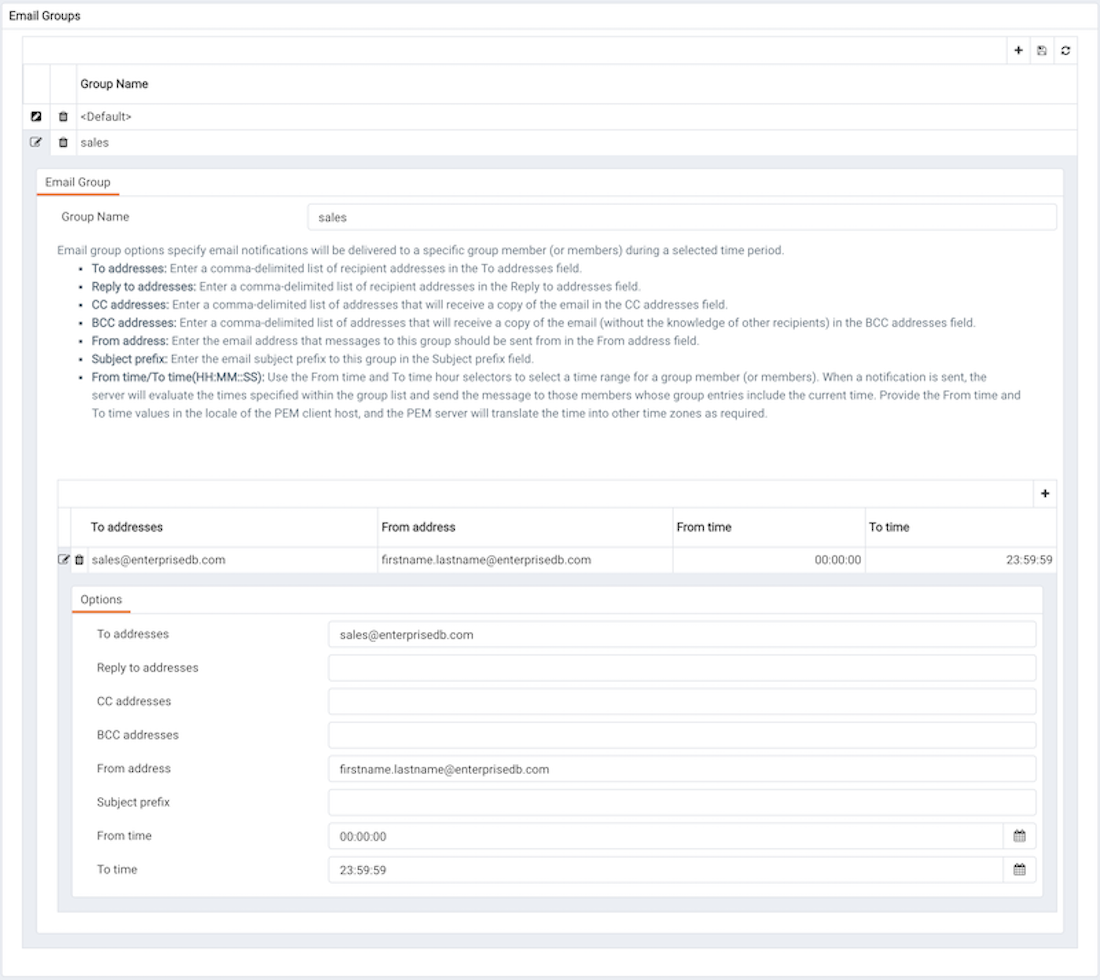
Use the Email Group dialog to define an email group and its members:
- Provide a name for the email group in the
Group Namefield.
Each row within the email group definition will associate a unique set of email addresses with a specific time period. When an alert is triggered, the server will evaluate the times specified in each row and send the message to those group members whose definitions are associated with the time that the alert triggered.
Click the Add icon (+) in the group members table to open the Options tab, and add the member addresses that will receive notifications for the time period specified:
- Enter a comma-delimited list of recipient addresses in the
Replyto Addresses field. - Enter a comma-delimited list of addresses that will receive a copy of the email in the
CC Addressesfield. - Enter a comma-delimited list of addresses that will receive a copy of the email (without the knowledge of other recipients) in the
Bcc Addressesfield. - Enter the email address that messages to this group should be sent from in the
From Addressfield. - Use the
Subject prefixfield to provide a message that will be added to the start of each subject line when a notification is sent. - Use the
From TimeandTo Timetime selectors to specify the time range for notifications to the group member(s) that are identified on this row. Provide the From Time and To Time values in the locale of the PEM client host, and the PEM server will translate the time into other time zones as required.
When you’ve identified the member or members that will receive an email during a specific time period, click the Add icon to add a row to the table, and specify another time period and the email addresses that will be notified during those hours. When you’ve finished defining the email group, click the Save icon.
Deleting an Email Group
To delete an email group, highlight the name of the group in the Email Group table and click the Delete icon (located to the left of the group name).

The group name will be displayed in the Email Group table in red; click the Save icon to make the change persistent and remove the group from the table.
After creating the email group, you can use the Manage Alerts tab to set up the Notification details for an alert that will direct notifications to the group.
Webhook
Please note that you must configure the PEM Server to use webhooks to receive notification of alert events on threshold value violations in your configured applications.
Creating Webhook
Postgres Enterprise Manager monitors your system for conditions that require user attention. You can use a webhook to create the endpoints that will receive a notification if current values deviate from threshold values specified in an alert definition. PEM sends a notification to multiple webhook endpoints, or to specific target webhook endpoints based on the events triggered.
Use the Webhooks tab to configure endpoint recipients. To access the Webhooks tab, select Manage Alerts... from the PEM client’s Management menu; when the Manage Alerts tab opens, select Webhooks from the Quick Links toolbar.
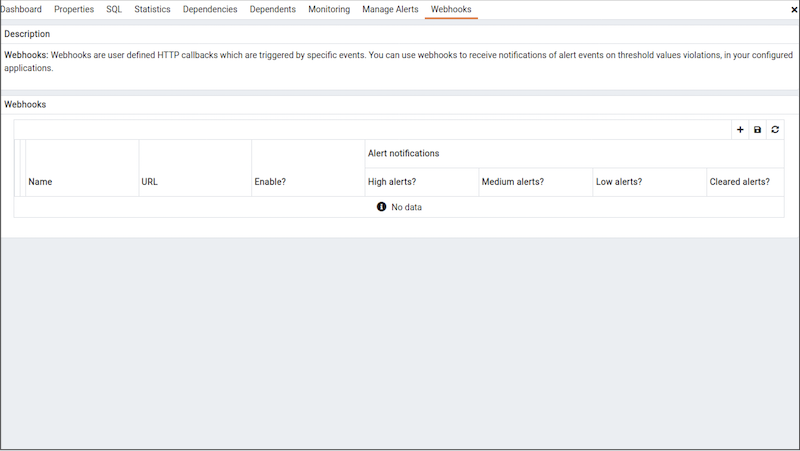
The Webhooks tab displays a list of the currently defined recipient applications as endpoints. Highlight an endpoint and click the edit icon (at the far left end of the row) to modify an existing endpoint.
To define a new webhook, click the Add icon (+) in the upper-right corner of the table.
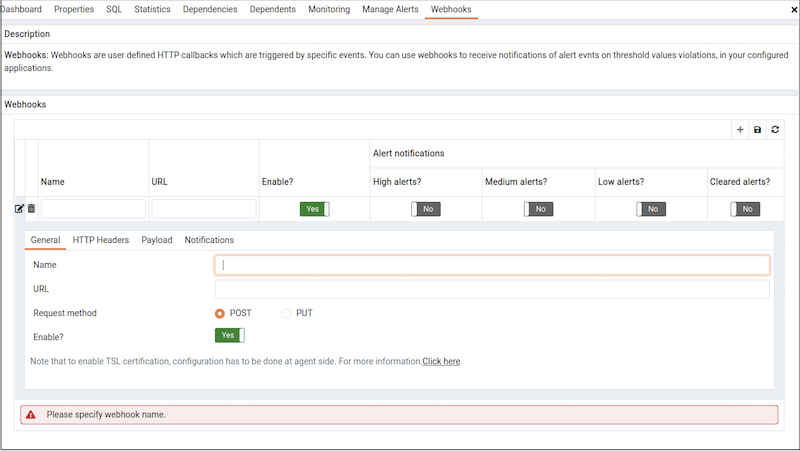
Use the General tab to define the basic details of the webhook:
- Provide a name for the webhook in the
Namefield. - Specify a webhook URL where all the notifications will be delivered in the
URLfield. - Set the request method type used to make the call in the
Request Methodfield i.e.POSTorPUT. - By default
webhookswill be enabled; to disable a webhook setEnable?toNo.
Note The above
Enable?setting will work only ifenable_webhookparameter is set to true inagent.cfgfile. By default,enable_webhookparameter is set to true only for the Agent running on the PEM Server Host. For all other Agents running on other hosts, it needs to be set to true manually.
Defining a Webhook SSL configurations
You can define the Webhook SSL parameters in the respective agent configuration file or registry in windows. You can find the list of Webhook SSL parameters PEM Agent Configuration Parameters section. If you add or remove any of the agent configuration parameters, you must restart the agent to apply them.
- On 32 bit Windows systems, PEM registry entries for Webhooks are located in
HKEY_LOCAL_MACHINE\\Software\\EnterpriseDB\\PEM\\agent\\WEBHOOK - On 64 bit Windows systems, PEM registry entries for Webhooks are located in
HKEY_LOCAL_MACHINE\\Software\\Wow6432Node\\EnterpriseDB\\PEM\\agent\\WEBHOOK - On Linux systems, PEM configuration options for Webhooks are stored in the agent.cfg file, located (by default) in
/usr/edb/pem/agent/etc


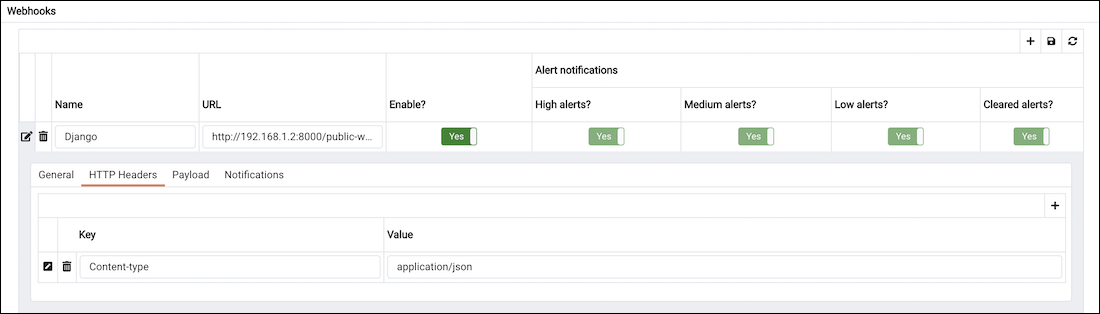
Use the HTTP Headers tab to define the header parameters to pass while calling the webhook endpoints:
- All the values will be specified as a key and value pair.
- Specify a key parameter in the
Keyfield and a value in theValuefield. - To add multiple
HTTP Headers, click theAddicon (+) in the upper-right corner of theHTTP Headerstable. - To delete the
HTTP Headers, click onDeleteicon to the left of theKey; the alert will remain in the list, but in strike-through font. Click theSavebutton to reflect the changes. - To edit the
HTTP Headers, click on theEditicon to the left ofKey.
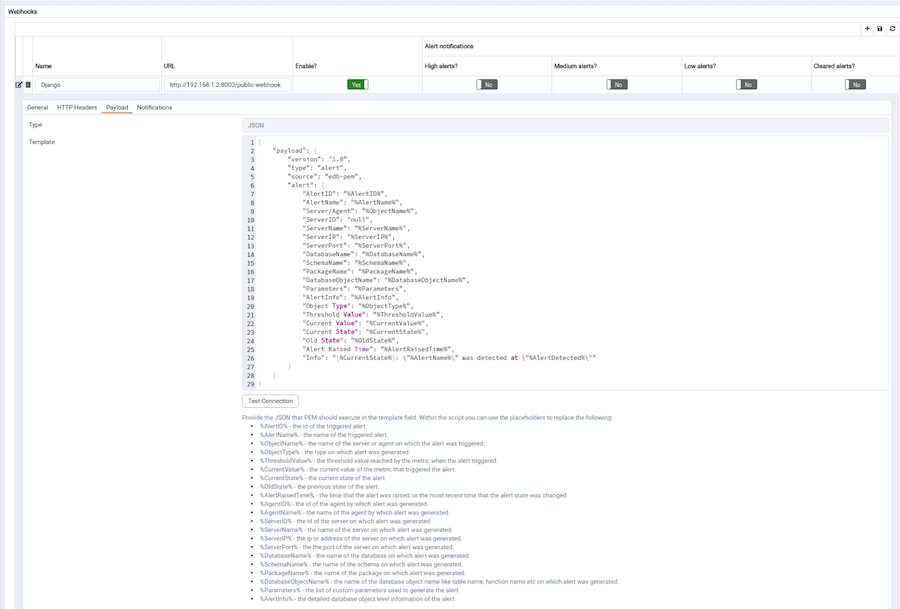
Use the Payload tab to define the JSON data to be sent to the endpoint when an alert is triggered:
Typespecifies data to be sent in format type (i.e. JSON).Use
Templateto configure JSON data sent to endpoints. Within theTemplate, you can use placeholders for the following:%AlertID%- the id of the triggered alert.%AlertName%- the name of the triggered alert.%ObjectName%- the name of the server or agent on which the alert was triggered.%ObjectType%- the type on which alert was generated.%ThresholdValue%- the threshold value reached by the metric when the alert triggered.%CurrentValue%- the current value of the metric that triggered the alert.%CurrentState%- the current state of the alert.%OldState%- the previous state of the alert.%AlertRaisedTime%- the time that the alert was raised, or the most recent time that the alert state was changed.%AgentID%- the id of the agent by which alert was generated.%AgentName%- the name of the agent by which alert was generated.%ServerID%- the id of the server on which alert was generated.%ServerName%- the name of the server on which alert was generated.%ServerIP%- the ip or address of the server on which alert was generated.%ServerPort%- the the port of the server on which alert was generated.%DatabaseName%- the name of the database on which alert was generated.%SchemaName%- the name of the schema on which alert was generated.%PackageName%- the name of the package on which alert was generated.%DatabaseObjectName%- the name of the database object name like table name, function name etc on which alert was generated.%Parameters%- the list of custom parameters used to generate the alert.%AlertInfo%- the detailed database object level information of the alert.
Click on the
Test Connectionbutton, to test notification delivery to the mentioned endpoint.
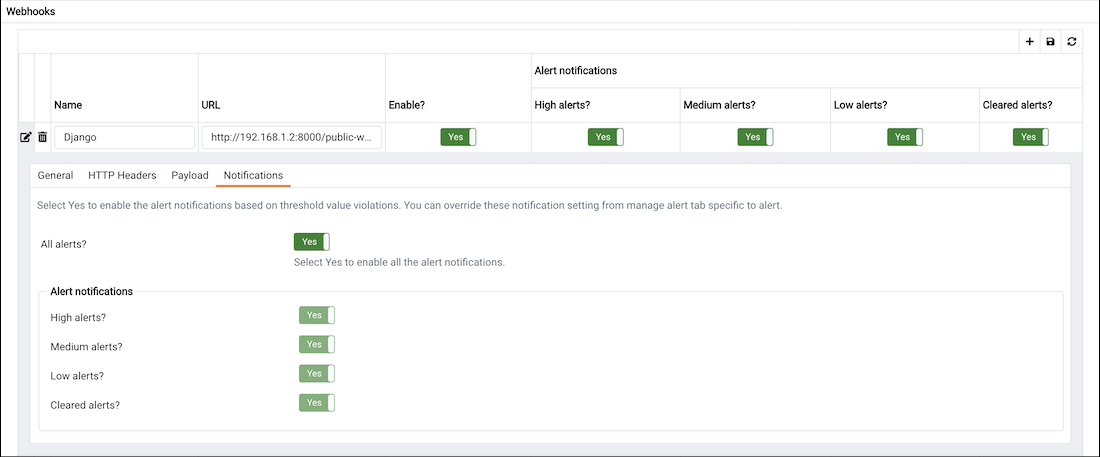
Use the Notifications tab to specify an alert level for webhook endpoints:
- Set
All alertstoYesto enable all alert levels to send notifications. - To instruct PEM to send an notification when a specific alert level is reached, set the slider next to an alert level to
Yes. Please note that you must setAll alertstoNoto configure an individual alert level.
Deleting a Webhook
To mark a webhook for deletion, highlight the webhook name in the Webhooks table and click the delete icon to the left of the name; the alert will remain in the list, but in strike-through font.

The delete icon acts as a toggle; you can undo the deletion by clicking the delete icon a second time; when you save your work (by clicking the save icon), the webhook definition will be permanently deleted.
Using PEM with Nagios
The PEM server can send a passive alert result to Nagios network-alerting software when a user-defined alert is triggered. To instruct the PEM server to notify Nagios of a triggered alert, you must:
- Enable Nagios notification for each alert that will trigger a notification from the PEM server to Nagios. Please note that PEM alerting must be configured before you create the host.cfg file and services.cfg file.
- Configure Nagios-related behaviors of the PEM server.
- Create the host.cfg and services.cfg configuration files.
- If necessary, modify the Nagios configuration file and restart the Nagios server.
- Install the PEM Agent on the system where Nagios server is installed and register it with the PEM Server. Set
enable_nagiosconfiguration totruein the agent.cfg for that agent, and restart the agent service.
After configuring the server to enable Nagios alerting, any triggered alerts will send a passive check result to the Nagios service. The syntax of a passive alert is:
<timestamp> PROCESS_SERVICE_CHECK_RESULT; <host_name> ; <service_name> ; <service_status> ;
Where:
timestamp is the date and time that the alert was triggered.
host_name is the name of the server or agent.
service_name is the name of the alert.
service_status is the numeric service status value:
0 if the service status is OK 1 if the service status is WARNING 2 if the service status is CRITICAL 3 if the service status is UNKNOWN
The PEM server uses the following rules to evaluate the service status:
- If the PEM alert level is CLEARED, the warning message will read OK.
- If the PEM alert level is LOW, the warning message will read WARNING.
- If the
is_nagios_medium_alert_as_criticalflag (specified in the PEM server configuration dialog) is set to FALSE and the alert level MEDIUM, the warning message will read WARNING. - If the
is_nagios_medium_alert_as_criticalflag (specified in the PEM server configuration dialog) is set to TRUE and the alert level is MEDIUM, the warning message will read CRITICAL. - If the PEM alert level is
HIGH, the warning message will readCRITICAL.
Enabling Nagios Notification for an Alert
The PEM server maintains a unique set of notification properties for each enabled alert. Use the Notification tab of the Manage Alerts tab to specify that (when triggered), a given alert will send an alert notice to Nagios.
To modify the notification properties of an alert, right-click on the name of the object monitored by the alert, and select Manage Alerts... from the Management menu. When the Manage Alerts tab opens, locate the alert, and then click the edit button to the left of the alert name in the Alerts list. When the edit pane opens, select the Notification tab.
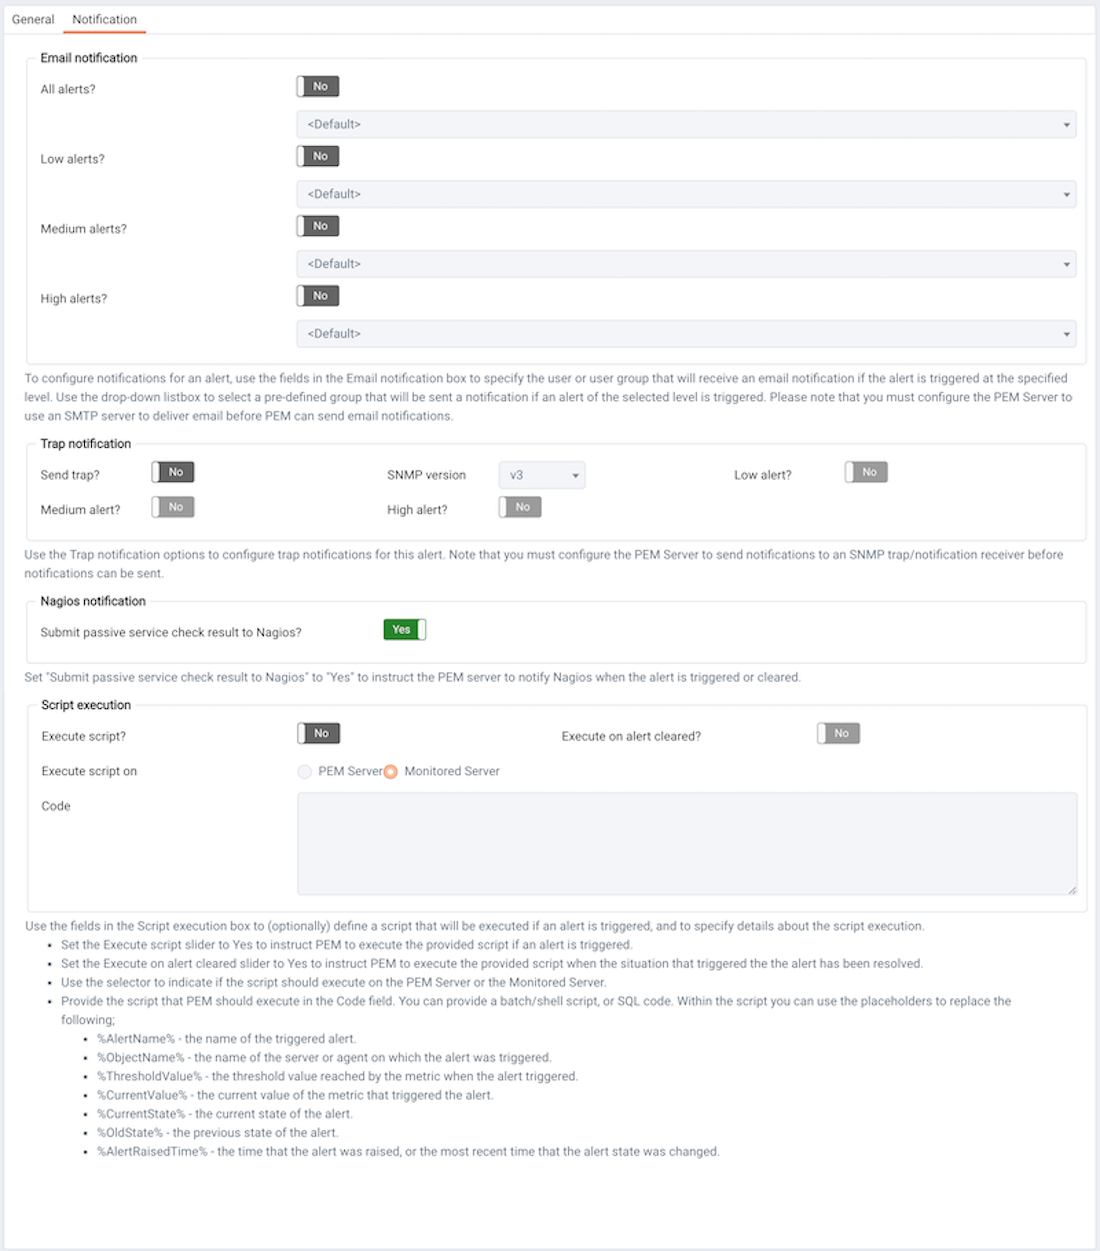
To enable Nagios notification, move the slider next to Submit passive service check result to Nagios to Yes; before exiting the Manage Alerts tab, click the save icon to preserve your changes.
Configuring Nagios-related behavior of the PEM Server
You can use the Server Configuration dialog to provide information about your Nagios configuration to the PEM server. To open Server Configuration dialog, select Server Configuration... from the PEM client’s Management menu.
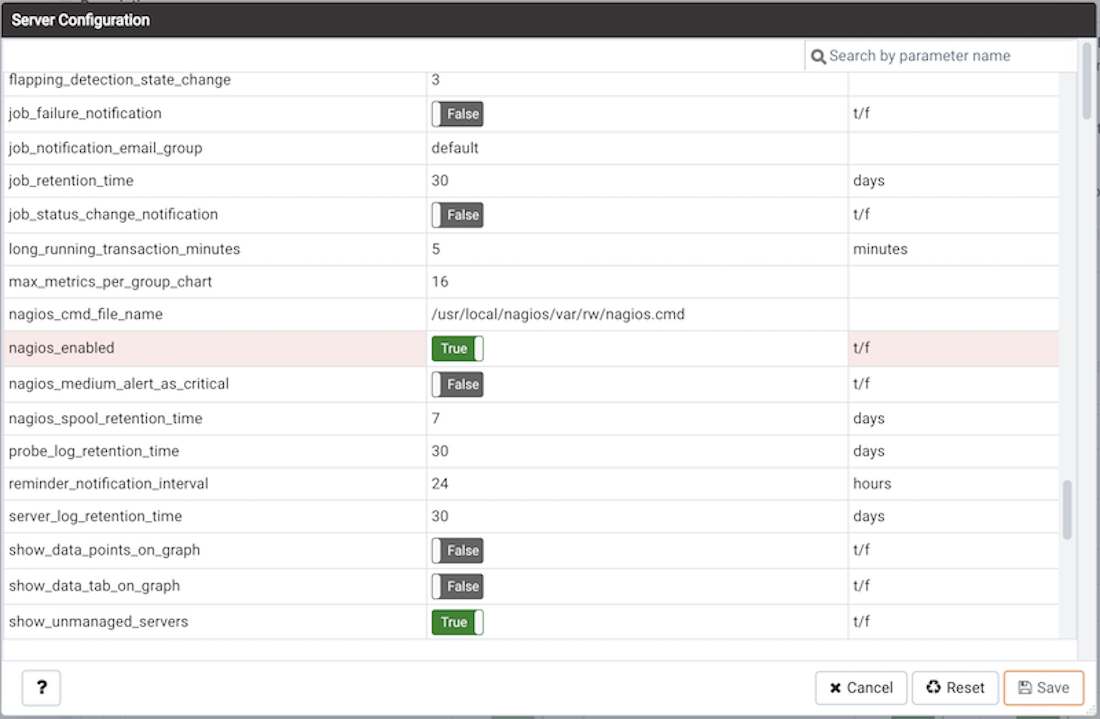
Four server configuration parameters specify information about your Nagios installation and PEM server behavior related to Nagios:
Use the
nagios_cmd_file_nameparameter to specify the location of the Nagios pipeline file that will receive passive check alerts from PEM. The default value of this parameter is/usr/local/nagios/var/rw/nagios.cmd. If yournagios.cmdfile resides in an alternate location, specify the file location in the Value field.Move the slider in the
nagios_enabledparameter toYesto instruct the PEM server to send passive check alerts to Nagios.Use the
nagios_medium_alert_as_criticalslider to specify the warning severity that the PEM server will pass to Nagios if a medium alert is triggered:If the
is_nagios_medium_alert_as_criticalflag is set to FALSE and the alert level is MEDIUM, the warning message will read WARNING.If the
is_nagios_medium_alert_as_criticalflag is set to TRUE and the alert level is MEDIUM, the warning message will read CRITICAL.Use the
nagios_spool_retention_timeparameter to specify the number of days of notification history that will be stored on the PEM server. The default value is 7 days.
After modifying parameter values, click the save icon (in the upper-right corner of the Server Configuration dialog) to preserve your changes.
Creating the hosts.cfg and services.cfg File
The templates.cfg file (by default, located in /usr/local/nagios/etc/objects) specifies the properties of a generic-host and generic-service. The properties specify the parameters used in the hosts.cfg and services.cfg files.
In most cases (when PEM is installed in a default configuration), you will not be required to modify the templates.cfg file before creating the hosts.cfg and services.cfg files. If necessary, you can modify the templates.cfg file to specify alternate values for parameters or to create new templates.
Before modifying the Nagios configuration file, use the following command to create a hosts.cfg file that contains information about the PEM hosts that reside on the local system:
psql -U postgres -p 5433 -d pem -A -t -c "select pem.create_nagios_host_config('generic-host')" > /usr/local/nagios/etc/objects/hosts.cfg
Then, use the following command to create a services.cfg file that contains information about the PEM services that reside on the local system:
psql -U postgres -p 5433 -d pem -A -t -c "select pem.create_nagios_service_config('generic-service')" > /usr/local/nagios/etc/objects/services.cfg
If you wish to use a custom template.cfg file entry, specify the entry name in place of generic-host or generic-service in the above commands.
Modifying the Nagios Configuration File
After creating the host.cfg and services.cfg files, you must specify their location in the Nagios configuration file (by default, /usr/local/nagios/etc/nagios.cfg). Modify the configuration file, adding entries that specify the location of the files:
cfg_file=/usr/local/etc/objects/hosts.cfg
cfg_file=/usr/local/etc/objects/services.cfg
You can use the following command to confirm that Nagios is properly configured:
/usr/local/nagios/bin/nagios -v /usr/local/nagios/etc/nagios.cfg
After confirming that Nagios is configured correctly, restart the Nagios service:
/usr/local/nagios/bin/nagios -d /usr/local/nagios/etc/nagios.cfg
Capacity Manager
PEM’s Capacity Manager analyzes collected statistics (metrics) to generate a graph or table that displays the historical usage statistics of an object, and can project the anticipated usage statistics for an object. You can configure Capacity Manager to collect and analyze metrics for a specific host, server, database, or database object.
You can tailor the content of the Capacity Manager report by choosing a specific metric (or metrics) to include in the report, the time range over which the metrics were gathered, and a high or low threshold for the metrics analyzed. You can also specify a start and end date for the Capacity Manager report. If the end date of the report specifies a time in the future, Capacity Manager will analyze the historical usage of the selected object to extrapolate the projected object usage in the future.
To open Capacity Manager, select the Capacity Manager... option from the PEM client Management menu; the Capacity Manager wizard opens, displaying a tree control on the Metrics tab.
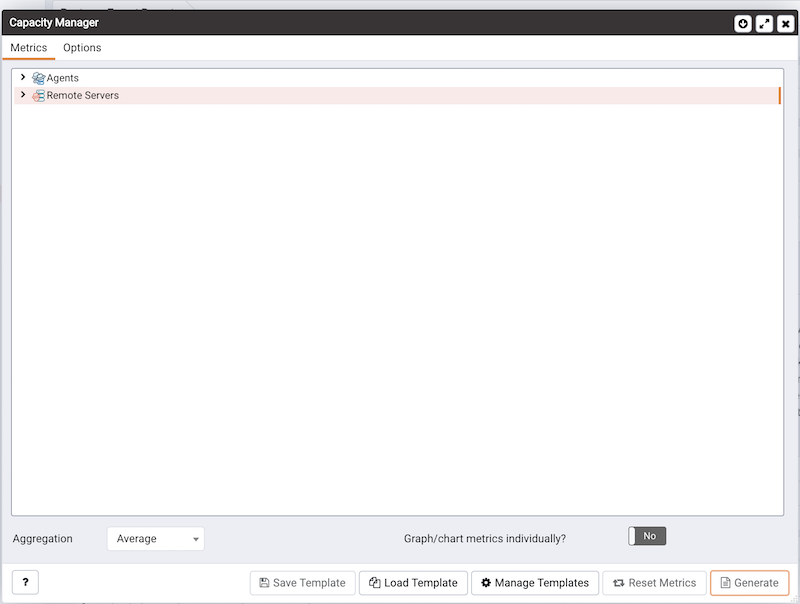
Expand the tree control on the Metrics tab to review the metrics for the node that you wish to analyze. Check the box to the left of the name of the metric to include the metric in your report.
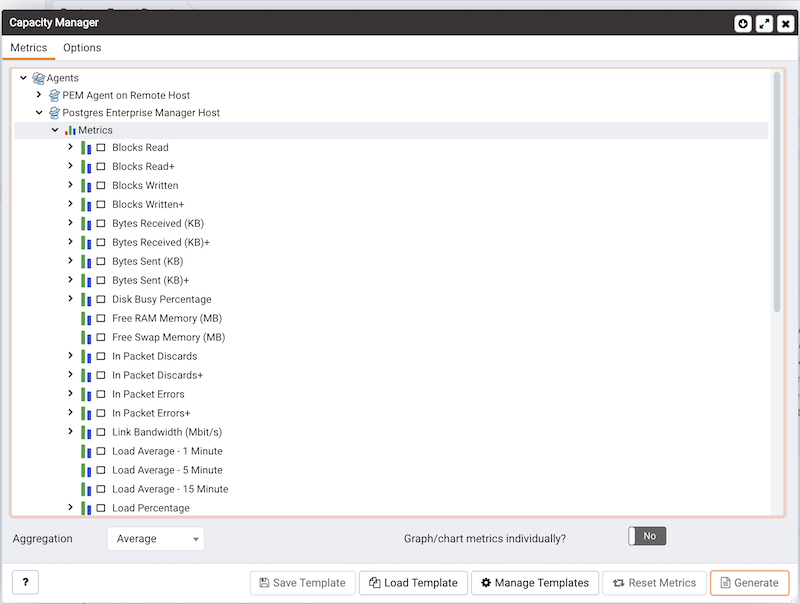
Capacity Manager will use the aggregation method specified with the Aggregation drop-down listbox (located at the bottom of the Metrics tab). The aggregation method instructs Capacity Manager how to evaluate and plot the metric values. Select from:
Average: Use the average of the values recorded during the time period.Maximum: Use the maximum value recorded during the time period.Minimum: Use the minimum value recorded during the time period.First: Use the first value recorded during the time period.
To remove a metric from the Capacity Manager report, uncheck the box to the left of the name of a metric.
Move the slider next to Graph/chart metrics individually? to Yes to instruct Capacity Manager to produce a separate report for each metric selected on the Metrics tab. If the option is set to No, all selected metrics will be merged into a single graph or table.
Click the Generate button to display the report onscreen (accepting the default configuration options), or use the Options tab to customize sampling boundaries, report type and report destination. Please note that the times displayed on the Options tab are the time zone in which the PEM client resides.
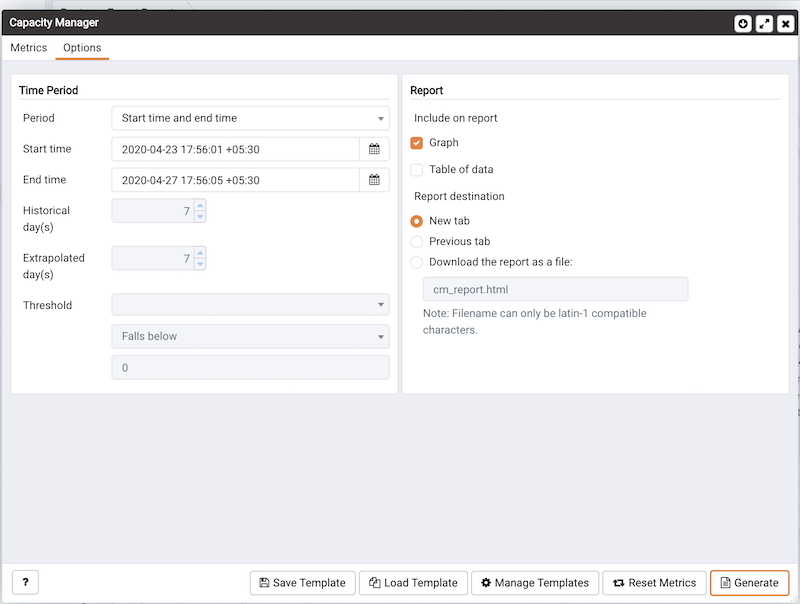
Use the fields within the Time Period box to define the boundaries of the Capacity Manager report:
- Use the
Perioddrop-down listbox to select the type of time period you wish to use for the report. You can select:
| Start time and end time | Specify a start date and an end date/time for the report. |
|---|---|
| Start time and threshold | Specify a start date and time, and a threshold to determine the end time and date for the report. |
| Historical days and extrapolated days | Specify a start date for the report that is a number of days in the past, and an end date that is a number of days in the future. This option is useful for report templates that do not specify fixed dates. |
| Historical days and threshold | Specify a start date that is a number of days in the past, and end it when a threshold value is reached. |
After specifying the type of time period for the report, select from other options in the Time Period box to define the time period for the report:
Use the date and time selectors next to the
Start timefield to specify the starting date and time of the sampling period, or select the number of Historical day(s) of data to include in the report. The date and time specified in the Start time field must not be later than the current date/time.By default, Capacity Manager will select a start time that is one week prior to the current date and time.
The end boundary for the report can be a time, a number of days in the future, or the point at which a selected metric reaches a user-specified threshold value. Use the date and time selectors next to the
End timefield to specify an end boundary for the report, or select the number of Extrapolated day(s) of data to include in the report. The time specified in the End time field must be later than the time specified in the Start time field.Note that if you select an end date and time in the future, Capacity Manager will use historical usage information to extrapolate anticipated future usage. Since the projected usage is based on the sampling of historical data, the accuracy of the future usage trend will improve with a longer sampling period.
To specify a threshold value, use the drop-down listbox in the Threshold field to select a metric, an operator (Exceeds or Falls below), and enter a target value for the metric. If you choose to define the end of the report using a threshold, the Capacity Manager report will terminate when the value for the selected metric exceeds or falls below the specified value.
The cm_max_end_date_in_years configuration parameter defines a default time value for the end boundary of a Capacity Manager report. If you specify a threshold value as the end boundary of a report, and the anticipated usage of the boundary is not met before the maximum time has passed, the report will terminate at the time specified by the cm_max_date_in_years parameter. By default, cm_max_end_date_in_years is 5; you can use the Server Configuration dialog to modify the value of cm_max_end_date_in_years.
The fields in the Report box specify the report type and destination. Use the Include on report radio buttons to specify the type of report produced by Capacity Manager:
- Select
Graphto instruct Capacity Manager to display the report in the form of a line graph in the PEM client window. - Select
Table of datato instruct Capacity Manager to display a table containing the report data in the PEM client window. - Select
Graph and table of datato instruct Capacity Manager to display both a line graph and a data table in the PEM client window.
Use the Report destination radio buttons to instruct Capacity Manager where to display or save the report:
- Select
Newtab to instruct Capacity Manager to display the report on a new tab in the PEM client. You must select New tab to display the first generation of a Capacity Manager report; for subsequent reports, you may select Previous tab. - Select
Previoustab to instruct Capacity Manager to re-use a previously opened tab when displaying the report. - Select
Downloadthe report as a file and specify a file name to instruct Capacity Manager to write the report to the specified file.
When you have specified the report boundaries and selected the type and destination of the Capacity Manager report, click the Generate button to create the report.
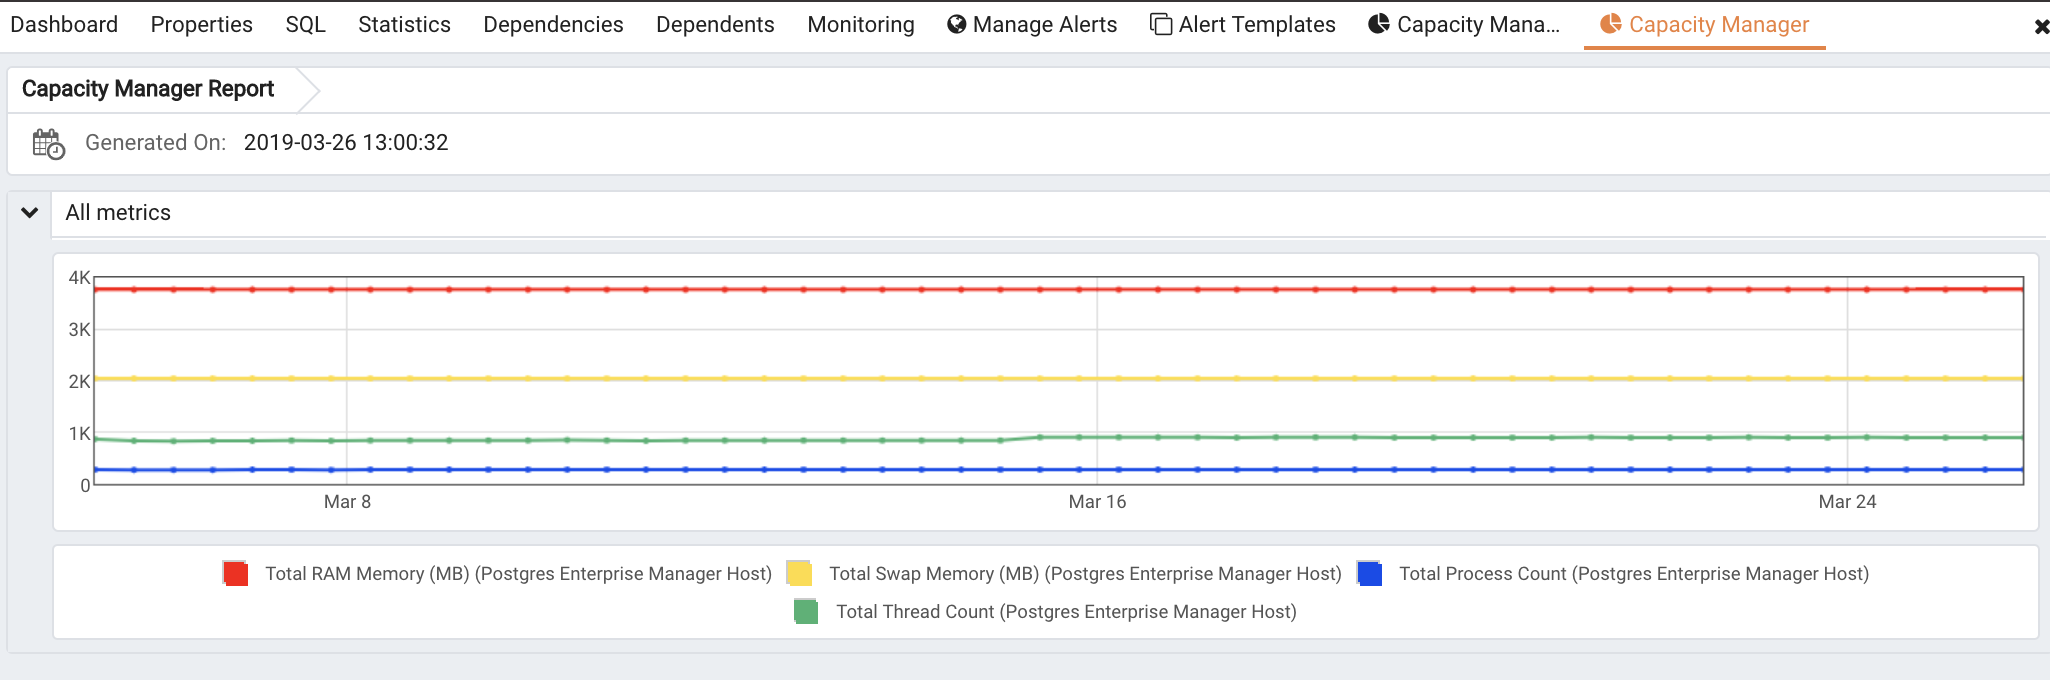
Reports saved to file are stored in HTML format. You can review a Capacity Manager report with any web browser that supports Scalable Vector Graphics (SVG). Browsers that do not support SVG will be unable to display a Capacity Manager graph and may include unwanted characters.
Capacity Manager Templates
After defining a report, you can save the definition as a template for future reports. Capacity Manager report templates may be accessed by all PEM users. To save a report definition as a template:
- Use the
Metrics and Optionstabs to define your report. - Click the
Savebutton to open theSave Templatedialog.
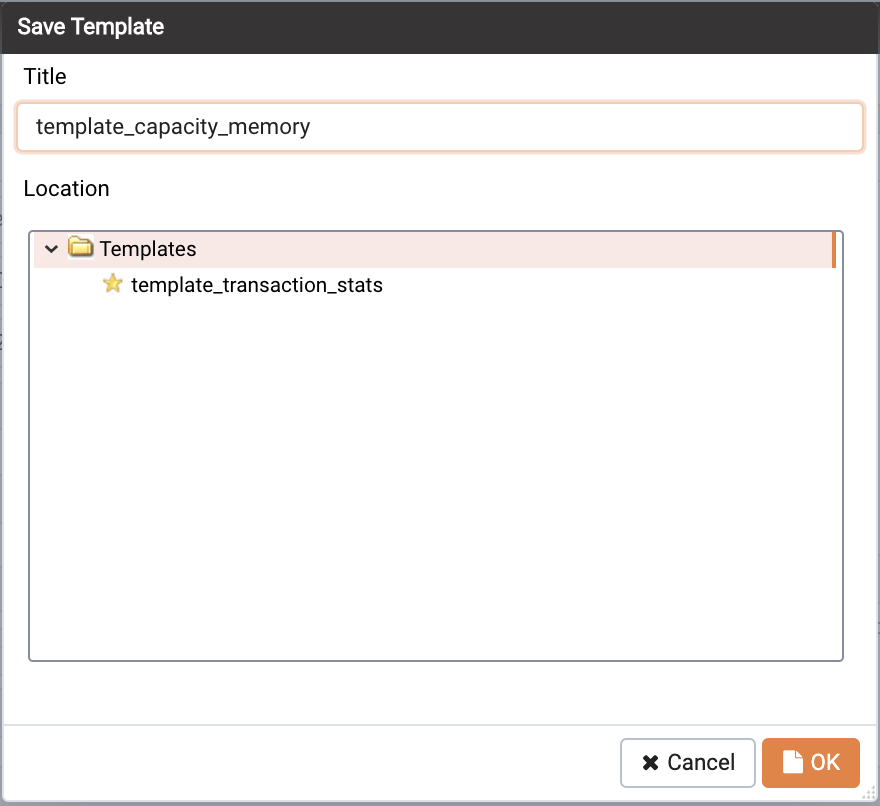
- Provide a report name in the
Titlefield, select a location to store the template in the tree control. - Click
OK.
When creating a report, you can use the Load Template button to browse and open an existing template. Once opened, the report definition may be modified if required, and optionally saved again, either as a new template, or overwriting the original template.
Use the Manage Templates button open a dialog that allows you to rename or remove unwanted templates.
Audit Manager
You can use the PEM Audit Manager to simplify audit log configuration for Advanced Server instances. With the Audit Manager, you can configure logging attributes such as:
- How often log files are to be collected by PEM
- The type of database activities that are included in the log files
- How often (and when) log files are to be rotated
Audit logs may include the following activities:
- All connections made to the database instance
- Failed connection attempts
- Disconnections from the database instance
- All queries (SELECT statements)
- All DML statements (INSERT, UPDATE, DELETE)
- All DDL statements (e.g., CREATE, DROP, ALTER)
Once the audit logs are stored on the PEM server, you can use the Audit Log dashboard to review the information in an easy-to-read form. The Audit Log dashboard allows you to filter the log file by timestamp range (when an activity occurred), the database on which the activity occurred, the user performing the activity, or the type of command being invoked.
Setting the Advanced Server Instance Service ID
To configure logging for an Advanced Server instance, the server must be a PEM-managed server with a bound agent, and the server registration must include the name of a service script. When registering a new server, include the service name in the Service ID field on the Advanced tab of the New Server dialog.
Before adding a service name to an existing (registered and connected) server, you must disconnect the server. Right click on the server name, and select Disconnect server from the context menu. Then, right click on the server name and select Properties from the context menu. Select the Advanced tab, and add a service name to the Service ID field.
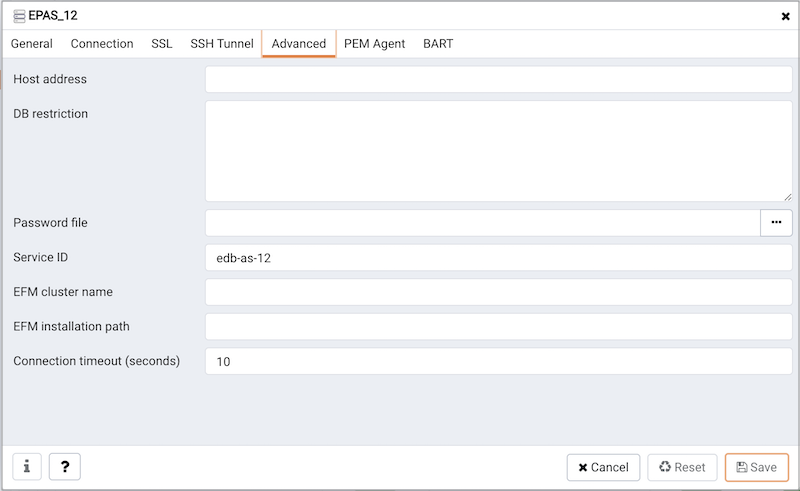
The Service ID field allows the PEM server to stop and start the service.
- The name of the Advanced Server 11 service script is
edb-as-12. - The name of the Advanced Server 11 service script is
edb-as-11. - The name of the Advanced Server 10 service script is
edb-as-10. - The name of the Advanced Server 9.6 service script is
edb-as-9.6. - The name of the Advanced Server 9.5 (or prior) service script is ppas-9.
x, wherexspecifies the version. - The name of the PostgreSQL 9.6 service script is
postgresql-11. - The name of the PostgreSQL 9.6 service script is
postgresql-10. - The name of the PostgreSQL 9.6 service script is
postgresql-9.6.
Setting the EDB Audit Configuration Probe
Before configuring audit logging of Advanced Server servers, you must ensure that the EDB Audit Configuration probe is enabled. To open the Manage Probes tab and check the status of the probe, right click on the name of a registered Advanced Server server in the tree control, and select Manage Probes... from the Management menu.
Ensure that the Enabled column in the Probe Configuration dialog is set to Yes for the EDB Audit Configuration probe.
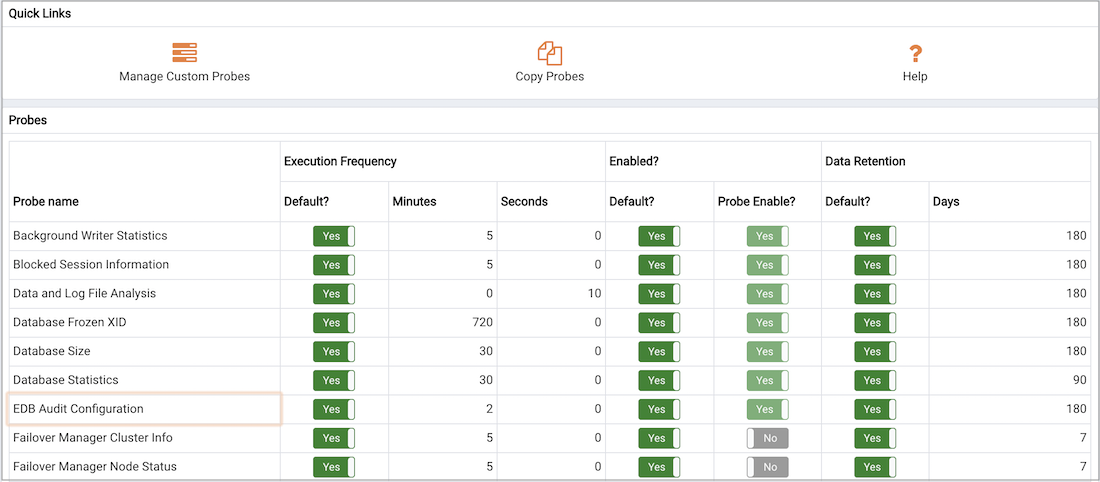
If EDB Audit Configuration is not enabled, use the Enabled? switch on the Manage Probes tab to enable it.
Configuring Audit Logging with the Audit Manager
To open the Audit manager wizard, select Audit Manager... from the Management menu. The Audit manager - Welcome dialog opens.
Click Next to continue.
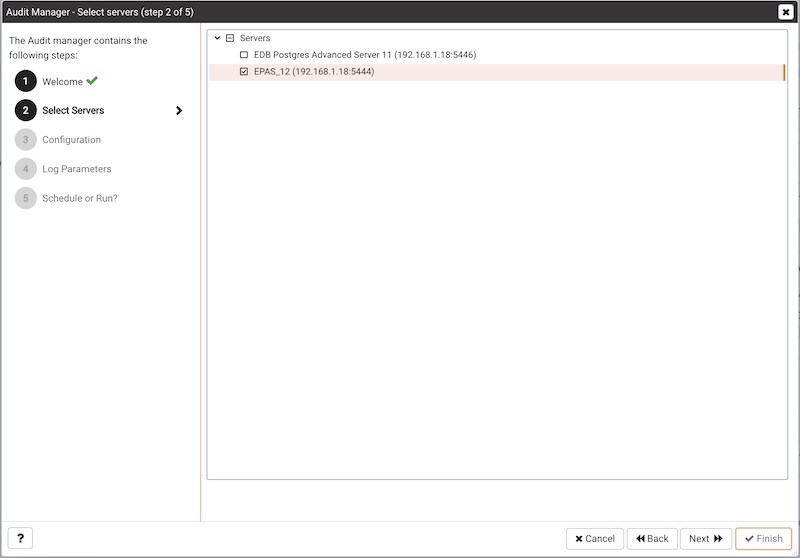
Use the Select servers tree control to specify the servers to which the auditing configuration will be applied. To make a server available in the tree control, you must provide the Service ID on the Advanced tab of the Create – Server dialog when registering a server for monitoring by PEM. Note that only EDB Postgres Advanced Server supports auditing; PostgreSQL servers will not be included in the tree control.
Click Next to continue.
The Auditing Parameters Configuration dialog lets you enable or disable auditing and choose how often log records are collected into PEM.
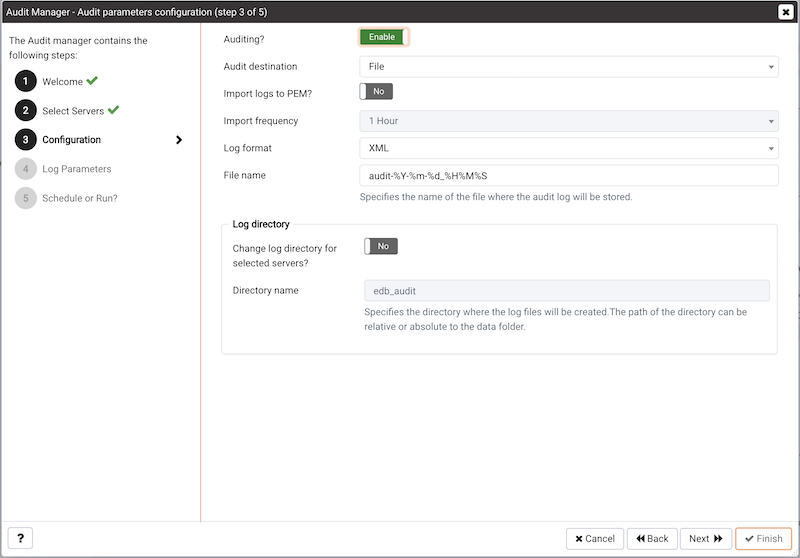
Use the fields on the Auditing parameters configuration dialog to specify auditing preferences:
Use the
Auditingswitch to Enable or Disable auditing on the specified servers.Use the
Audit destinationdrop-down to select a destination for the audit logs; select File or Syslog. Please note this feature is supported on Advanced Server 10 and newer releases only.Use the
Import logs to PEMswitch to instruct PEM to periodically import log records from each server to the PEM Server. Set the switch to Yes to import log files; the default is No.Use the
Collection frequencydrop-down listbox to specify how often PEM will collect log records from monitored servers when log collection is enabled.Use the
Log formatdrop-down listbox to select the raw log format that will be written on each server. If log collection is enabled, the PEM server will use CSV format.Use the
File namefield to specify the format used when generating log file names. By default, the format is set toaudit-%Y-%m-%d_%H%M%Swhere:auditis the file name specified in the Audit Directory Name field
Yis the year that the log was stored
mis the month that the log was stored
dis the day that the log was stored
His the hour that the log was stored
Mis the minute that the log was stored
Sis the second that the log was storedCheck the box next to
Change Log Directory for selected servers?and use theAudit Directory Namefield to specify a directory name to which the audit logs will be written. The directory will reside beneath the data directory on the PEM server.Use fields in the
Log directorybox to specify information about the directory in which the log files will be saved:Move the
Change log directory for selected servers?switch to Yes to enable the Directory name field.Use the
Directory namefield to specify the name of the directory on each server into which audit logs will be written. The directory specified will be created as a sub-directory of the data directory on the server.
Click Next to continue.
The Audit log configuration dialog is only available if you have enabled auditing on the Auditing parameters configuration dialog.
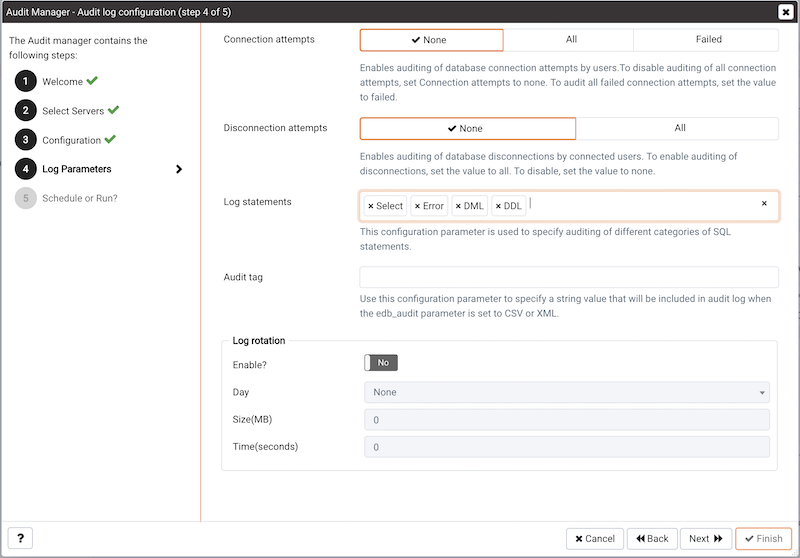
Use the controls on the Audit log configuration dialog to specify log configuration details that will be applied to each server:
Use the
Connection attemptsswitch to specify if connection attempts should be logged:Noneto disable connection logging.Allto indicate that all connection attempts will be logged.Failedto log any connection attempts that fail.Use the
Disconnection attemptsswitch to specify if disconnections should be logged. Specify:Noneto specify that disconnections should not be logged.Allto enable disconnection logging.Use the
Log statementsfield to specify the statement types that will be logged. Click within the field, and select from:Select- All statements that include theSELECTkeyword will be logged.Error- All statements that result in an error will be logged.DML- All DML (Data Modification Language) statements will be logged.DDL- All DDL (Data Definition Language) statements (those that add, delete or alter data) will be logged.Check the box next to
Select Allto select all statement types.Check the box next to
Unselect Allto deselect all statement types.Use the
Audit tagfield to specify a tracking tag for the collected logs. Please note that audit tagging functionality is available only for supported versions of Advanced Server.Use the fields in the
Log rotationbox to specify how the log files are managed on each server:Use the
Enable?switch to specify that logfiles should be rotated. Please note that a new log file should be used periodically to prevent a single file becoming unmanageably large.Use the
Day drop-downlistbox to select a day or days on which the log file will be rotated.Use the
Size (MB)field to specify a size in megabytes at which the log file will be rotated.Use the
Time (seconds)field to specify the number of seconds between log file rotations.
Click Next to continue:
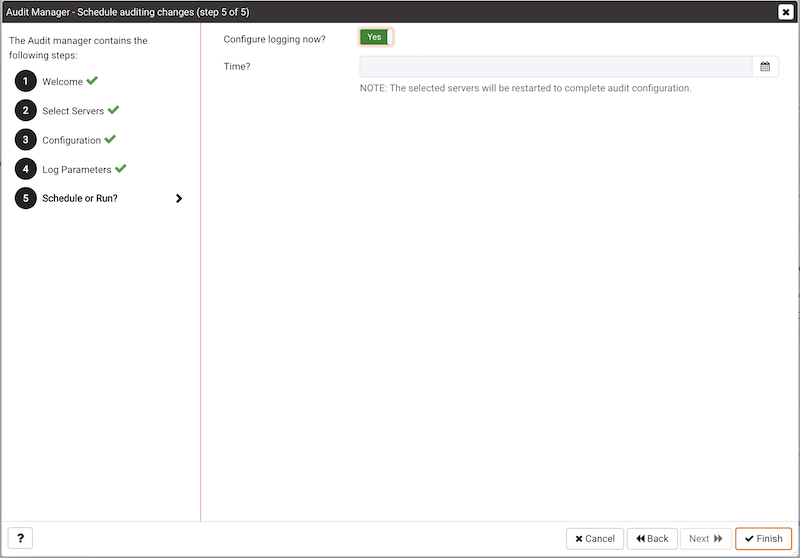
Use the Schedule Auditing Changes dialog to determine when auditing configuration changes are to take effect.
- Select
Configure logging now?if you want the auditing configuration changes to take place immediately. The affected database servers will be restarted so the auditing changes can take effect. - Use the
Time?selector to schedule the auditing configuration changes to take place at some point in the future. Select the desired date and time from the drop-down lists. The affected database servers will be restarted at the specified date/time to put the auditing changes into effect.
Click Finish to complete the auditing configuration process.
The Audit Manager will schedule a job to apply the configuration to each server. The job will consist of two tasks: one to update the audit logging configuration on the server, and one to restart the server with the new configuration.
You can use the Scheduled Tasks tab to review a list of Scheduled jobs. To open the Scheduled Tasks tab, highlight the name of a server or agent and select Scheduled Tasks... from the Management menu.
Viewing the Log with the Audit Log Dashboard
Use the Audit Log dashboard to view the audit log from Advanced Server database instances.
To open the Audit Log dashboard, right click on a server or agent node, and select Audit Log Analysis from the Dashboards menu. You can also open the Audit Log dashboard by navigating through the Dashboards menu (located on the Management menu).
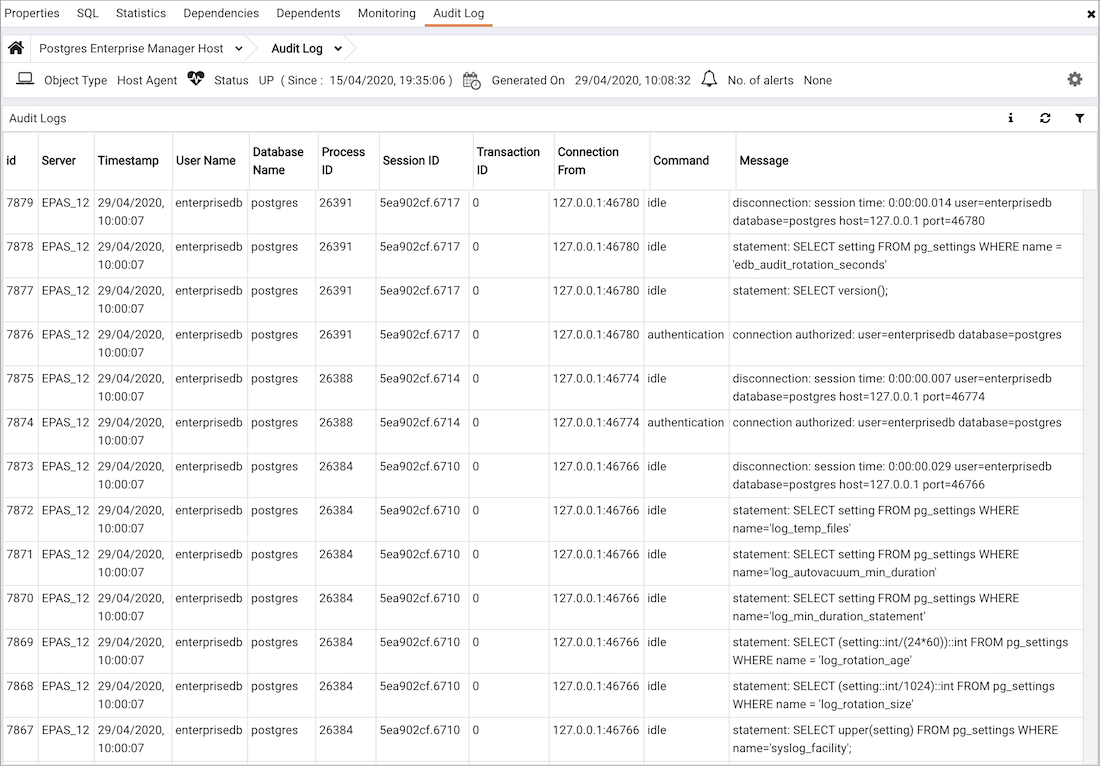
The Audit Log dashboard displays the audit records in reverse chronological order (newest records at the top, oldest records towards the bottom).
To view older audit records that do not appear in the window, use the vertical scroll bar controlling the list of audit records (the innermost scroll bar of the two located on the right-hand side of the window). As you move the scroll bar towards the bottom of the window, older audit records are continuously loaded and displayed.
You can use filtering to limit the number of audit records that are displayed. Click Show Filters to expose the filters panel.

Use the fields in the filters panel to provide certain selection criteria for the audit records you wish to display.
- Use the
Startfield to specify a start date for the report. Click the mouse button in the field to open a calendar and select a start date. - Use the
Endfield to specify an end date for the report. Click the mouse button in the field to open a calendar and select an end date. - Use the
Userfield to display only those entries where the activity was initiated by the given Postgres user. - Use the
Databasefield to display only those entries where the activity was issued on the given database. - Use the
Command typefield to display only those entries where the activity was of the given type. Command types you can specify are idle, authentication, and SELECT. (For viewing SQL statements from user applications, specify the idle command type.)
Click Filter to apply the filtering criteria to the log entries.
Log Manager
You can use the PEM Log Manager to simplify server log configuration for Postgres instances. With the Log Manager, you can modify all of your server log parameters with a click:
- Where log files are written
- How often log files are written
- The type of information written to log files
- The format of log file entries
- Log rotation properties
To configure logging for a Postgres instance, the server must be registered as a PEM-managed server, and the registration information must include the name of a service script.
To open the Log Manager, select the Log Manager... option from the Management menu of the PEM client. The wizard opens, welcoming you to the Log Manager.
Click Next to continue to the Server selection dialog.
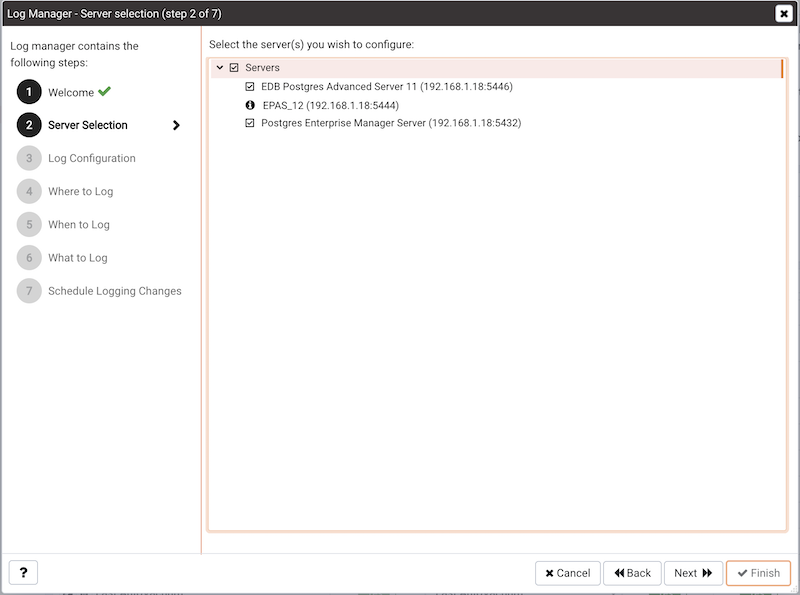
The Server selection dialog displays a list of the server connections monitored by PEM. Check the box next to the name of a server (or servers) to which the Log Manager wizard will apply the specified configuration. Log Manager is disabled for any server displaying a red exclamation mark to the left of its name in the Server selection tree control; there are several reasons that a server may not be enabled:
Only a server that specifies a
Service IDon theAdvancedtab of thePropertiesdialog can be configured by Log Manager.To provide a service ID, right click on the server name in the tree control, and select
Disconnect Serverfrom the context menu; if prompted, provide a password. Then, open the context menu for the server, and selectProperties. Navigate to theAdvancedtab, and provide the name of the service in theService IDfield; clickSaveto save your change and exit the dialog.If the PEM agent bound to the server does not have sufficient privileges to restart the server, the server will be disabled.
If the PEM agent bound to the server is an older version than the associated PEM server, the server will be disabled.
Click Next to continue.
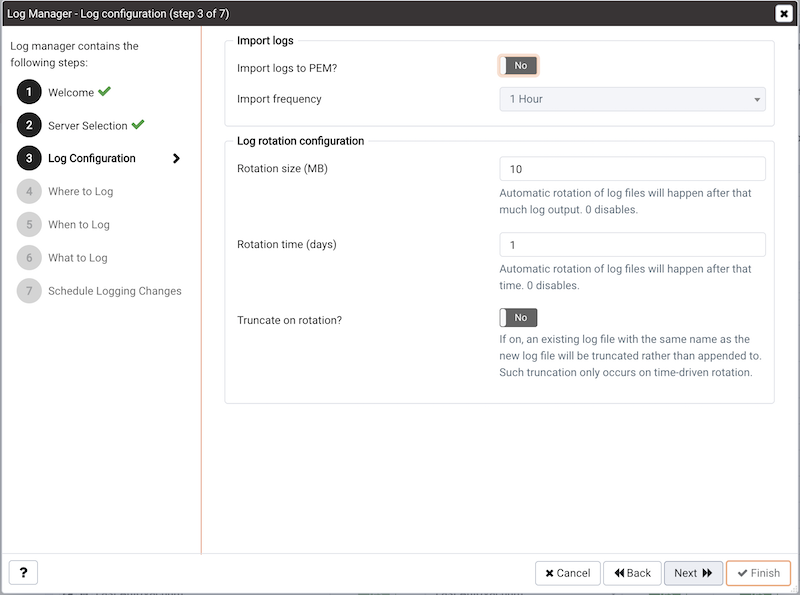
Use the options on the Log configuration dialog to specify how often log files will be inported to PEM and to specify log rotation details:
Options within the Import Logs box specify how often log files will be imported to PEM:
- Use the switch next to the
Import logs to PEMlabel to specify if log files will be imported to PEM and displayed on the Server Log Analysis dashboard. - Use the
Import Frequencydrop-down list box to specify how often log files are imported to PEM.
Use the fields in the Log rotation configuration box to specify the maximum length (lifespan or size) of a log file:
- Use the
Rotation Sizefield to specify the maximum size in megabytes of an individual log file. The default value is 10 MB; when set to 0, no limit is placed on the maximum size of a log file. - Use the
Rotation Timefield to specify the number of whole days that should be stored in each log file. The default value is 1 day.
Use the Truncation on Rotation switch to specify server behavior for time-based log file rotation:
- Select
ONto specify that the server should overwrite any existing log file that has the same name that a new file would take. - Select
OFFto specify that the server should append any new log file entries to an existing log file with the same name that a new log file would take. This is the default behavior.
Click Next to continue.
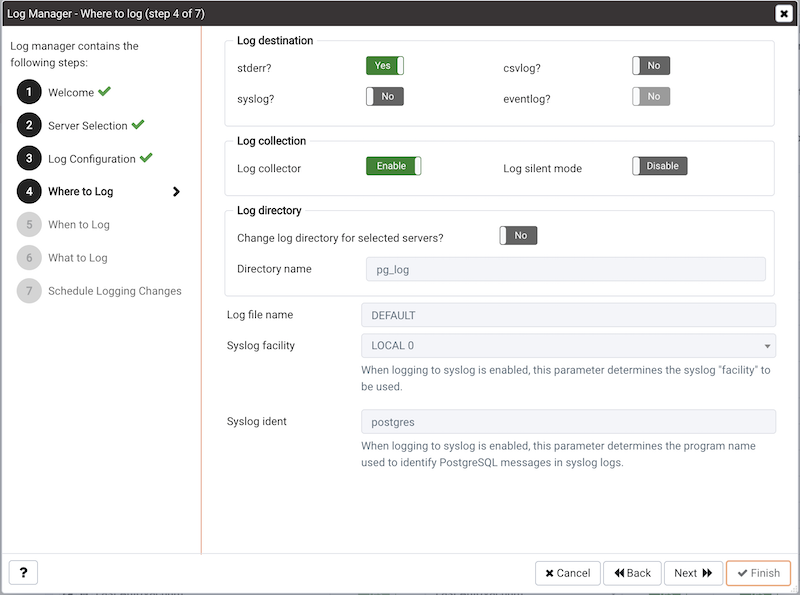
Use the fields on the Where to log dialog to specify where log files should be written.
Select an option from the
Log Destinationbox to specify a destination for the server log output:- Set the
stderrswitch toYesto specify that log files should be written to stderr. - Set the
csvlogswitch toYesto specify that log files should be written to file in a comma-separated value format. This option is automatically enabled (and no longer editable) if you have selectedImport logs to PEMon theScheduledialog; if you are not importing server log files to PEM, this option is editable. - Set the
syslogswitch toYesto specify that log files should be written to the system log files. - On Windows, set the
eventlogswitch to Yes to specify that log files should be written to the event log.
- Set the
Use the options within the
Log collectionbox to specify your collection preferences:- Set the
Log Collectorswitch toEnableto instruct the server to re-direct captured log messages (directed to STDERR) into log files. - Set the
Log Silent Modeswitch toEnableto instruct the server to run silently in the background, disassociated from the controlling terminal.
- Set the
Use options in the
Log Directorybox to specify log file location preferences:- Set the
Change log directory for selected servers?switch toYesto specify that each set of log files should be maintained in a separate directory. - Use the
Directory namefield to specify the directory to which log files will be written. The directory will reside beneath the pg_log directory under the installation directory of the monitored server.
- Set the
Use the
Log File Namefield to specify a format for the log file name. If set toDEFAULT, the format isenterprisedb-%Y-%m-%d_%H%M%S, where:enterprisedbis the file name prefixYis the year that the log was storedmis the month that the log was storedis the day that the log was storedHis the hour that the log was storedMis the minute that the log was storeSis the second that the log was stored
When logging to syslog is enabled:
- Use the
Syslog Facilitydrop-down list box to specify which syslog facility should be used. - Use the
Syslog Identfield to specify the program name that will identify Advanced Server entries in system logs.
- Use the
Click Next to continue.
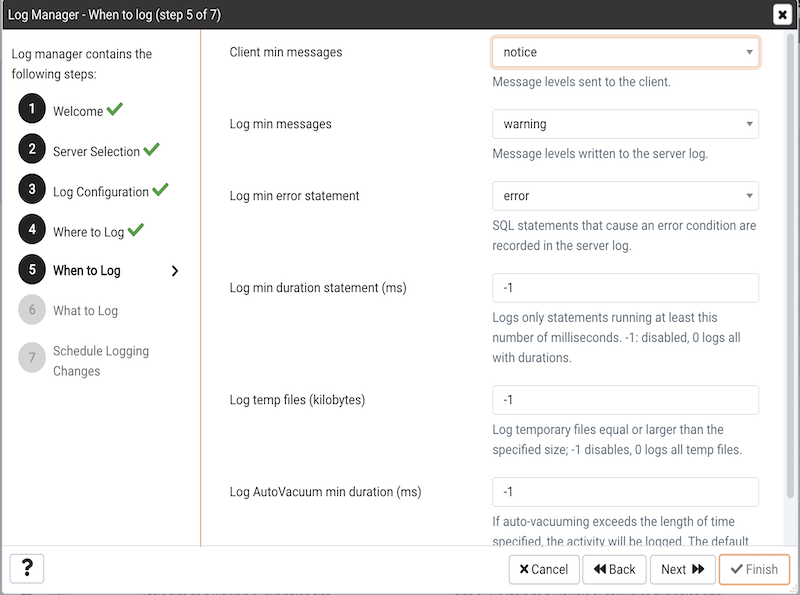
Use the fields on the When to log dialog to specify which events will initiate a log file entry. The severity levels (in order of severity, from most severe to least severe) are:
panic- Errors that cause all database sessions to abort.fatal- Errors that cause a session to abort.log- Information messages of interest to administrators.error- Errors that cause a command to abort.warning- Error conditions in which a command will complete but may not perform as expected.notice- Items of interest to users. This is the default.info- Information implicitly requested by the user.debug5throughdebug1- Detailed debugging information useful to developers.- Use the
Client min messagesdrop-down list box to specify the lowest severity level of message sent to the client application. - Use the
Log min messagesdrop-down list box to specify the lowest severity level that will be written to the server log. - By default, when an error message is written to the server log, the text of the SQL statement that initiated the log entry is not included. Use the
Log min error statementdrop-down list box to specify a severity level that will trigger SQL statement logging. If a message is of the specified severity or higher, the SQL statement that produced the message will be written to the server log. - Use the
Log min duration statementdrop-down list box to specify a statement duration (in milliseconds); any statements that exceed the specified number of milliseconds will be written to the server log. A value of-1disables all duration-based logging; a value of0logs all statements and their duration. - Use the
Log temp filesfield to specify a file size in kilobytes; when a temporary file reaches the specified size, it will be logged. A value of-1(the default) disables this functionality. - Use the
Log autoVacuum min durationfield to specify a time length in milliseconds; if auto-vacuuming exceeds the length of time specified, the activity will be logged. A value of-1(the default) disables this functionality.
Click Next to continue.
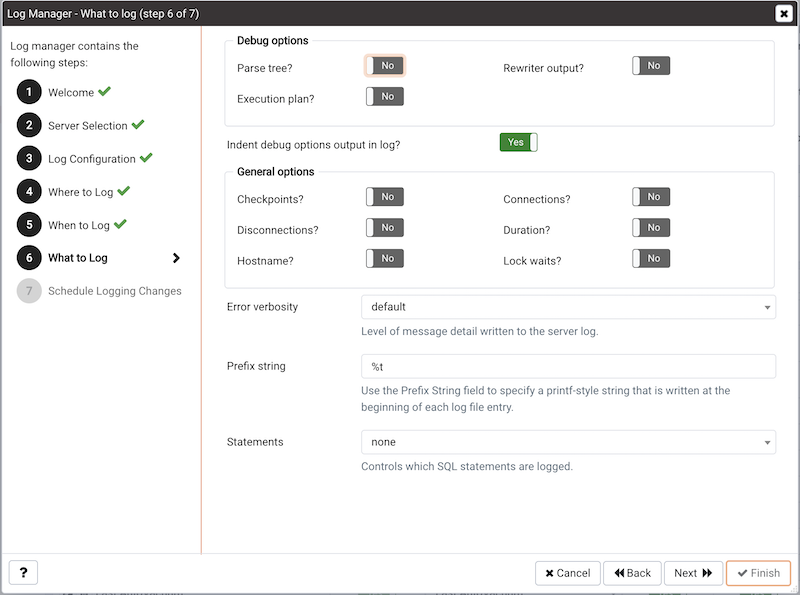
Use the fields on the What to log dialog to specify log entry options that are useful for debugging and auditing.
The switches in the Debug options box instruct the server to include information in the log files related to query execution that may be of interest to a developer:
- Set the
Parse treeswitch to Yes to instruct the server to include the parse tree in the log file. - Set the
Rewriter outputswitch to Yes to instruct the server to include query rewriter output in the log file. - Set the
Execution planswitch to Yes to instruct the server to include the execution plan for each executed query in the log file.
When the Indent Debug Options Output in Log switch is set to Yes, the server indents each line that contains a parse tree entry, a query rewriter entry or query execution plan entry. While indentation makes the resulting log file more readable, it does result in a longer log file.
Use the switches in the General Options box to instruct the server to include auditing information in the log file:
- Set the
Checkpointsswitch toYesto include checkpoints and restartpoints in the server log. - Set the
Connectionsswitch toYesto include each attempted connection to the server (as well as successfully authenticated connections) in the server log. - Set the
Disconnectionsswitch toYesto include a server log entry for each terminated session that provides the session information and session duration. - Set the
Durationswitch toYesto include the amount of time required to execute each logged statement in the server log. - Set the
Hostnameswitch toYesto include both the IP address and host name in each server log entry (by default, only the IP address is logged). Please note that this may cause a performance penalty. - Set the
Lock Waitsswitch toYesto instruct the server to write a log entry for any session that waits longer than the time specified in the deadlock_timeout parameter to acquire a lock. This is useful when trying to determine if lock waits are the cause of poor performance.
Use the Error verbosity drop-down list box to specify the detail written to each entry in the server log:
- Select
defaultto include the error message, DETAIL, HINT, QUERY and CONTEXT in each server log entry. - Select
terseto log only the error message. - Select
verboseto include the error message, the DETAIL, HINT, QUERY and CONTEXT error information, SQLSTATE error code and source code file name, the function name, and the line number that generated the error.
Use the Prefix string field to specify a printf-style string that is written at the beginning of each log file entry. For information about the options supported, please see the log_line_prefix documentation (in the Postgres core documentation), available at:
http://www.postgresql.org/docs/current/static/runtime-config-logging.html
Use the Statements drop-down list box to specify which SQL statements will be included in the server log. The default is none; valid options are:
- Specify
noneto disable logging of SQL statements. - Specify
ddlto instruct the server to log ddl (data definition language) statements, such as CREATE, ALTER, and DROP. - Specify
modto instruct the server to log all ddl statements, as well as all dml (data modification language) statements, such as INSERT, UPDATE, DELETE, TRUNCATE and COPY FROM. - Specify
allto instruct the server to log all SQL statements.
Click Next to continue.
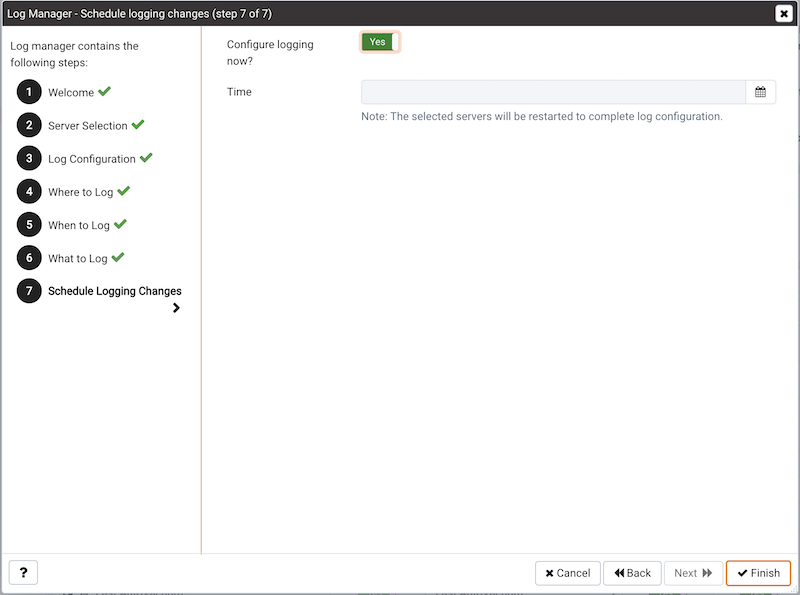
Use options on the Schedule logging changes dialog to specify when logging configuration changes will be applied:
- Set the
Configure logging nowswitch toYesto specify that your configuration preferences will be enabled, and the server will restart when you have completed the Log Manager wizard. - Set
Configure logging nowtoNoto use the Schedule it for some other time calendar selector to specify a convenient time for logging configuration preferences to be applied, and the server to restart.
Note that when you apply the configuration changes specified by the Log Manager wizard, the server restart will temporarily interrupting use of the database server for users.
Click Finish to exit the wizard, and either restart the server, or schedule the server restart for the time specified on the scheduling dialog.
Reviewing the Server Log Analysis Dashboard
After invoking the Log Manager wizard, and importing your log files to PEM, you can use the Server Log Analysis dashboard to review the log files for a selected server. To open the Server Log Analysis dashboard, right-click on the name of a monitored server in the PEM client tree control, and navigate through the Dashboards menu, selecting Server Log Analysis.
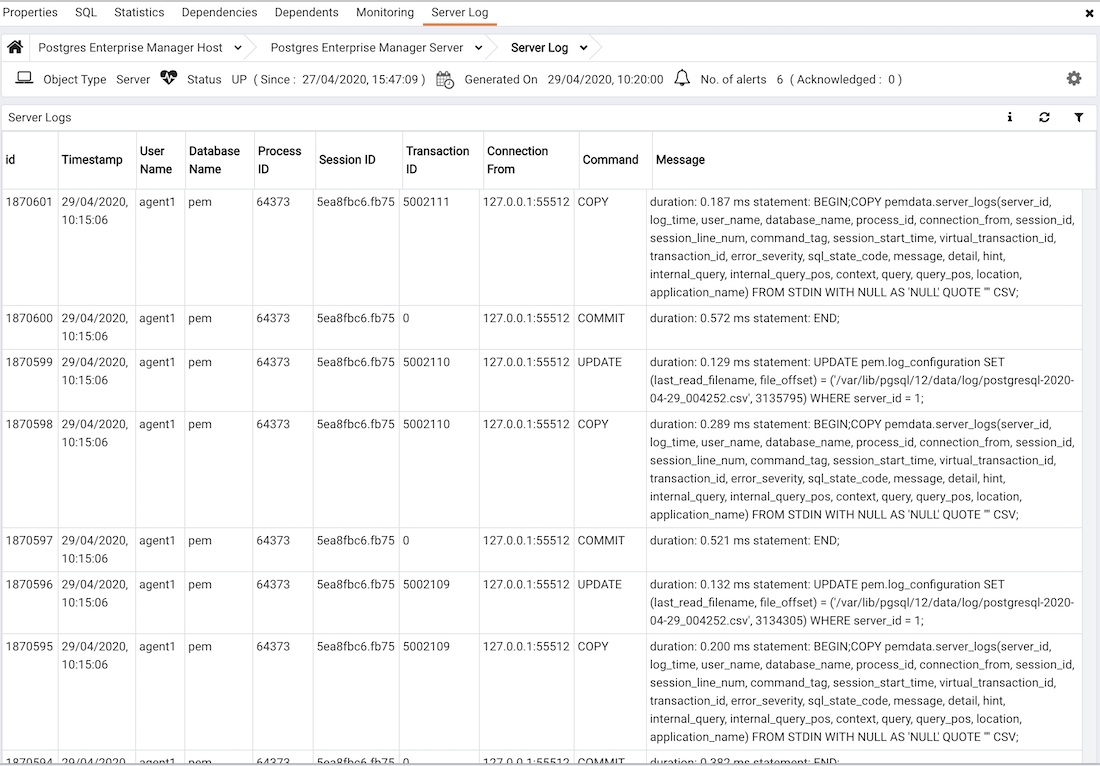
The header information on the Server Log Analysis dashboard displays the date and time that the server was started, the date and time that the page was last updated, and the current number of triggered alerts.
Entries in the Server Log table are displayed in chronological order, with the most-recent log entries first. Use the scroll bars to navigate through the log entries, or to view columns that are off of the display.
Headings at the top of the server log table identify the information stored in each column; hover over a column heading to view a tooltip that contains a description of the content of each column.
You can use filtering to limit the number of server log records that are displayed. Click Show Filters to expose the filters panel and define a filter.

Use the fields within the filter definition box to describe the selection criteria that PEM will use to select a subset of a report for display:
- Use the
Fromfield to specify a starting date for the displayed server log. - Use the
Tofield to specify an ending date for the displayed server log. - Enter a role name in the
Usernamefield display only transactions performed by that user. - Enter a database name in the
Database fieldto specify that the server should limit the displayed records to only those transactions that were performed against the specified database. - Use the
Command Typefield to specify a selection criteria for the commands that will be displayed in the filtered report.
When you’ve described the criteria by which you wish to filter the server logs, click Filter to display the filtered server log in the Server Log table.
Postgres Log Analysis Expert
The PEM Log Analysis Expert analyzes the log files of servers that are registered with Postgres Enterprise Manager, and produces a report that provides an analysis of your Postgres cluster’s usage based on log file entries. You can use information on the Log Analysis Expert reports to make decisions about optimizing your cluster usage and configuration to improve performance.
Before using the PEM Log Analysis Expert, you must specify the Service ID on the Advanced tab of the Server Properties dialog, and use the Log Manager wizard to enable log collection by the PEM server.
To open the Postgres Log Analysis Expert wizard, select the Postgres Log Analysis Expert... option from the Management menu of the PEM client. The wizard’s Welcome dialog opens; click Next to continue:
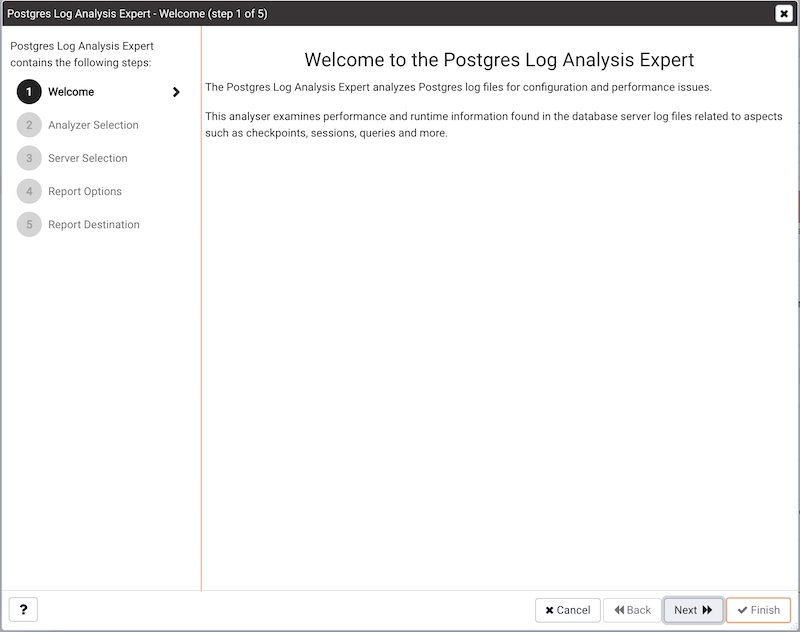
The wizard’s Analyzer selection dialog displays a list of Analyzers from which you can select. Each Analyzer generates a corresponding table, chart, or graph that contains information gleaned from the log files.
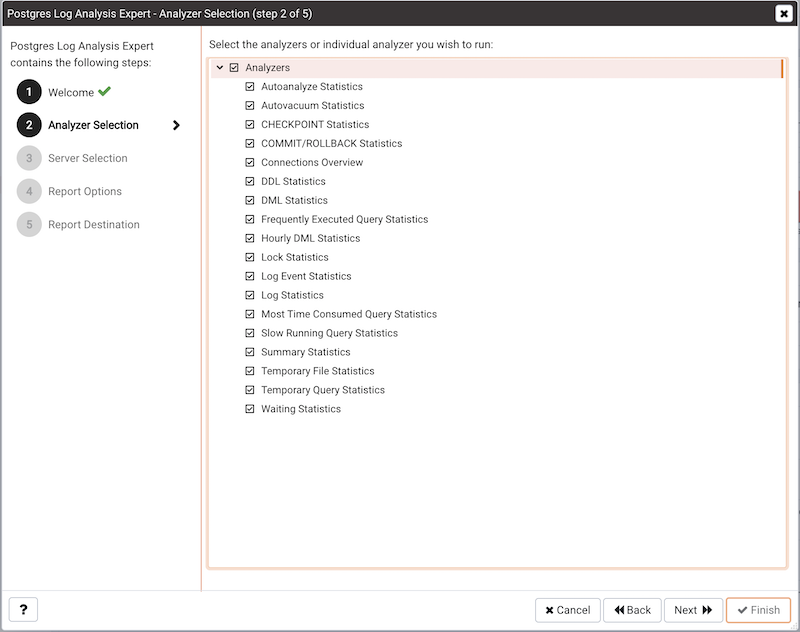
Check the box to the left of an Analyzer to indicate that the Log Analysis Expert should prepare the corresponding table, chart or graph. After making your selections, click Next to continue to the Server selection tree control.
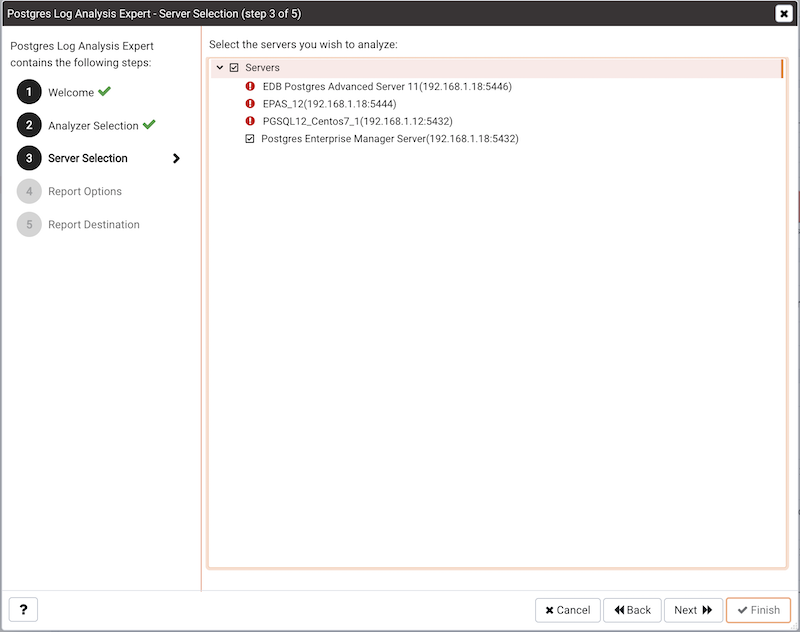
Use the tree control to specify which servers you would like the Postgres Log Analysis Expert to analyze. If you select multiple servers, the resulting report will contain the corresponding result set for each server in a separate (but continuous) list. Click Next to continue to the Report options dialog.
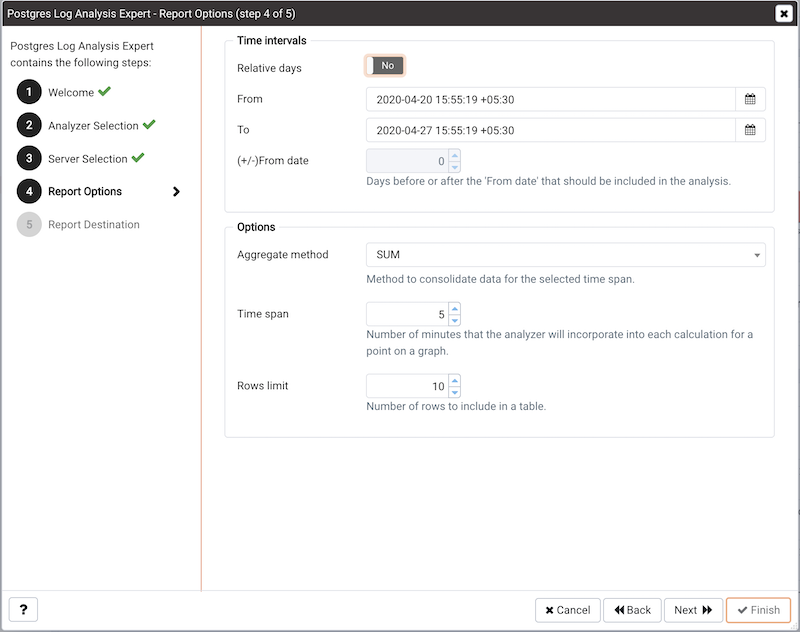
Use the fields in the Options section to specify the analysis method and the maximum length of any resulting tables:
- Use the
Aggregate methoddrop-down to select the method used by the Log Analysis Expert to consolidate data for the selected time span. You can select from:SUMinstructs the analyzer to calculate a value that is the sum of the collected values for the specified time span.AVGinstructs the analyzer to calculate a value that is the average of the collected values for the specified time span.MAXinstructs the analyzer to use the maximum value that occurs within a specified time span.MINinstructs the analyzer to use the minimum value that occurs within a specified time span.
- Use the
Time spanfield to specify the number of minutes that the analyzer will incorporate into each calculation for a point on a graph. For example, if the Time span is 5 minutes, and the Aggregate method is AVG, each point on the given graph will contain the average value of the activity that occurred within a five minute time span. - Use the
Rows limitfield to specify the maximum number of rows to include in a table.
Use the fields in the Time Intervals section to specify the time range that the Log Analysis Expert will analyze:
- Set
Relative daysto Yes to enable the (+/-)From date field and specify the number of days before or after the date and time selected in the From field. - Use the
Fromfield to specify the starting date and time for the analysis. - Use the
Tofield to specify the ending date and time for the analysis. - Use the
(+/-)From date selector to specify the number of days before or after the From date that should be included in the analysis.
When you’ve specified the report options, click Next to continue to the Report destination dialog.
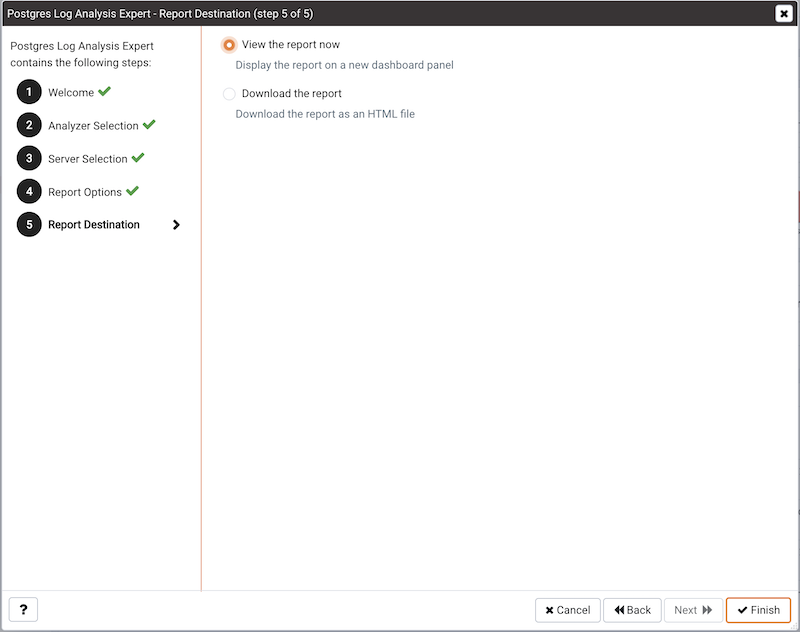
You can choose the default option and select Finish to view the Log Analysis Expert report in the PEM client’s tabbed browser, or click the radio button next to Download the report to save a copy of the report to an HTML file for later use.
If you have specified that the report should be saved to a file, the report will be downloaded.
Reviewing the Postgres Log Analysis Expert Report
If you’ve elected to review the report immediately, the Postgres Log Analysis Expert report will be displayed in the PEM Client window. The report header displays the date and time that the report was generated, the time period that the report spans, and the aggregation method specified when defining the report. The name of the server for which information is displayed is noted at the start of each section of the report.
The report displays the tables, graphs and charts that were selected in the Log Analysis Expert wizard. Use the Jump To button (located in the lower-right hand corner of the screen) to navigate to a specific graphic.
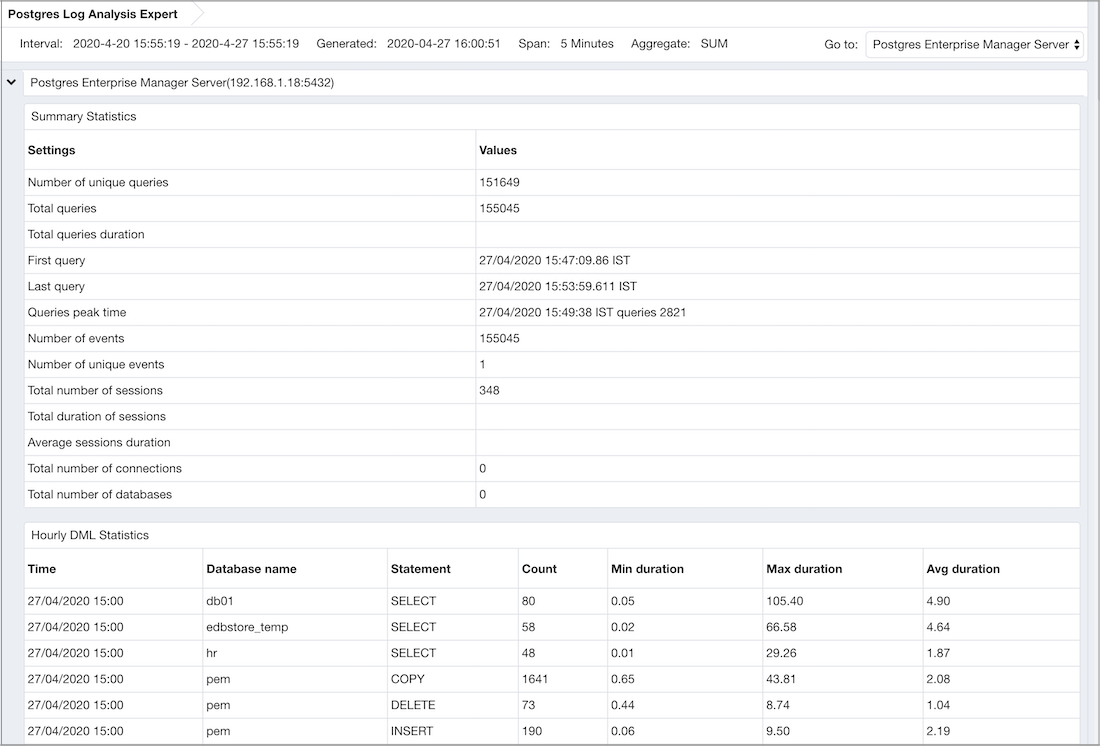
If the report contains an analysis of more than one monitored server, charts and tables will be displayed in sets; first the graphs, tables and charts that display statistics for one server, then the graphics for the next server in the report.
SQL Profiling and Analysis
Most RDBMS experts agree that inefficient SQL code is the leading cause of most database performance problems. The challenge for DBAs and developers is to locate the poorly-running SQL code in large and complex systems, and then optimize that code for better performance.
The SQL Profiler component allows a database superuser to locate and optimize poorly-running SQL code. Users of Microsoft SQL Server’s Profiler will find PEM’s SQL Profiler very similar in operation and capabilities. SQL Profiler is installed with each Advanced Server instance; if you are using PostgreSQL, you must download the SQL Profiler installer, and install the SQL Profiler product into each managed database instance you wish to profile.
For each database monitored by SQL Profiler, you must:
Edit the
postgresql.conffile; you must include the SQL Profiler library in the shared_preload_libraries configuration parameter.For Linux installations, the parameter value should include:
$libdir/sql-profileron Windows, the parameter value should include:
$libdir/sql-profiler.dllCreate the functions used by SQL Profiler in your database. The SQL Profiler installation program places a SQL script (named sql-profiler.sql) in the
share/postgresql/contribsubdirectory of the main PostgreSQL installation directory on Linux systems. On Windows systems, this script is located in thesharesubdirectory. You must invoke this script on the maintenance database specified when registering the server with PEM.Stop and re-start the server for the changes to take effect.
Please note: if you have connected to the PEM server with the PEM client before configuring SQL Profiler, you must disconnect and reconnect with the server to enable SQL Profiler functionality. For more detailed information about installing and configuring the SQL Profiler plugin, please refer to the PEM Installation Guide, available from the EDB website at:
http://enterprisedb.com/products-services-training/products/documentation
Creating a New SQL Trace
SQL Profiler captures and displays a specific SQL workload for analysis in a SQL trace. You can start and review captured SQL traces immediately, or save captured traces for review at a later time. You can use SQL Profiler to create and store up to 15 named traces; use menu options to create and manage traces.
Creating a Trace
You can use the Create trace... dialog to define a SQL Trace for any database on which SQL Profiler has been installed and configured. installed and configured. To access the dialog, highlight the name of the database in the PEM client tree control; navigate through the Management menu to the SQL Profiler pull-aside menu, and select Create trace….
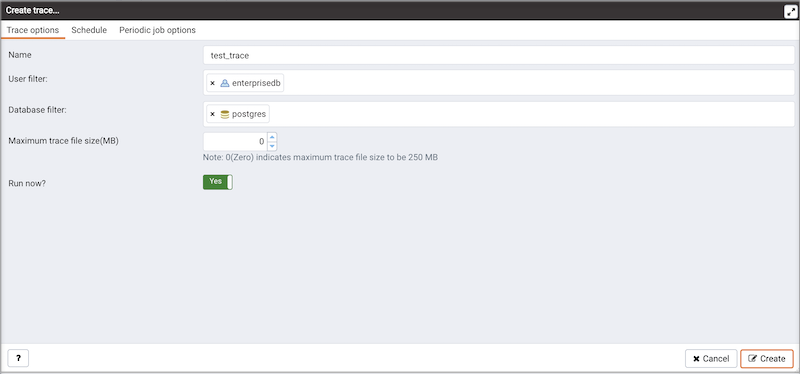
Use the fields on the Trace options tab to specify details about the new trace:
- Provide a name for the trace in the Name field.
- Click in the
User filterfield to specify the roles whose queries will be included the trace; optionally, check the box next to Select All to include queries from all roles. - Click in the
Database filterfield to specify which databases to trace; optionally, check the box next to Select All to include queries against all databases. - Specify a
trace size in the Maximum Trace File Sizefield; SQL Profiler will terminate the trace when it reaches approximately the size specified. - Specify Yes in the
Run Nowfield to start the trace when you select the Create button; select No to enable fields on the Schedule tab.
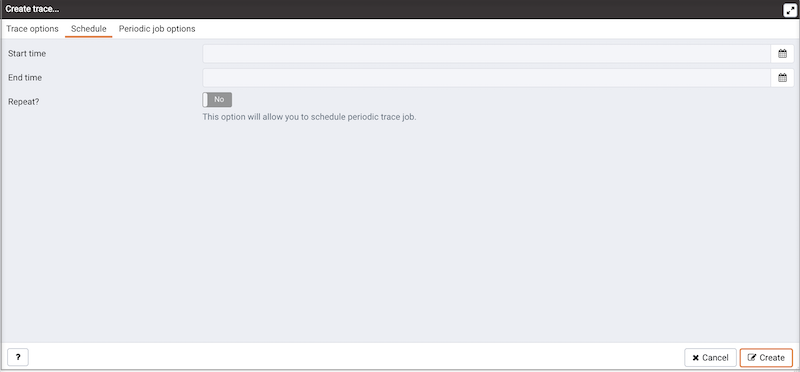
Use the fields on the Schedule tab to specify scheduling details for the new trace:
- Use the
Start timefield to specify the starting time for the trace. - Use the
End timefield to specify the ending time for the trace. - Specify Yes in the
Repeat?field to indicate that the trace should be repeated every day at the times specified; select No to enable fields on the Periodic job options tab.
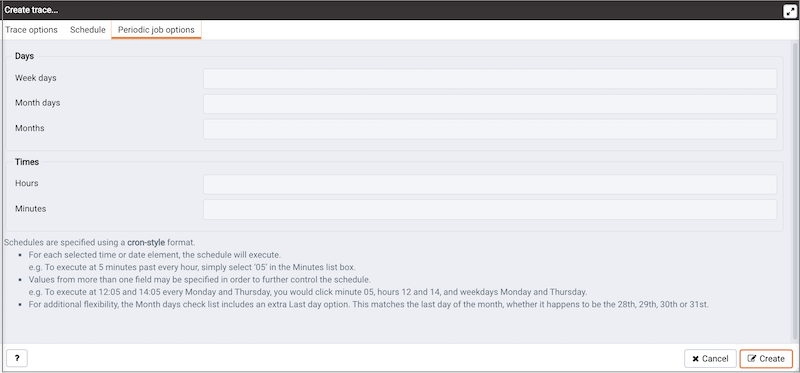
Fields on the Periodic job options tab specify scheduing details about a recurring trace. Use fields in the Days section to specify the days on which the job will execute:
- Click in the
Week daysfield to select the days of the week on which the trace will execute. - Click in the
Month daysfield to select the days of the month on which the trace will execute. - Click in the
Monthsfield to select the months in which the trace will execute.
Use fields in the Times section to specify a time schedule for the trace execution:
- Click in the
Hoursfield to select the hours at which the trace will execute. - Click in the
Minutesfield to select the hours at which the trace will execute.
When you’ve completed the Create trace... dialog, click Create to start the newly defined trace or to schedule the trace for a later time.
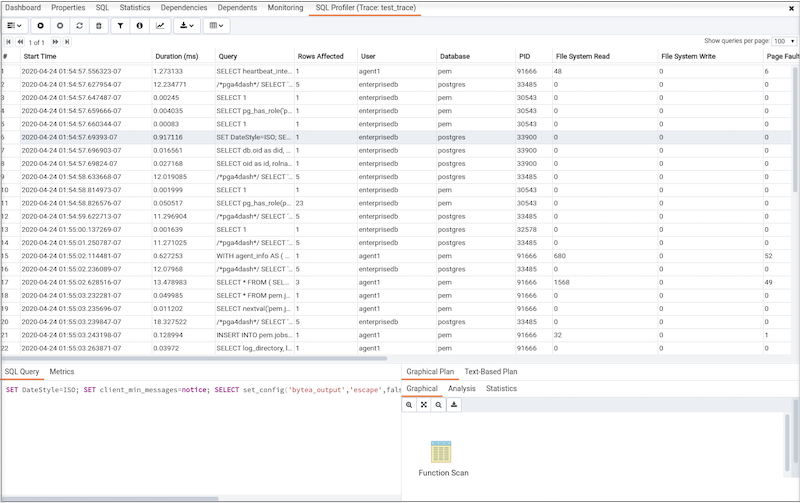
If you elect to execute the trace immediately, the trace results will display in the PEM client.
Opening an Existing Trace
To view a previous trace, highlight the name of the profiled database in the PEM client tree control; navigate through the Management menu to the SQL Profiler pull-aside menu, and select Open trace.... You can also use the SQL Profiler toolbar menu to open a trace; select the Open trace... option. The Open trace… dialog opens.
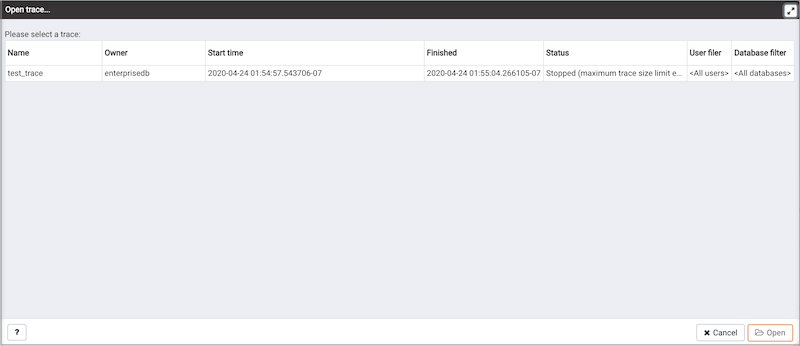
Highlight an entry in the trace list and click Open to open the selected trace. The selected trace opens in the SQL Profiler tab.
Filtering a Trace
A filter is a named set of (one or more) rules, each of which can hide events from the trace view. When you apply a filter to a trace, the hidden events are not removed from the trace, but are merely excluded from the display.
Click the Filter icon to open the Trace Filter dialog and create a rule (or set of rules) that define a filter. Each rule will screen the events within the current trace based on the identity of the role that invoked the event, or the query type invoked during the event.
To open an existing filter, select the Open button; to define a new filter, click the Add (+) icon to add a row to the table displayed on the General tab and provide rule details:
- Use the
Typedrop-down listbox to specify the trace field that the filter rule will apply to. - Use the
Conditiondrop-down listbox to specify the type of operator that SQL Profiler will apply to the Value when it filters the trace:- Select
Matches tofilter events that contain the specified Value. - Select
Does not matchto filter events that do not contain the specified Value. - Select
Is equal toto filter events that contain an exact match to the string specified in the Value field. - Select
Is not equalto to filter events that do not contain an exact match to the string specified in the Value field. - Select
Starts withto filter events that begin with the string specified in the Value field. - Select
Does not start withto filter events that do not begin with the string specified in the Value field. - Select
Less thanto filter events that have a numeric value less than the number specified in the Value field. - Select
Greater thanto filter events that have a numeric value greater than the number specified in the Value field. - Select
Less than or equal toto filter events that have a numeric value less than or equal to the number specified in the Value field. - Select
Greater than or equal toto filter events that have a numeric value greater than or equal to the number specified in the Value field.
- Select
- Use the
Valuefield to specify the string, number or regular expression that SQL Profiler will search for.
When you’ve finished defining a rule, click the Add (+) icon to add another rule to the filter. To delete a rule from a filter, highlight the rule and click the Delete icon.
Click the Save button to save the filter definition to a file without applying the filter; to apply the filter, click OK. Select Cancel to exit the dialog and discard any changes to the filter.
Deleting a Trace
To delete a trace, highlight the name of the profiled database in the PEM client tree control; navigate through the Management menu to the SQL Profiler pull-aside menu, and select Delete trace(s).... You can also use the SQL Profiler toolbar menu to delete a trace; select the Delete trace(s)... option. The Delete traces dialog opens.
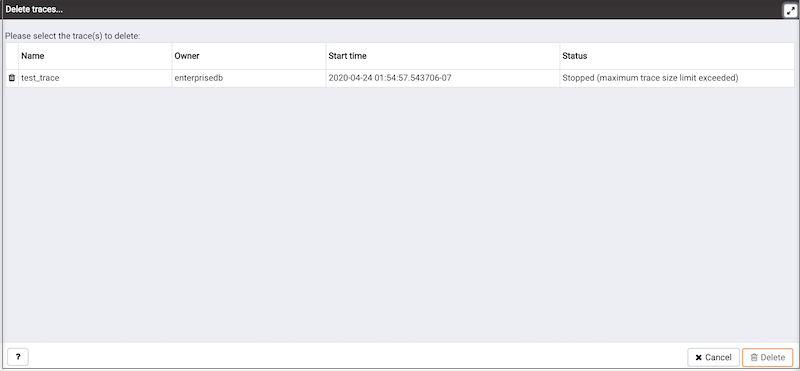
Click the icon to the left of a trace name to mark one or more traces for deletion and click Delete. The PEM client will acknowledge that the selected traces have been deleted.
Viewing Scheduled Traces
To view a list of scheduled traces, highlight the name of the profiled database in the PEM client tree control; navigate through the Management menu to the SQL Profiler pull-aside menu, and select Scheduled traces... You can also use the SQL Profiler toolbar menu to the list; select the Scheduled traces... option.
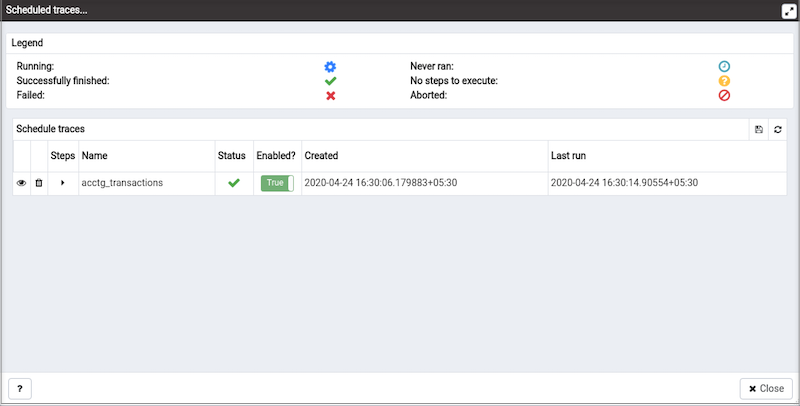
The Scheduled traces... dialog displays a list of the traces that are awaiting execution. Click the edit button to the left of a trace name to access detailed information about the trace:
- The
Statusfield lists the status of the current trace. - The
Enabled?switch displays Yes if the trace is enabled; No if it is disabled. - The
Namefield displays the name of the trace. - The
Agentfield displays the name of the agent responsible for executing the trace. - The
Last runfield displays the date and time of the last execution of the trace. - The
Next runfield displays the date and time of the next scheduled trace. - The
Createdfield displays the date and time that the trace was defined.
Using the Index Advisor
Index Advisor is distributed with Advanced Server 9.0 and above. Index Advisor works with SQL Profiler by examining collected SQL statements and making indexing recommendations for any underlying tables to improve SQL response time. The Index Advisor works on all DML (INSERT, UPDATE, DELETE) and SELECT statements that are invoked by a superuser.
Diagnostic output from the Index Advisor includes:
- Forecasted performance benefits from any recommended indexes
- The predicted size of any recommended indexes
- DDL statements you can use to create the recommended indexes
Before using Index Advisor, you must:
Modify the
postgresql.conffile on each Advanced Server host, adding the index_advisor library to the shared_preload_libraries parameter.Install the
Index Advisor contribmodule. To install the module, use the psql client or PEM Query Tool to connect to the database, and invoke the following command:\i <complete_path>/share/contrib/index_advisor.sqlRestart the server for your changes to take effect.
Index Advisor can make indexing recommendations based on trace data captured by SQL Profiler. Simply highlight one or more queries in the SQL Profiler Trace Data pane, and click the Index Advisor toolbar button (or select Index Advisor from the View menu). For detailed usage information about Index Advisor, please see the EDB Postgres Advanced Server Guide.
Please note: Index Advisor cannot analyze statements invoked by a non-superuser. If you attempt to analyze statements invoked by a non-superuser, the server log will include the following error:
ERROR: access to library "index_advisor" is not allowed
For more information about configuring and using Index Advisor, please see the EDB Postgres Advanced Server Guide, available from EDB at:
https://www.enterprisedb.com/docs
Tuning Wizard
The Tuning Wizard reviews your PostgreSQL or Advanced Server installation, and recommends a set of configuration options that will help tune the installation to best suit its anticipated workload. Please note that benchmarking systems or systems with a high work load may require additional manual tuning to reach optimum performance.
Before using the Tuning Wizard, you must specify the name of the service in the Service ID field on the Advanced tab of the server’s Properties dialog. PEM will use the service name when restarting the service after tuning.
The Tuning Wizard can only make recommendations for those servers that reside on the same server as their bound PEM agent. If you have specified a value of Yes in the Remote monitoring field when defining your server, the server will not be displayed in the Tuning Wizard tree control.
To open the Tuning Wizard, select Tuning Wizard... from the Management menu of the PEM client. The Tuning Wizard opens, welcoming you.
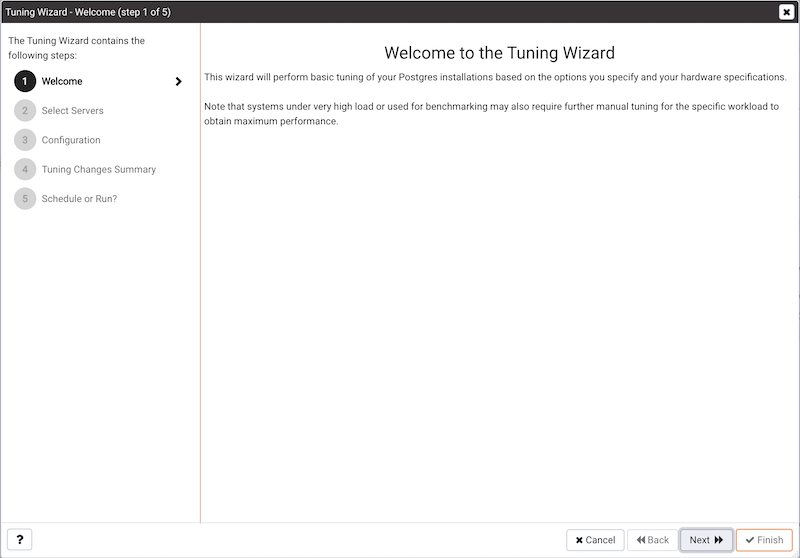
Click Next to continue to the server selection dialog.
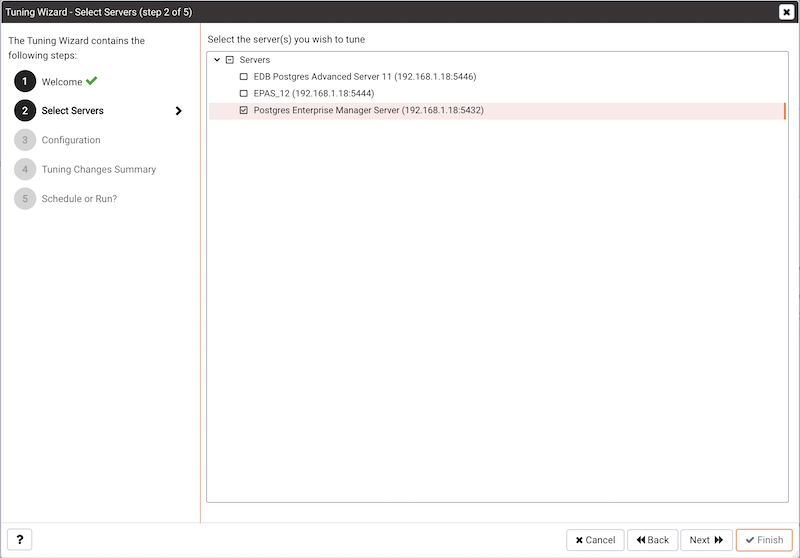
Expand the Servers node of the tree control to view a list of the servers that are currently monitored by PEM that are available for tuning. Check a box to the left of a server name to select the server for tuning.
Note The Tuning Wizard displays a red warning symbol to the left of a server name in the tree control if the service name for that server is not provided on the server’s Properties dialog.
Click Next to continue to the Configuration dialog.
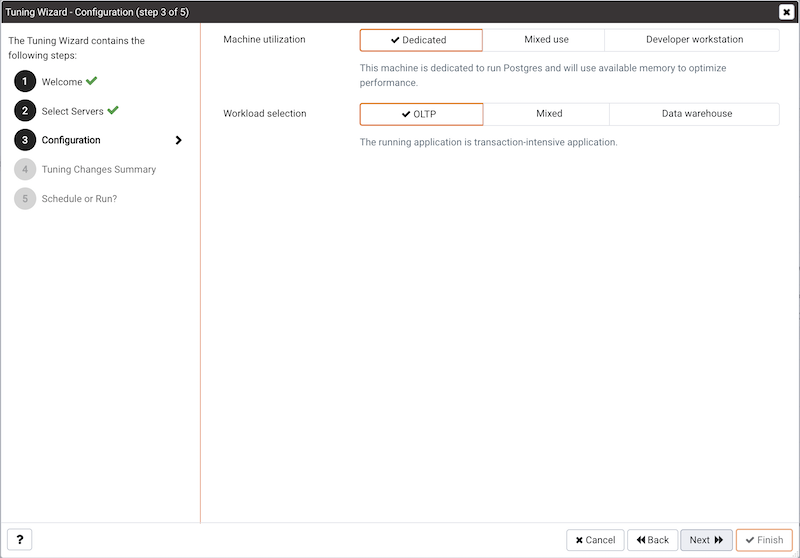
Select an option in the Machine utilization field to specify the type of work performed by the selected servers. The type of work performed by the server determines how the tuning wizard will allocate system resources:
- Select
Dedicatedto dedicate the majority of the system resources to the database server. - Select
Mixed useto dedicate a moderate amount of system resources to the database server. - Select
Developer workstationto dedicate a relatively small amount of system resources to the database server.
Select an option in the Workload Selection field to specify the type of workload typically performed on the selected server:
- Select
OLTPif the selected server is used primarily to process online transaction workloads. - Select
Mixedif the selected server provides a mix of transaction processing and data reporting. - Select
Data warehouseif the server is used for heavy data reporting.
Click Next to continue to the Tuning Changes Summary dialog.
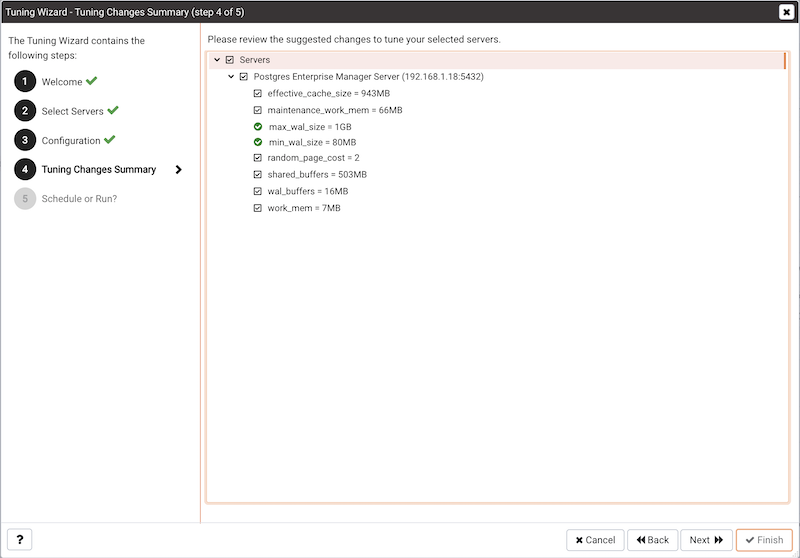
The tree control on the Tuning Changes Summary dialog displays the parameter setting modifications recommended for each server analyzed by the Tuning Wizard. Use the checkboxes next to a server or parameter name to select the recommendations that tuning wizard will either include in a preview report or apply:
- A checked box to the left of a parameter name specifies that the Tuning Wizard will include the parameter setting.
- A checked box to the left of a server name specifies that the Tuning Wizard will include all parameter setting recommendations for the specified server.
Specify which Tuning Wizard recommendations you wish to include in a report or apply, and click Next to continue.
Use the Schedule or Run? dialog to either specify a time that PEM will apply the changes, or generate a report that details the recommended changes.
The selected actions will apply to all of the changes noted on the Tuning Changes Summary. If you opt to generate a report, PEM will create a report that contains a list of the current values and recommended modifications to the configuration parameters selected on the Tuning Changes Summary dialog. Note that to implement changes, you will need to invoke the Tuning Wizard a second time, specifying the parameters you wish to modify on the Tuning Changes Summary dialog.
Select Schedule changes to view and specify your scheduling options.
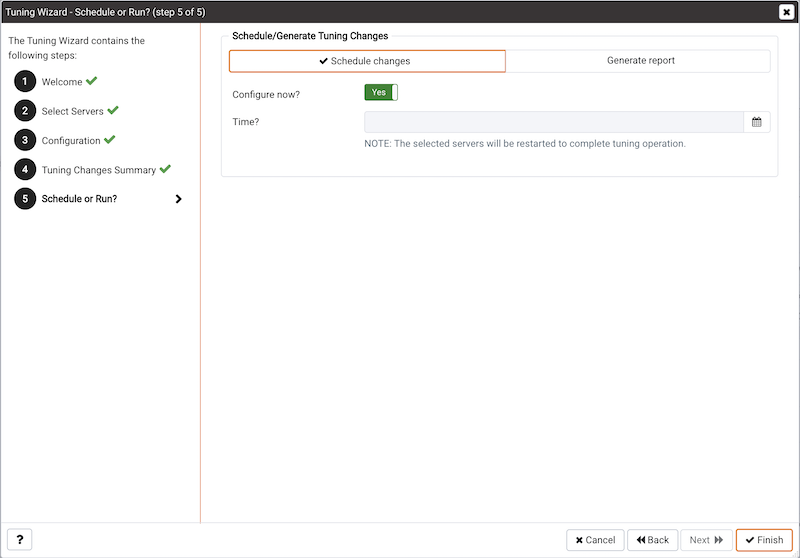
You can:
- Set the
Configuration now?slider toYesto apply the tuning wizard’s recommendations and restart the server now. - Set the
Configuration now?slider toNoto enable the Time? field and use the calendar selector to specify a time for PEM to apply the tuning wizard’s recommendations and restart the server. Note that if you schedule a time for the changes to be applied, you will not be provided with a preview of the change recommendations.
Select Generate report to view your report options.
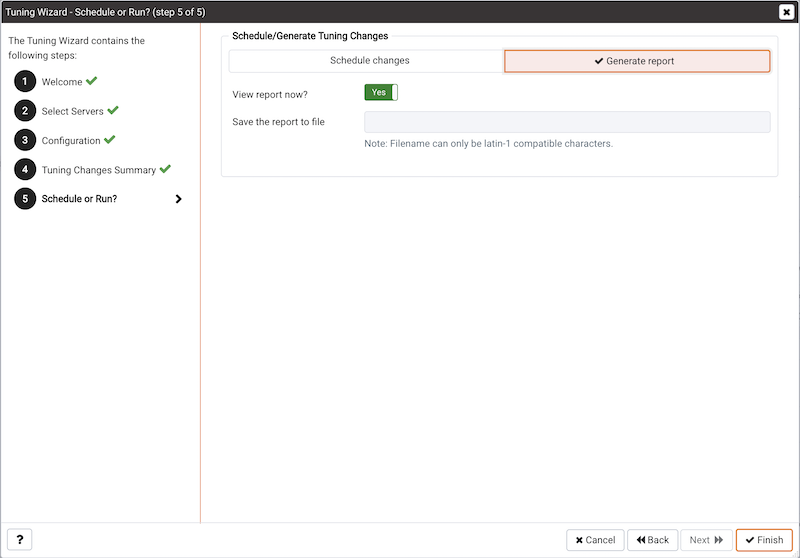
You can:
- Set the
View report now?slider toYesto display the Tuning Wizard report onscreen. - Set the
View report now?slider toNoto enable theSave the report to filefield and use the calendar selector to specify a file name and location to which PEM will write the Tuning Wizard report.
Click the Finish button to either apply the Tuning Wizard’s modifications or generate a report and exit the Tuning Wizard.
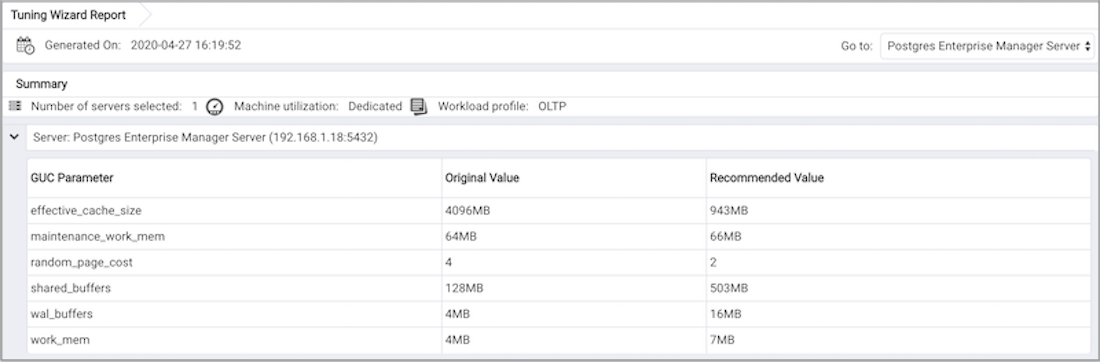
You can confirm that Tuning Wizard has implemented the recommended changes by reviewing the postgresql.conf file for the modified server. The Tuning Wizard adds a comment above each modified parameter in the postgresql.conf file when the change is applied.
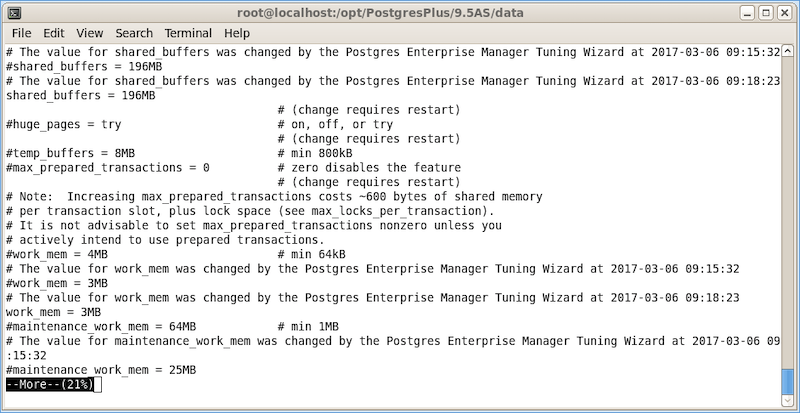
You can also confirm a parameter value by querying the server. For example, to confirm the value of the shared_buffers parameter, open a SQL command line using either the Query Tool (accessed through the Tools menu) or the psql client, and issue the command:
SHOW shared_buffers;
The value returned by the server will confirm that the parameter has been modified.
Postgres Expert - Best Practice Enforcement
The Postgres Expert utility provides expert advice on how to best configure your Postgres servers for optimal performance, security, and more. Postgres Expert serves as a PostgreSQL ‘DBA in a box’ by analyzing your servers for deviations in best practices. Postgres Expert contains three specialized Experts:
- The Configuration Expert.
- The Schema Expert.
- The Security Expert.
You can select specific rules for each Expert to analyze, or accept all rules, and then review Postgres Expert reports detailing any best practice issues that require your attention.
Using the Postgres Expert Wizard
To use the Postgres Expert wizard select the Postgres Expert option from the Management menu in the PEM client. When the wizard’s Welcome window opens, click Next to continue.
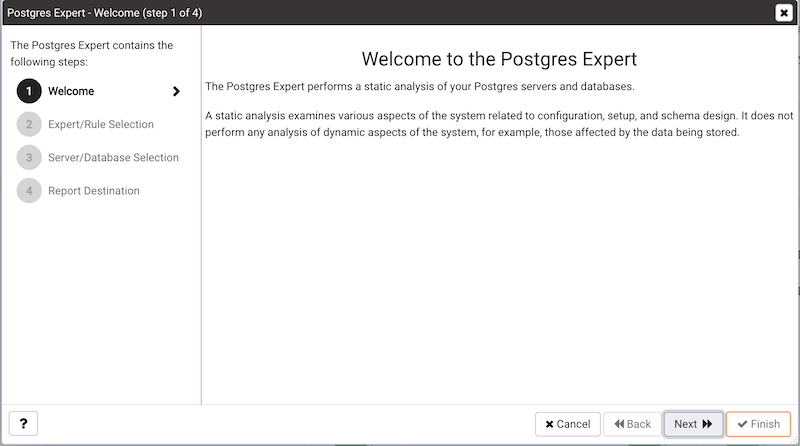
The wizard displays a tree control that allows you to choose the Experts and Rules with which Postgres Expert will evaluate the specified server or database.
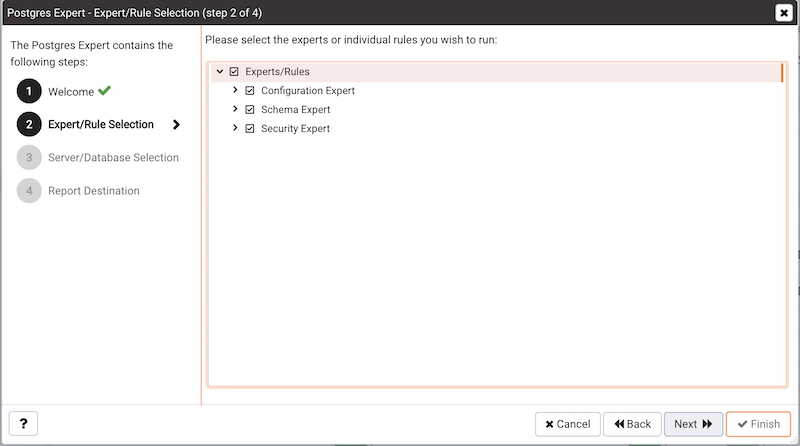
The tree control categorizes the rules under three Expert headings:
- Select from the
Configuration Expert rulesto analyze the parameter settings of the server or operating system to find any adjustments that might improve system performance. - Select from the
Schema Expert rulesto analyze schema objects (locating missing primary keys, foreign keys without indexes, etc). - Select from the
Security Expert rulesto review the system to find security vulnerabilities.
Use the checkmark indicator to the left of an expert or rule to indicate that the Postgres Expert should analyze the configuration of the selected servers for any best practice deviations related to the checked item.
You can:
- Check the box next to the name of an expert to select or deselect all of the configuration items listed under that node of the tree control.
- Check the box next to
Servers/Databasesto instruct Postgres Expert to review the selected server for all of the items in the tree control. - Deselect the box next to
Servers/Databasesto to un-check all of the rules; then, navigate through the tree control, specifying only the items that you wish Postgres Expert to evaluate.
After making your selections, click Next to continue to the Server/Databases tree control.
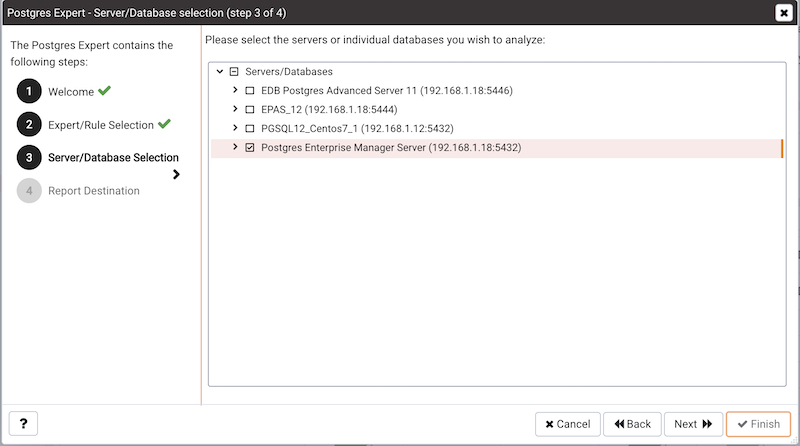
Select or de-select the servers and databases that you would like Postgres Expert to analyze. If you select multiple servers or databases, the resulting report will contain a separate analysis of each target. When you’ve finished, click Next to select a report destination.
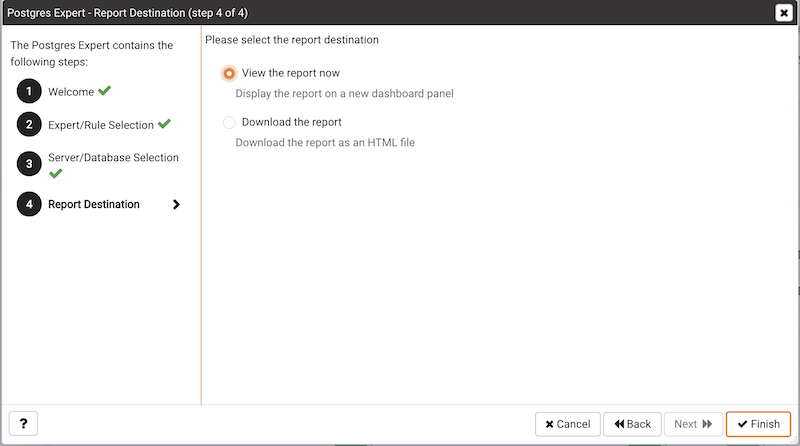
You can select the default option and click Finish to view an onscreen report from Postgres Expert, or check the box next to Download the report to save a copy of the report to an HTML file for later use. If you choose to save the report to a file, the download will begin immediately. The file will be saved in your default download directory.
Reviewing Postgres Expert Recommendations
Postgres Expert produces an easily navigated report that contains an analysis of the selected rules, categorized by high, medium, and low severities, for the selected servers.
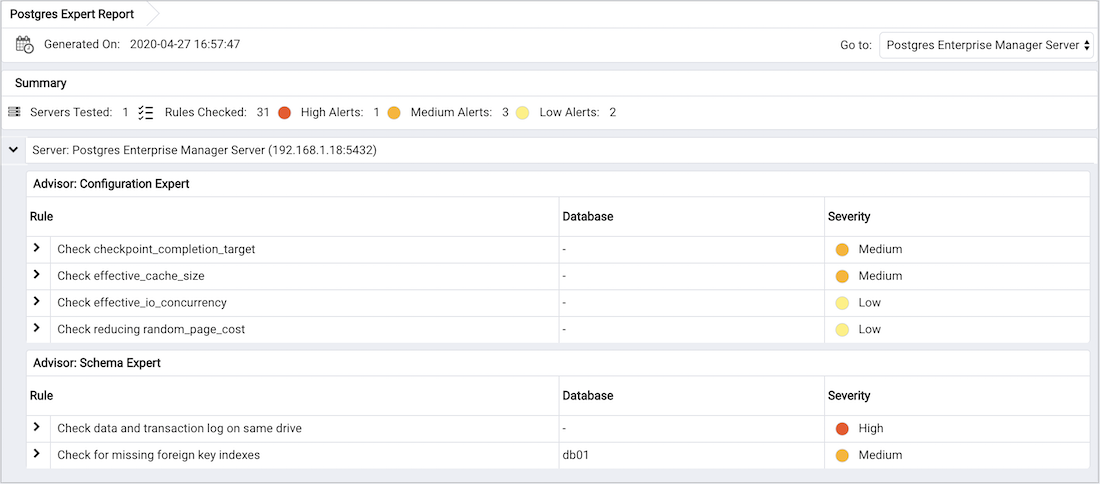
The report header contains a summary of the report, and includes the date and time that the report was generated, the number of rules analyzed, and the number of deviations from best practices found by Postgres Expert. Use the Jump to drop-down listbox to select a server to navigate to the section of the report that targets recommendations for that server.
The body of the report contains the detailed findings for each server selected for analysis. The findings are sorted by Expert; within each Expert heading, any rule violations are ranked by Severity.
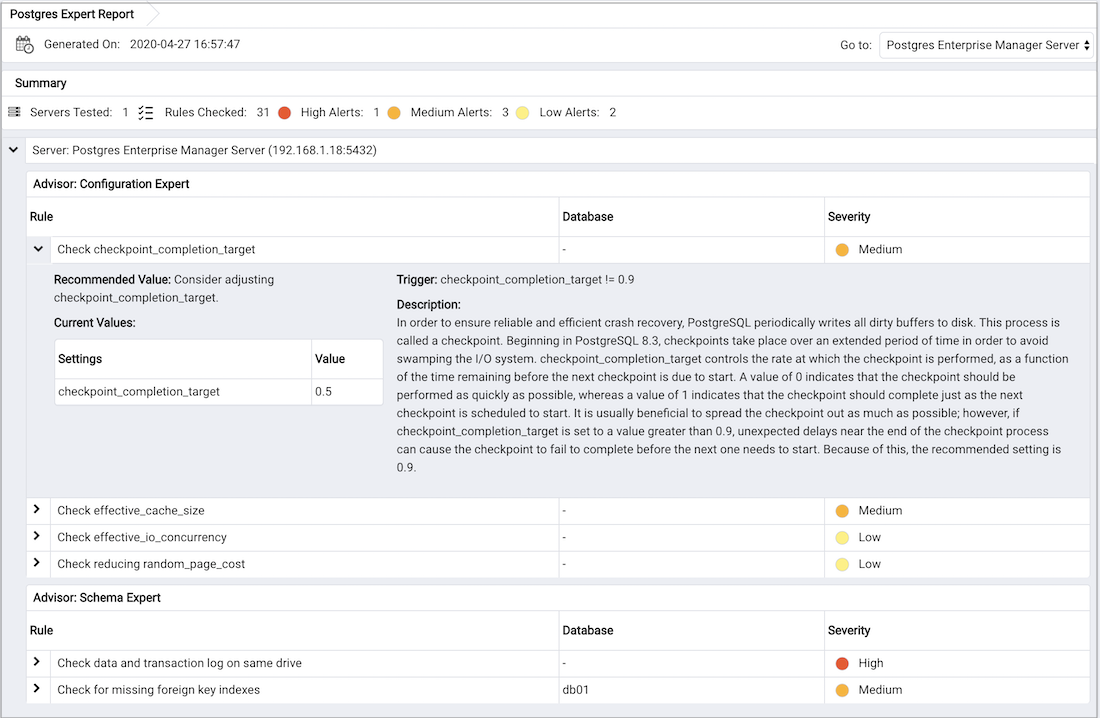
Click on each rule in the Postgres Expert report to display details and recommendations for that rule. Within each rule, section headings display:
- The
Advisorsection lists the name of the Postgres Expert advisor that prompted the recommendation. - The
Triggersection displays a description of the rule that raised the alert. - The
Recommended Valuesection displays the value to which Postgres Expert recommends setting the selected parameter. - The
Descriptionsection displays information and advice about the parameter that caused the alert. - The
Current Valuessection displays the current value(s) of any parameter(s) that influence the Postgres Expert’s evaluation.
Reports
You can generate the System Configuration report and Core Usage report for all locally and remotely managed servers. To generate this report, select Reports from the Management Menu.
Reports has following options:
- System Configuration Report (JSON)
- System Configuration Report (HTML)
- Core Usage Report (JSON)
- Core Usage Report (HTML)
Please note that only superusers or the users with the pem_admin role permission can download the System Configuration or Core Usage reports.
Also note that information in these reports will reflect the latest probe run time.
System Configuration Report
The System Configuration Report provides detailed information about the PEM Agents group, PEM Server directory group and custom groups listed under browser tree. These groups can contain Postgres Enterprise Manager, PEM Agents and Database servers. You can download this report in HTML as well as in JSON format.
The Postgres Enterprise Manager Summary provides details about:
- The Postgres Enterprise Manager backend database server version
- Application version
- User name accessing the application
- Python version
- Flask version
- Platform specific information
The Summary provides information about the number of agents and servers.
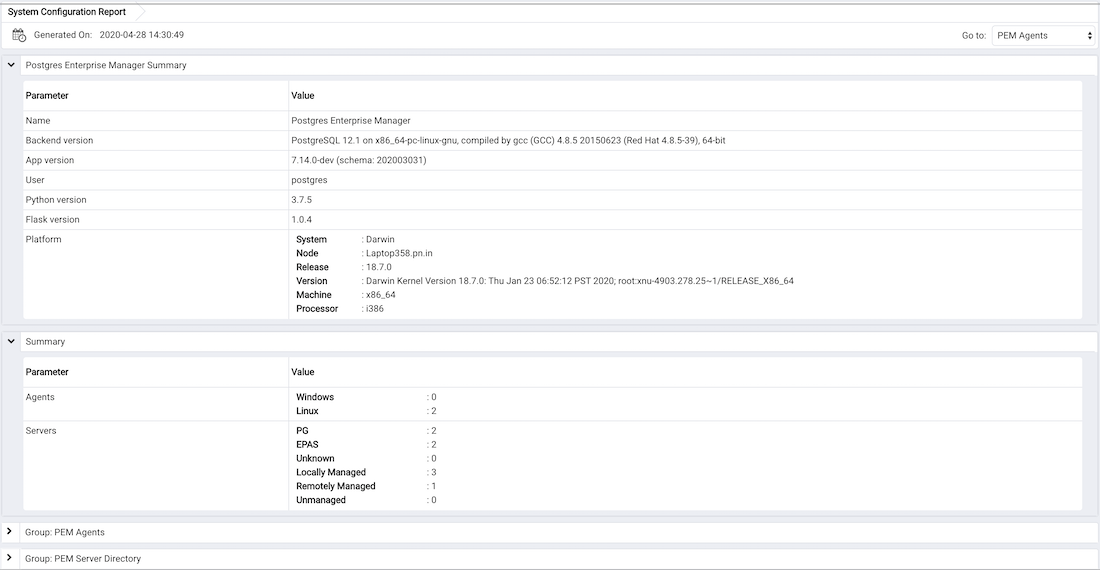
The Group: PEM Agents panel provides details about the PEM agent, CPU cores, Disk Utilization, and Memory information.
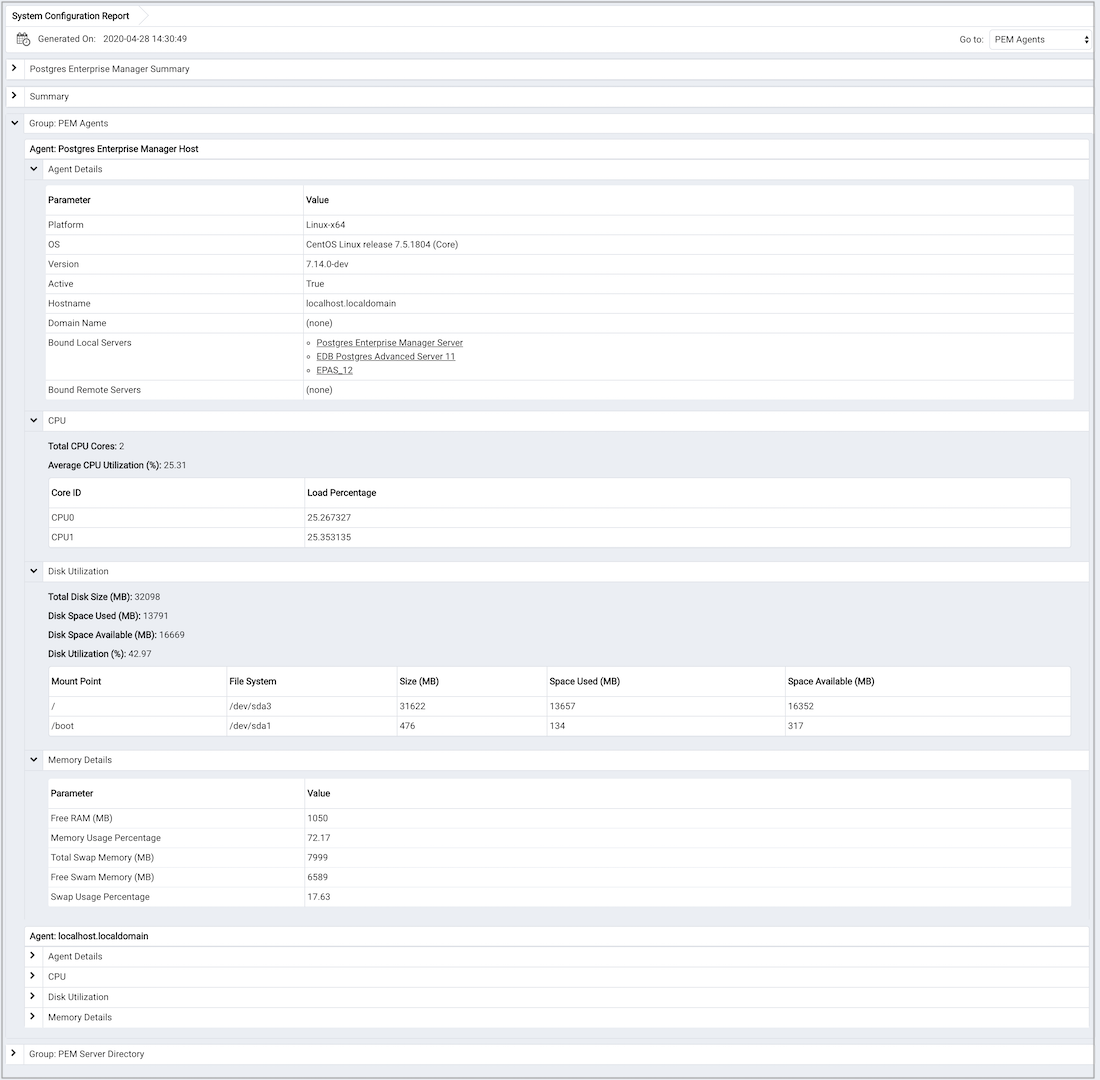
The Group: PEM Server Directory, provides details about:
- Database server version
- Host
- Port
- Database name
- Database size
- Tablespace size
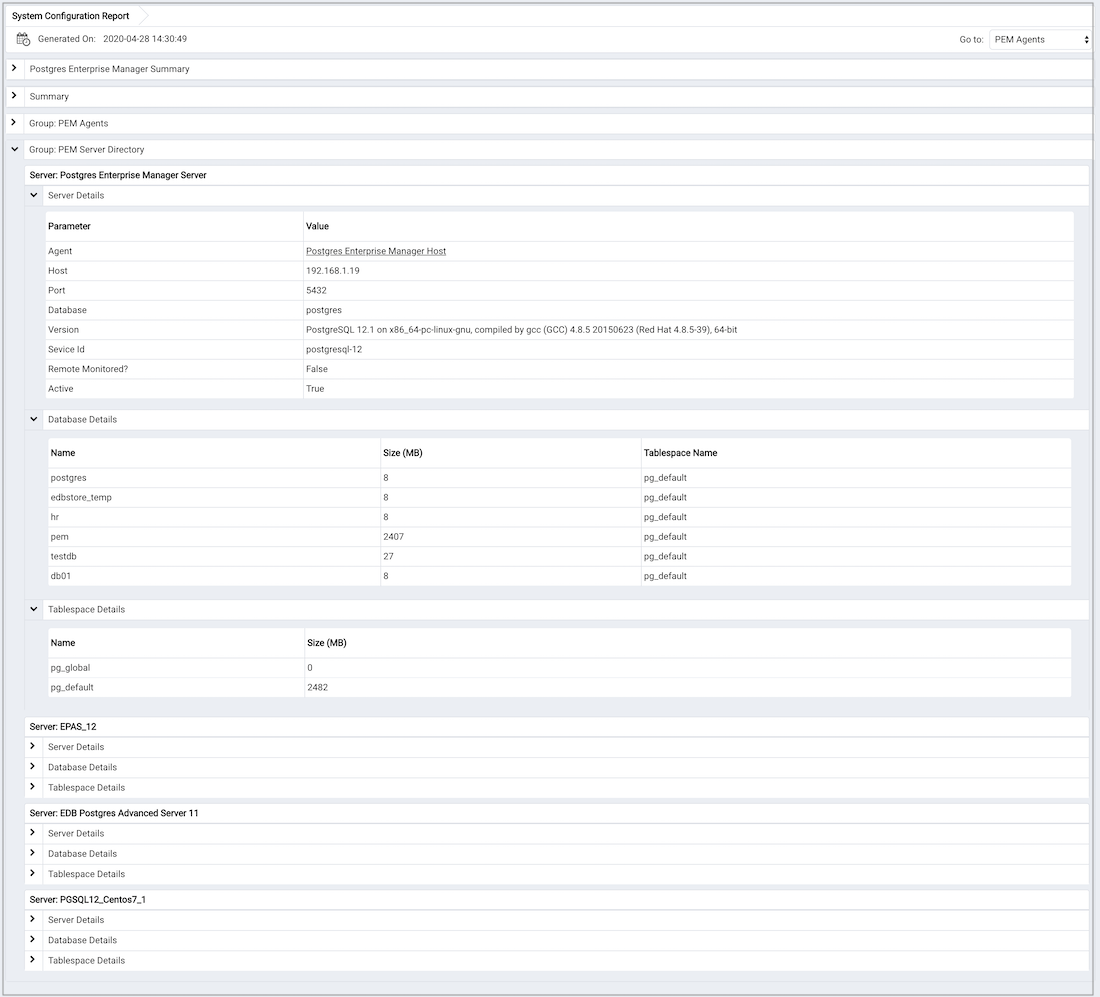
Please note that here Group Server Name depends on the group name to which the server is added.
Core Usage Report
The Core Usage report provides detailed information about number of cores specific to:
- The server type
- Database version
- Platform and group name
The report also gives detailed information about locally managed servers:
- Type
- Host
- Port
- Platform
- Cores
- RAM
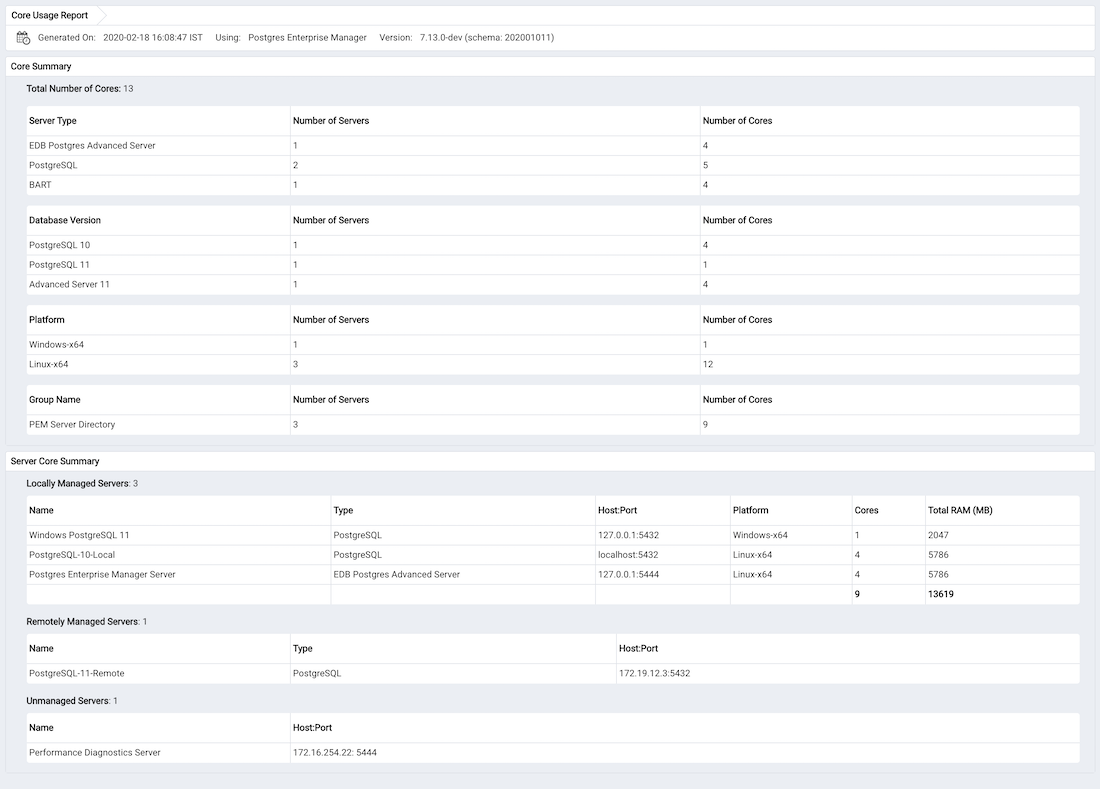
Monitoring Failover Manager
If you are using EDB Failover Manager to monitor your replication scenario, you must manually install and configure Failover Manager. For detailed information about installing Failover Manager, visit the EDB website at:
https://www.enterprisedb.com/products/edb-postgres-platform/edb-postgres-failover-manager
To monitor the status of a Failover Manager cluster on the Streaming Replication dashboard, you must provide the following information on the Advanced tab of the server Properties dialog for each node of the cluster:
Use the
EFM Cluster Namefield to specify the name of the Failover Manager cluster. The cluster name is the prefix of the name of the cluster properties file. For example, if your cluster properties file is named efm.properties, your cluster name is efm.Use the
EFM Installation Pathfield to specify the location of the Failover Manager binary file. By default, the Failover Manager binary file is installed in/usr/efm-<X>/bin.Where
<X>is the EFM Version.
After registering your servers, the Streaming Replication Analysis dashboard will display status information about your EFM cluster near the bottom of the dashboard.
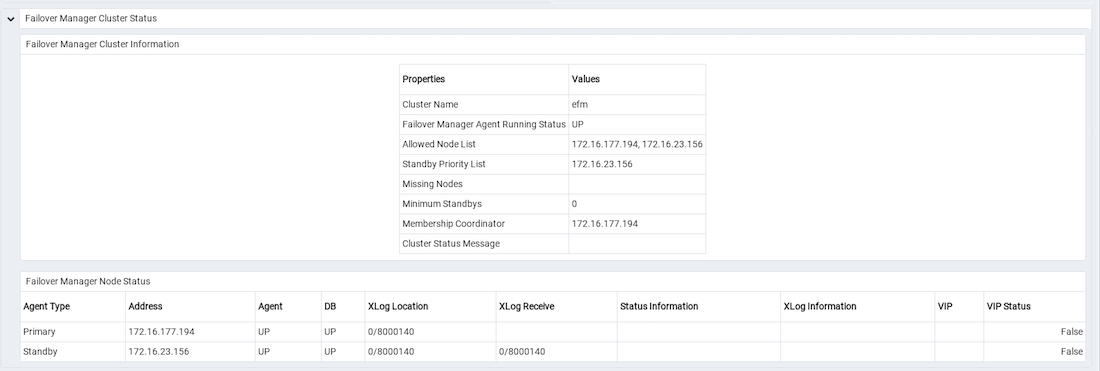
The Failover Manager Cluster Status section of the Streaming Replication Analysis dashboard displays information about the monitored cluster:
The Failover Manager Cluster Information table provides information about the Failover Manager cluster:
- The
Propertiescolumn displays the name of the cluster property. - The
Valuescolumn displays the current value of the property.
The Failover Manager Node Status table displays information about each node of the Failover Manager cluster:
- The
Agent Typecolumn displays the type of agent that resides on the node; the possible values are Primary, Replica, Witness, Idle, and Promoting. - The
Addresscolumn displays the IP address of the node. - The
Agentcolumn displays the status of the agent that resides on the node. - The
DBcolumn displays the status of the database that resides on the node. - The
XLog Locationcolumn displays the transaction log location of the database. - The
Status Informationcolumn displays any error-related information about the node. - The
XLogInformation column displays any error-related information about the transaction log. - The
VIPcolumn displays the VIP address that is associated with the node. - The
VIP Statuscolumn displays True if the VIP is active for the node, False if the VIP is not.
Replacing a Primary Node
You can use the PEM client to replace the Primary node of a Failover Manager cluster with a replica node. To initiate the failover process, select Replace Cluster Primary from Server under the Tools menu. A dialog opens, asking you to confirm that you wish to replace the current primary node.
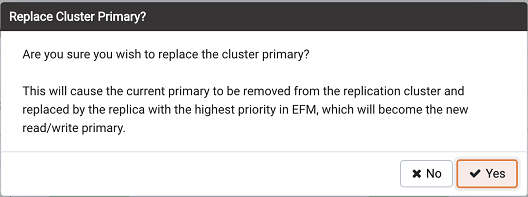
Select Yes to remove the current primary node from the Failover Manager cluster and promote a replica node to the role of read/write primary node within a Failover Manager cluster. The node with the highest promotion priority (defined in Failover Manager) will become the new primary node. PEM will display a dialog, reporting the job status.
When the job completes and the Streaming Replication Analysis dashboard refreshes, you can review the Failover Manager Node Status table to confirm that a replica node has been promoted to the role of primary within the Failover Manager cluster.
Switchover EFM Cluster
You can use the PEM client to replace the primary node of a Failover Manager cluster with a replica node. To initiate the switchover process, select Switchover EFM Cluster from the Tools menu. A dialog opens, asking you to confirm that you wish to switchover EFM cluster.
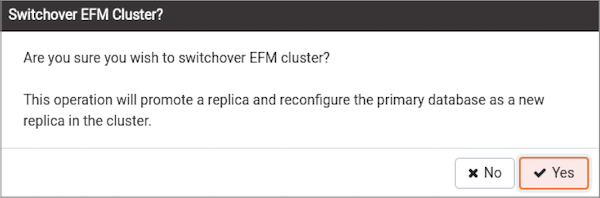
Select Yes to start the Failover Manager switchover, and promote a replica node to the role of read/write primary node and reconfigure the primary database as a new replica within a Failover Manager cluster. The node with the highest promotion priority (defined in Failover Manager) will become the new primary node. PEM will display a dialog, reporting the job status.
When the job completes and the Streaming Replication Analysis dashboard refreshes, you can review the Failover Manager Node Status table to confirm that a switchover occurred.
Monitoring an xDB Replication Cluster
Before configuring PEM to retrieve statistics from an Advanced Server or PostgreSQL database that is part of an xDB replication scenario, you must manually install and configure xDB Replication. For more information about xDB replication solutions and documentation, please visit the EDB website at:
The PEM xDB Replication probe monitors lag data for clusters that use xDB multi-primary or single-primary replication that have a publication database that is an EDB Postgres Advanced Server or PostgreSQL database. Please note that if you have configured replication between other proprietary database hosts (i.e. Oracle or SQL Server) and Advanced Server or PostgreSQL, the probe cannot return lag information.
By default, the xDB Replication probe is disabled. To enable the xDB Replication probe, right click on the name of the server, and select Connect from the context menu; if prompted, provide authentication information. After connecting, expand the server node of the tree control, and highlight the name of the replicated database. Then, select Manage Probes... from the Management menu.
Use fields on the Manage Probes tab to configure the xDB Replication probe:
- Move the
Defaultslider toNoto modify the Minutes and Seconds between probe executions. - Use the
Enabled?slider to instruct PEM to execute the xDB Replication probe. - Set the
Defaultslider in theData Retentionfield to No to modify the number of days that PEM will store the information retrieved by the probe.
After enabling the probe, you can use the metrics returned to create custom charts and dashboards in the PEM client.
Performance Diagnostic
You can use the Performance Diagnostic dashboard to analyze the database performance for Postgres instances by monitoring the wait events. To display the diagnostic graphs, PEM uses the data collected by EDB Wait States module.
Peformance Diagnostic feature is supported for Advanced Server databases from PEM 7.6 version onwards and for PostgreSQL databases it is supported from PEM 8.0 onwards.
Note For PostgreSQL databases, Performance Diagnostics is supported only for versions 10, 11, and 12 installed on the supported CentOS or RHEL platforms.
For more information on EDB Wait States, see EDB Postgres Advanced Server Guide.
You can analyze the Wait States data on multiple levels by narrowing down your selection of data. Each level of the graph is populated on the basis of your selection of data at the higher level.
Prerequisite:
For PostgreSQL, you need to install
edb_wait_states_<X>package fromedb.repowhere<X>is the version of PostgreSQL Server. You can refer to EDB Build Repository for the steps to install this package. For Advanced Server, you need to installedb-as<X>-server-edb-modules, Where<X>is the version of Advanced Server.Once you ensure that EDB Wait States module of EDB Postgres Advanced Server is installed, then configure the list of libraries in the
postgresql.conffile as below:shared_preload_libraries = '$libdir/edb_wait_states'
Restart the database server, and then create the following extension in the maintenance database:
CREATE EXTENSION edb_wait_states;
- You must have super user privileges to access the Performance Diagnostic dashboard.
You get the following error while accessing the Performance Diagnostic dashboard if the above prerequisites are not met:
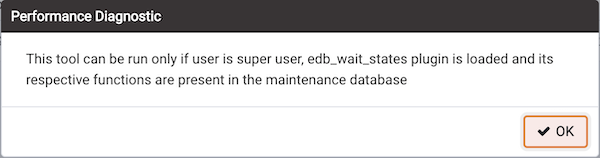
To open the Performance Diagnostic dashboard, select Server and then Performance Diagnostic... from the Tools menu of the PEM client.
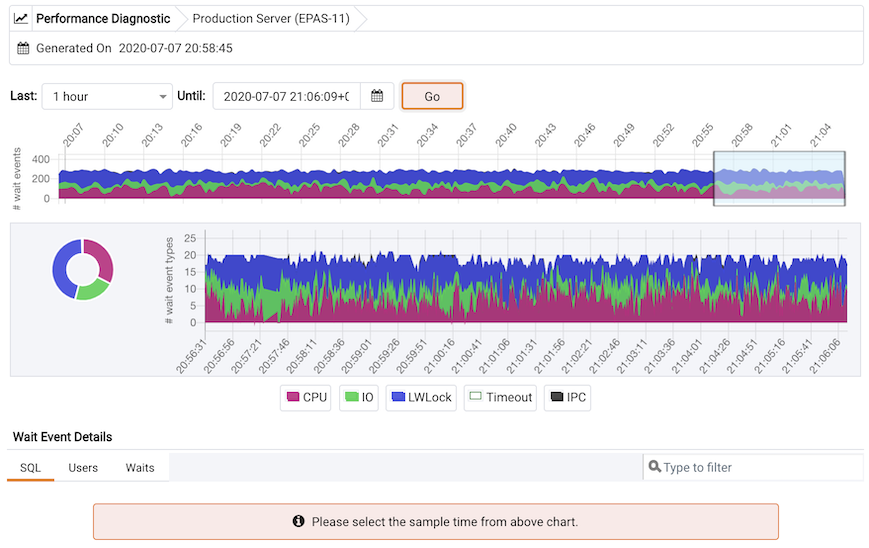
By default, the top most Performance Diagnostic graph pulls the data of last one hour, starting from current date and time. This graph shows the time series containing the number of active sessions. Each point of this time series represents the active sessions and wait events at a particular time and last 15 seconds. These sessions may or may not be waiting for an wait event, or using the CPU at a particular point in time. This time series is generated based on the wait event samples collected by the edb_wait_states extension.
You can also use the Preferences dialog to display Performance Diagnostic in a new browser tab. Use Open in New Browser Tab? to display the Performance Diagnostics dashboard in a new browser tab.
The range selection in the first graph is 10 minutes. You can use the Last drop-down list box to select the duration for which you want to see the graph: select the last 1 hour, last 4 hours, last 12 hours, or last 24 hours. You can also select the date and time through which you want the data to be displayed.
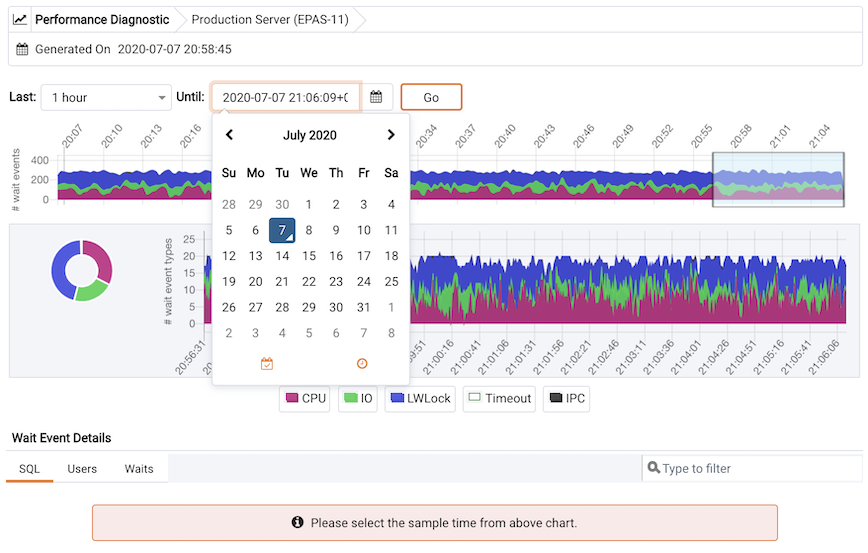
The first graph displays the number of active sessions (and - wait event types) for the selected time interval. You can narrow down the timeline in the first graph to analyze the data for a specific time period.
Next section plots the following graphs based on the selected time interval in the first graph:
- Donut graph - It shows total wait event types according to the time range selection in the first graph. It helps you understand how much time was spent by those session on waiting for an event.
- Line graph - It plots a time series with each point representing the active sessions for each sample time.
To differentiate each wait event types and the CPU usage clearly, the graph for each wait event type is displayed in a different color.
Select a particular time on the Line graph for which you wish to analyze the wait events; the third section displays the wait event details in the Performance Diagnostics dashboard on the basis of your selected particular time in the second graph. The third section displays wait event details on three tabs:
- The
SQLtab displays the list of SQL queries having wait events for the selected sample time. - The
Userstab displays the details of the wait events grouped by users for selected sample time. - The
Waitstab displays the number of wait events belonging to each wait event type for the selected sample time.
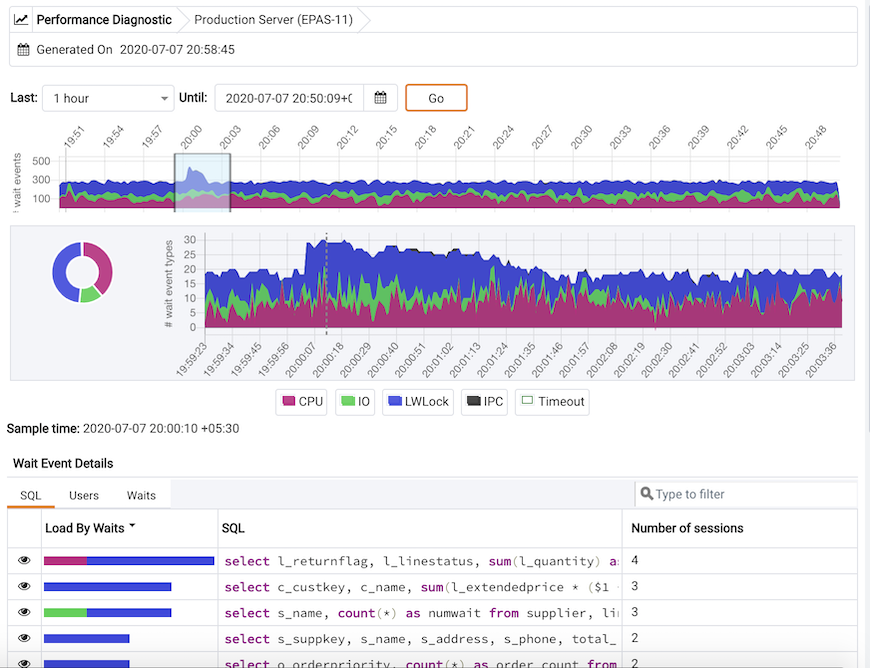
You can click on the graph legends to show or hide a particular wait event type in all the graphs. This will make the analysis of a specific wait event type easier.
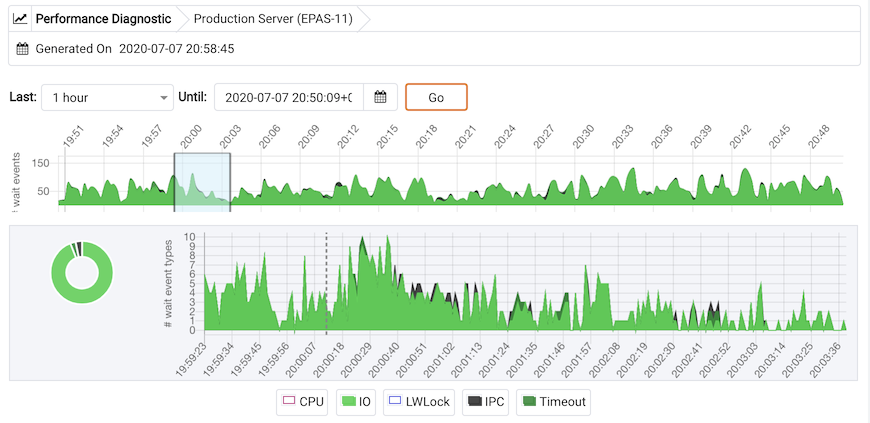
You can filter the data displayed in the rows under all the three tabs. You can also sort the data alphabetically by clicking on the column headers.
SQL tab

Users tab
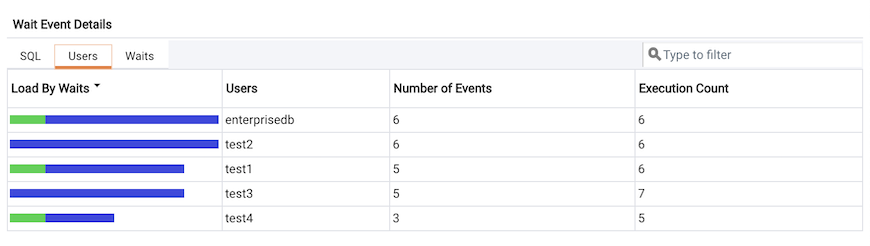
Waits tab
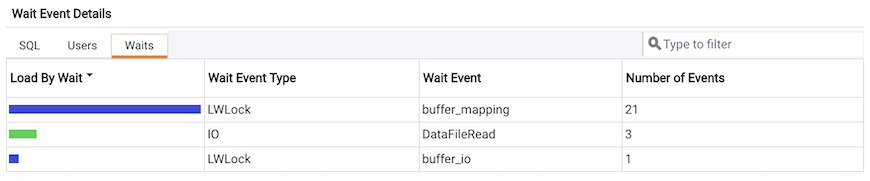
Click on the Eye icon in any row of the SQL tab to display a new tab with details of the query of that particular row. This page displays Query ID and its corresponding session IDs in a dropdown list at that particular selected sample time in the Query information section. You can select the session ID for the selected query for which you want to analyze the data. You will see the details corresponding to the selected session ID and query ID. The Query information table also displays the SQL query. If the SQL query is being displayed partially, click the down arrow at the bottom of the section to view the complete SQL query.
The Wait event types section displays the total number of wait event types for the selected session ID and query ID. It shows two type of graphs:
- Donut graph - It shows the proportions of categorical data, with the size of each piece representing the proportion of each wait event type.
- Timeline bar graph - It can be used to visualize trends in counts of wait event types over time.
To differentiate clearly, each wait event type is represented by a different color in the bar graph.
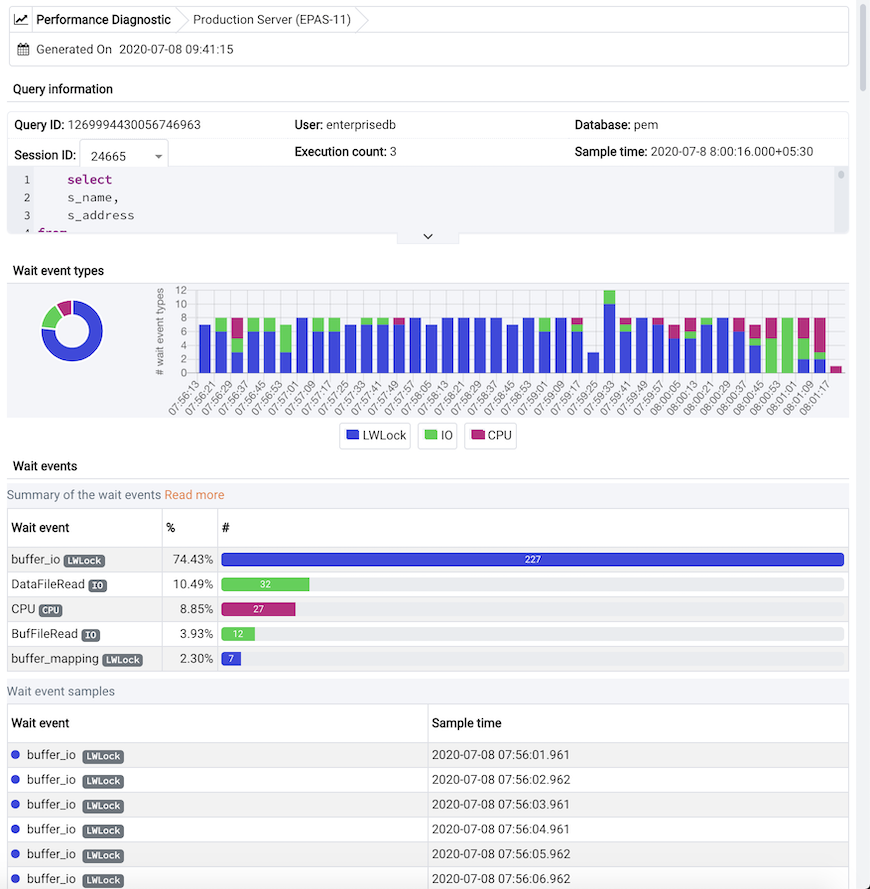
The Wait events section has a table displaying all the wait events occured during the query execution. It displays data in decreasing order by number of the wait events. Second table displays the wait event with sample time occured over the period of whole query execution. It allows to analyze the wait events during the query execution over the period of time. It shows the actual samples collected by the EDB Wait States extension for that particular query ID and session ID.
Reference
The following sections are provided for reference; please note that the items referred to in the following tables are subject to change.
PEM Server Configuration Parameters - Reference
You can use global configuration options to modify aspects of the PEM Server’s behavior. Please note that the list of configuration parameters is subject to change.
| Parameter name | Value and Unit | Description |
|---|---|---|
| audit_log_retention_time | 30 days | Specifies the number of days that an audit log will be retained on the PEM server. |
| auto_create_agent_alerts | true | Specifies whether to create default agent level alerts automatically when an agent is registered. |
| auto_create_server_alerts | true | Specifies whether to create default server level alerts automatically when a server is bound to an agent. |
| chart_disable_bullets | false | Enable/disable bullets on line charts on dashboards and Capacity Manager reports. |
| cm_data_points_per_report | 50 | Specifies the number of data points to plot on charts on Capacity Manager reports. |
| cm_max_end_date_in_years | 5 years | Specifies the maximum amount of time that the Capacity Manager will extrapolate data for. Ensures that threshold-based end dates of on reports do not get extrapolated indefinitely. |
| dash_alerts_timeout | 60 seconds | Specifies the number of seconds after which the components of the Alerts dashboard are auto-refreshed. |
| dash_db_comrol_span | 7 days | Specifies the number of days worth of data to plot on the Commit/Rollback Analysis chart on the Database Analysis dashboard and Server Analysis dashboard. |
| dash_db_comrol_timeout | 1800 seconds | Specifies the number of seconds after which the Commits/Rollbacks line chart is auto-refreshed on the Database Analysis dashboard and Server Analysis dashboard. |
| dash_db_connovervw_timeout | 300 seconds | Specifies the number of seconds after which the Connection Overview pie chart is auto-refreshed in the Database Analysis dashboard. |
| dash_db_eventlag_span | 7 days | Specifies the number of days worth of data to plot on the Number of Events Lag chart for slony replication on the Database Analysis dashboard. |
| dash_db_eventlag_timeout | 1800 seconds | Specifies the number of seconds after which the Number of Events Lag line chart for slony replication is auto-refreshed on the Database Analysis dashboard. |
| dash_db_hottable_rows | 25 rows | Specifies the number of rows to show on the HOT Table Analysis table on the Database Analysis dashboard. |
| dash_db_hottable_timeout | 300 seconds | Specifies the number of seconds after which the Hot Tables table is auto-refreshed in the Database Analysis dashboard. |
| dash_db_io_span | 7 days | Specifies the number of days worth of data to plot on the Database I/O Analysis chart on the Database Analysis dashboard and I/O Analysis dashboard. |
| dash_db_io_timeout | 1800 seconds | Specifies the number of seconds after which the Database I/O line chart is auto-refreshed on the Database Analysis dashboard and I/O Analysis dashboard. |
| dash_db_rowact_span | 7 days | Specifies the number of days worth of data to plot on the Row Activity Analysis chart on the Database Analysis dashboard, the I/O Analysis dashboard, and the Server Analysis dashboard. |
| dash_db_rowact_timeout | 1800 seconds | Specifies the number of seconds after which the Row Activity line chart is auto-refreshed on the Database Analysis dashboard, the I/O Analysis dashboard, and the Server Analysis dashboard. |
| dash_db_storage_timeout | 300 seconds | Specifies the number of seconds after which the Storage bar chart is auto-refreshed in the Database Analysis dashboard. |
| dash_db_timelag_span | 7 days | Specifies the number of days worth of data to plot on the Time Lag chart for Slony replication on the Database Analysis dashboard. |
| dash_db_timelag_timeout | 1800 seconds | Specifies the number of seconds after which the Time Lag line chart for Slony replication is auto-refreshed on the Database Analysis dashboard. |
| dash_db_useract_span | 7 days | Specifies the number of days worth of data to plot on the User Activity Analysis chart on the Database Analysis dashboard. |
| dash_db_useract_timeout | 1800 seconds | Specifies the number of seconds after which the User Activity line chart is auto-refreshed in the Database Analysis dashboard. |
| dash_efm_timeout | 300 seconds | Specifies the number of seconds after which the Failover Manager Node Status and Failover Manager Cluster Info line chart is auto-refreshed on the Streaming Replication dashboard. |
| dash_global_overview_timeout | 30 seconds | Specifies the number of seconds after which the components of the Global Overview dashboard are auto-refreshed. |
| dash_header_timeout | 60 seconds | Specifies the number of seconds after which the information on the header of all the dashboards are auto-refreshed. |
| dash_io_chkpt_span | 7 days | Specifies the number of days worth of data to plot on the Checkpoints chart on the I/O Analysis dashboard. |
| dash_io_chkpt_timeout | 1800 seconds | Specifies the number of seconds after which the Checkpoints line chart is auto-refreshed on the I/O Analysis dashboard. |
| dash_io_hotindx_timeout | 300 seconds | Specifies the number of seconds after which the Hot Indexes bar chart is auto-refreshed on the I/O Analysis dashboard. |
| dash_io_hottbl_timeout | 300 seconds | Specifies the number of seconds after which the Hot Tables bar chart is auto-refreshed on the I/O Analysis dashboard. |
| dash_io_index_objectio_rows | 25 rows | Specifies the number of rows displayed on the Index Activity table on the I/O Analysis dashboard and the Object Activity Analysis dashboard. |
| dash_io_index_objectio_timeout | 60 seconds | Specifies the number of seconds after which the Index Activity table is auto-refreshed on the I/O Analysis dashboard and the Object Activity Analysis dashboard. |
| dash_io_objectio_rows | 25 rows | Specifies the number of rows displayed in the Object I/O Details table on the I/O Analysis dashboard and Object Activity Analysis dashboard. |
| dash_io_objectio_timeout | 300 seconds | Specifies the number of seconds after which the Object I/O Details table is auto-refreshed on the I/O Analysis dashboard and Object Activity Analysis dashboard. |
| dash_memory_hostmemact_span | 7 days | Specifies the number of days worth of data to plot on the Host Memory Activity Analysis chart on the Memory Analysis dashboard. |
| dash_memory_hostmemact_timeout | 1800 seconds | Specifies the number of seconds after which the Host Memory Activity line chart is auto-refreshed on the Memory Analysis dashboard. |
| dash_memory_hostmemconf_timeout | 300 seconds | Specifies the number of seconds after which the Host Memory Configuration pie chart is auto-refreshed on the Memory Analysis dashboard and Server Analysis dashboard. |
| dash_memory_servmemact_span | 7 days | Specifies the number of days worth of data to plot on the server Memory Activity Analysis chart on the Memory Analysis dashboard. |
| dash_memory_servmemact_timeout | 1800 seconds | Specifies the number of seconds after which the Server Memory Activity line chart is auto-refreshed on the Memory Analysis dashboard. |
| dash_memory_servmemconf_timeout | 300 seconds | Specifies the number of seconds after which the Server Memory Configuration pie chart is auto-refreshed on the Memory Analysis dashboard. |
| dash_objectact_objstorage_rows | 15 rows | Specifies the number of rows to show on the Object Storage table on the Object Activity Analysis dashboard. |
| dash_objectact_objstorage_timeout | 300 seconds | Specifies the number of seconds after which the Object Storage table is auto-refreshed in the Object Activity Analysis dashboard. |
| dash_objectact_objtopindexes_timeout | 300 seconds | Specifies the number of seconds after which the Top 5 Largest Indexes bar chart is auto-refreshed in the Object Activity Analysis dashboard. |
| dash_objectact_objtoptables_timeout | 300 seconds | Specifies the number of seconds after which the Top 5 Largest Tables bar chart is auto-refreshed in the Object Activity Analysis dashboard. |
| dash_os_cpu_span | 7 days | Specifies the number of days worth of data to plot on the CPU chart on the Operating System Analysis dashboard. |
| dash_os_cpu_timeout | 1800 seconds | Specifies the number of seconds after which the CPU line chart is auto-refreshed on the Operating System Analysis dashboard. |
| dash_os_data_span | 7 days | Specifies the number of days worth of data to plot on the I/O line chart on the Operating System Analysis dashboard. |
| dash_os_disk_span | 7 days | Specifies the number of days worth of data to plot on the Utilisation chart on the Operating System Analysis dashboard. |
| dash_os_hostfs_timeout | 1800 seconds | Specifies the number of seconds after which the Host File System Details table is auto-refreshed on the Operating System Analysis dashboard. |
| dash_os_io_timeout | 1800 seconds | Specifies the number of seconds after which the I/O line chart is auto-refreshed on the Operating System Analysis dashboard. |
| dash_os_memory_span | 7 days | Specifies the number of days worth of data to plot on the Memory chart on the Operating System Analysis dashboard. |
| dash_os_memory_timeout | 1800 seconds | Specifies the number of seconds after which the Memory line chart is auto-refreshed on the Operating System Analysis dashboard. |
| dash_os_packet_span | 7 days | Specifies the number of days worth of data to plot on the Packet chart on the Operating System Analysis dashboard. |
| dash_os_packet_timeout | 1800 seconds | Specifies the number of seconds after which the Network Packets line chart is auto-refreshed on the Operating System Analysis dashboard. |
| dash_os_process_span | 7 days | Specifies the number of days worth of data to plot on the Process chart on the Operating System Analysis dashboard. |
| dash_os_process_timeout | 1800 seconds | Specifies the number of seconds after which the Process line chart is auto-refreshed on the Operating System Analysis dashboard. |
| dash_os_storage_timeout | 1800 seconds | Specifies the number of seconds after which the Storage pie chart is auto-refreshed on the Operating System Analysis dashboard. |
| dash_os_traffic_span | 7 days | Specifies the number of days worth of data to plot on the Traffic chart on the Operating System Analysis dashboard. |
| dash_os_traffic_timeout | 1800 seconds | Specifies the number of seconds after which the Traffic line chart is auto-refreshed on the Operating System Analysis dashboard. |
| dash_os_util_timeout | 1800 seconds | Specifies the number of seconds after which the Utilisation line chart is auto-refreshed on the Operating System Analysis dashboard. |
| dash_probe_log_timeout | 300 seconds | Specifies the number of seconds after which the Probe Log table is auto-refreshed on |
| dash_replication_archivestat_span | 7 days | Specifies the number of days worth of data to plot on the WAL Archive Status chart on the Streaming Replication Analysis dashboard. |
| dash_replication_archivestat_timeout | 1800 seconds | Specifies the number of seconds after which the WAL Archive Status line chart is auto-refreshed on the Streaming Replication dashboard. |
| dash_replication_pagelag_span | 7 days | Specifies the number of days worth of data to plot on the WAL Lag Pages chart on the Streaming Replication dashboard. |
| dash_replication_pagelag_timeout | 1800 seconds | Specifies the number of seconds after which the WAL Lag Pages line chart is auto-refreshed on the Streaming Replication dashboard. |
| dash_replication_segmentlag_span | 7 days | Specifies the number of days worth of data to plot on the WAL Lag Segments chart on the Streaming Replication dashboard. |
| dash_replication_segmentlag_timeout | 1800 seconds | Specifies the number of seconds after which the WAL Lag Segments line chart is auto-refreshed on the Streaming Replication dashboard. |
| dash_replication_timelag_span | 7 days | Specifies the number of days worth of data to plot on the Replication Lag Time chart on the Streaming Replication dashboard. |
| dash_replication_timelag_timeout | 1800 seconds | Specifies the number of seconds after which the Replication Lag Time line chart is auto-refreshed on the Streaming Replication dashboard. |
| dash_server_buffers_written | 168 hours | Specifies the number of days worth of data to plot on the Background Writer Statistics chart on the Server Analysis dashboard. |
| dash_server_buffers_written_timeout | 300 seconds | Specifies the number of seconds after which the Background Writer Statistics line chart is auto-refreshed on the Server Analysis dashboard. |
| dash_server_connovervw_timeout | 300 seconds | Specifies the number of seconds after which the Connection Overview pie chart is auto-refreshed in the Server Analysis dashboard. |
| dash_server_database_timeout | 300 seconds | Specifies the number of seconds after which the Databases table is auto-refreshed in the Server Analysis dashboard. |
| dash_server_dbsize_span | 7 days | Specifies the number of days worth of data to plot on the Database Size Analysis on the Server Analysis dashboard. |
| dash_server_dbsize_timeout | 1800 seconds | Specifies the number of seconds after which the Database Size line chart is auto-refreshed in the Server Analysis dashboard. |
| dash_server_disk_timeout | 1800 seconds | Specifies the number of seconds after which the Disk line chart is auto-refreshed in the Server Analysis dashboard. |
| dash_server_global_span | 7 days | Specifies the number of days worth of data to plot on the Disk line chart on the Server Analysis dashboard. |
| dash_server_sharedbuff_span | 7 days | Specifies the number of days worth of data to plot on the Shared Buffer chart on the Server Analysis dashboard. |
| dash_server_sharedbuff_timeout | 1800 seconds | Specifies the number of seconds after which the Shared Buffers line chart is auto-refreshed in the Server Analysis dashboard. |
| dash_server_tabspacesize_span | 7 days | Specifies the number of days worth of data to plot on the Tablespace Size chart on the Server Analysis dashboard. |
| dash_server_tabspacesize_timeout | 1800 seconds | Specifies the number of seconds after which the Tablespace Size line chart is auto-refreshed in the Server Analysis dashboard. |
| dash_server_useract_span | 7 days | Specifies the number of days worth of data to plot on the User Activity chart on the Server Analysis dashboard. |
| dash_server_useract_timeout | 1800 seconds | Specifies the number of seconds after which the User Activity line chart is auto-refreshed in the Server Analysis dashboard. |
| dash_sessact_lockact_timeout | 300 seconds | Specifies the number of seconds after which the Session Lock Activity table is auto-refreshed in the Session Activity Analysis dashboard. |
| dash_sessact_workload_timeout | 300 seconds | Specifies the number of seconds after which the Session Workload table is auto-refreshed in the Session Activity Analysis dashboard. |
| dash_sess_waits_nowaits_timeout | 300 seconds | Specifies the number of seconds after which the Session Waits By Number Of Waits pie |
| dash_sess_waits_timewait_timeout | 300 seconds | Specifies the number of seconds after which the Session Waits By Time Waited pie chart is auto-refreshed in the Session Waits Analysis dashboard. |
| dash_sess_waits_waitdtl_timeout | 300 seconds | Specifies the number of seconds after which the Session Waits Details table is auto-refreshed in the Session Waits Analysis dashboard. |
| dash_storage_dbdtls_timeout | 300 seconds | Specifies the number of seconds after which the Database Details table is auto-refreshed in the Storage Analysis dashboard. |
| dash_storage_dbovervw_timeout | 300 seconds | Specifies the number of seconds after which the Database Overview pie chart is auto-refreshed in the Storage Analysis dashboard. |
| dash_storage_hostdtls_timeout | 300 seconds | Specifies the number of seconds after which the Host Details table is auto-refreshed |
| dash_storage_hostovervw_timeout | 300 seconds | Specifies the number of seconds after which the Host Overview pie chart is auto-refreshed in the Storage Analysis dashboard. |
| dash_storage_tblspcdtls_timeout | 300 seconds | Specifies the number of seconds after which the Tablespace Details table is auto-refreshed in the Storage Analysis dashboard. |
| dash_storage_tblspcovervw_timeout | 300 seconds | Specifies the number of seconds after which the Tablespace Overview pie chart is auto-refreshed in the Storage Analysis dashboard. |
| dash_sys_waits_nowaits_timeout | 300 seconds | Specifies the number of seconds after which the System Waits By Number Of Waits pie chart is auto-refreshed in the System Waits Analysis dashboard. |
| dash_sys_waits_timewait_timeout | 300 seconds | Specifies the number of seconds after which the System Waits By Time Waited pie chart is auto-refreshed in the System Waits Analysis dashboard. |
| dash_sys_waits_waitdtl_timeout | 300 seconds | Specifies the number of seconds after which the System Waits Details table is auto-refreshed in the System Waits Analysis dashboard. |
| deleted_charts_retention_time | 7 days | Specifies the number of days that a custom chart (displayed on a user-defined dashboard) is stored. |
| deleted_probes_retention_time | 7 days | Specifies the number of days that a custom probe (displayed on a user-defined dashboard) is stored. |
| download_chart_format | jpeg | Specifies the format in which a downloaded chart will be stored. May be jpeg or png. |
| flapping_detection_state_change | 3 | Specifies the number of state changes detected within a specified interval to define a given alert as flapping. Flapping starts when more than N state changes have occurred over [ N + 1 * (min(probe_interval) * 2)] minutes and the fine state is not None. Where the default value of N is 2 or 3, and min(probe_interval) is the smallest interval for all the probes used by the alert. Flapping ends when ZERO state changes have occurred over [2 N * min(probe_interval)] minutes. |
| job_retention_time | 30 days | Specifies the number of days that non-recurring scheduled tasks and their associated |
| long_running_transaction_minutes | 5 minutes | Specifies the number of minutes a query executes for before being considered long running. |
| nagios_cmd_file_name | <file_name> | Specifies nagios command file to which passive service check result will be sent. |
| nagios_enabled | t | Specifies whether alert notification will be submitted to nagios or not. |
| nagios_medium_alert_as_critical | f | Specifies whether medium level PEM alert will be considered as critical in nagios. |
| nagios_spool_retention_time | 7 days | Specifies the number of days to retain nagios messages in the spool table before they are discarded. |
| probe_log_retention_time | 30 days | Specifies the number of days that probe log records are retained. |
| reminder_notification_interval | 24 hours | Specifies the number of hours after which a reminder email is sent in case an alert has not been cleared. |
| server_log_retention_time | 30 days | Specifies the number of days that the server log is retained on the PEM server. |
| show_data_tab_on_graph | false | If ‘true’, a Data tab is added to each graph. Select the Data tab to review the data that is plotted on the graph. |
| smtp_authentication | false | Specifies whether to enable/disable authentication over SMTP. |
| smtp_enabled | true | Specifies whether to enable/disable sending of emails. |
| smtp_encryption | false | Specifies whether to send SMTP email using an encrypted connection. |
| smtp_password | Specifies the password to be used to connect to the SMTP server. | |
| smtp_port | 25 | Specifies the SMTP server port to be used for sending email. |
| smtp_server | 127.0.0.1 | Specifies the SMTP server host address to be used for sending email. |
| smtp_spool_retention_time | 7 days | Specifies the number of days to retain sent email messages in the spool table before they are discarded. |
| smtp_username | Specifies the username to be used to connect to SMTP server. | |
| snmp_community | public | Specifies the SNMP community used when sending traps. Used only with SNMPv1 and SNMPv2. |
| snmp_enabled | true | Specifies whether to enable/disable sending SNMP traps. |
| snmp_port | 162 | Specifies the SNMP server port to be used for sending SNMP traps. |
| snmp_server | 127.0.0.1 | Specifies the SNMP server host address to be used for sending SNMP traps. |
| snmp_spool_retention_time | 7 days | Specifies the number of days to retain sent traps in the spool table before they are discarded. |
| snmp_security_name | Specifies the user name or security name for sending SNMP traps. Used only with SNMPv3. | |
| snmp_security_engine_id | Specifies the Engine id of the SNMP Agent on the SNMP Server. Used only with SNMPv3. | |
| snmp_security_level | NOAUTH_NOPRIV | Specifies Security level and its possible values can be: AUTH_NOPRIV - Authentication, No Privacy or AUTH_PRIV - Authentication, Privacy or NOAUTH_NOPRIV - no Authentication, no Privacy. Used only with SNMPv3. |
| snmp_context_name | Specifies the Context name, the identifier for MIB objects when sending SNMP traps. Used only with SNMPv3. | |
| snmp_context_engine_id | Specifies the Context engine id, the identifier for MIB objects when sending SNMP traps. If not specified, snmp_security_engine_id will be used. Used only with SNMPv3. | |
| snmp_authentication_protocol | NONE | Specifies the authentication type for SNMP traps. Its possible values can be NONE,HMACMD5 or HMACSHA. Used only with SNMPv3. |
| snmp_privacy_protocol | NONE | Specifies the privacy protocol for SNMP traps. Its possible values can be NONE, DES, AES128, IDEA, AES192, or AES256. Used only with SNMPv3. |
| snmp_authentication_password | Specifies the authentication password associated with security name mentioned in snmp_security_name. Used only for SNMPv3. | |
| snmp_privacy_password | Specifies the privacy password associated with security name mentioned in snmp_security_name. Used only for SNMPv3. | |
| webclient_help_pg | EDB hosted documentation | Specifies the location of the online PostgreSQL core documentation. |
Capacity Manager Metrics - Reference
Please Note that the Capacity Manager metrics available will vary by platform, and are subject to change. The available metrics may include the metrics described in the table below.
| Metric Name | Description |
|---|---|
| # Dead Tuples | The number of dead tuples in the selected table. |
| # Dead Tuples+ | The cumulative number of dead tuples in the selected table. |
| # Heap Tuples Fetched by Index Scans | The number of heap tuples fetched by index scans. |
| # Heap Tuples Fetched by Index Scans | The cumulative number of heap tuples fetched by index scans. |
| # Idle Backends+ | The cumulative number of currently idle backend clients. |
| # Index Scans | The number of index scans performed on the specified object. |
| # Index Scans+ | The cumulative number of index scans performed on the specified object. |
| # Index Tuples Read | The number of index tuples read. |
| # Index Tuples Read+ | The cumulative number of index tuples read. |
| # Live Tuples | The number of tuples visible to transactions. |
| # Live Tuples+ | The cumulative number of tuples visible to transactions. |
| # Pages Estimated by ANALYZE | The number of pages estimated by ANALYZE. |
| # Pages Estimated by ANALYZE+ | The cumulative number of pages estimated by ANALYZE. |
| # Sequential Scans | The number of sequential scans performed on the specific table. |
| # Sequential Scans+ | The cumulative number of sequential scans performed on the specific table. |
| # Sequential Scan Tuples | The number of tuples sequentially scanned in the specific table. |
| # Sequential Scan Tuples+ | The cumulative number of tuples sequentially scanned in the specific table. |
| # Tuples Deleted | The number of tuples deleted. |
| # Tuples Deleted+ | The cumulative number of tuples deleted. |
| # Tuples Estimated by ANALYZE | The number of live (visible) tuples estimated by ANALYZE. |
| # Tuples Estimated by ANALYZE+ | The cumulative number of live tuples estimated by ANALYZE. |
| # Tuples HOT Updated | The number of tuples HOT updated. In a HOT update, the new tuple resides in the same block as the original tuple and the tuples share an index entry. |
| # Tuples HOT Updated+ | The cumulative number of tuples HOT updated. |
| # Tuples Inserted | The number of tuples inserted into the specified table. |
| # Tuples Inserted+ | The cumulative number of tuples inserted into the specified table. |
| # Tuples Updated | The number of tuples updated in the selected table. |
| # Tuples Updated+ | The cumulative number of tuples updated in the selected table. |
| Blocks Hit | The number of blocks found in the cache. |
| Blocks Hit+ | The cumulative number of blocks found in the cache. |
| Blocks Read | The number of blocks read. |
| Blocks Read+ | The cumulative number of blocks read. |
| Blocks Read from InfiniteCache | The number of blocks read from InfiniteCache. |
| Blocks Read from InfiniteCache+ | The cumulative number of blocks read from InfiniteCache. |
| Blocks Written | The number of blocks written. |
| Blocks Written+ | The cumulative number of blocks written. |
| Buffers Allocated | The number of buffers allocated. |
| Buffers Allocated+ | The cumulative number of buffers allocated. |
| Buffers Written - Backends | The number of buffer blocks written to disk by server processe (processes connected to a client application). |
| Buffers Written - Backends+ | The cumulative number of buffer blocks written to disk by server processes. |
| Buffers Written - Checkpoint | The number of blocks written to disk by the checkpoint process. |
| Buffers Written - Checkpoint+ | The cumulative number of blocks written to disk by the checkpoint process. |
| Buffers Written - Cleaning Scan | The number of blocks written to disk by the autovacuum process. |
| Buffers Written - Cleaning Scan+ | The cumulative number of blocks written to disk by the autovacuum process. |
| Bytes Received (KB) | The number of bytes received from the client (in kilobytes). |
| Bytes Received (KB)+ | The cumulative number of bytes received (in kilobytes). |
| Bytes Sent (KB) | The number of bytes sent to the client (in kilobytes). |
| Bytes Sent (KB)+ | The cumulative number of bytes sent (in kilobytes). |
| Checkpoints - Timed | The number of checkpoint operations triggered by the checkpoint interval. |
| Checkpoints - Timed+ | The cumulative number of checkpoint operations triggered by the checkpoint interval. |
| Checkpoints - Untimed | The number of checkpoint operations triggered by checkpoint size. |
| Checkpoints - Untimed+ | The cumulative number of checkpoint operations triggered by checkpoint size. |
| Database Size (MB) | The size of the specified database (in megabytes). |
| Free RAM Memory | The amount of free RAM memory (in megabytes). |
| Free Swap Memory | The amount of free swap space on disk (in megabytes). |
| Heap Blocks Hit | The number of heap blocks found in the cache. |
| Heap Blocks Hit+ | The cumulative number of heap blocks found in the cache. |
| Heap Blocks Read | The number of heap blocks read. |
| Heap Blocks Read+ | The cumulative number of heap blocks read. |
| Index Blocks Hit | The number of index blocks found in the cache. |
| Index Blocks Hit+ | The cumulative number of index blocks found in the cache. |
| Index Blocks Read | The number of index blocks read. |
| Index Blocks Read+ | The cumulative number of index blocks read. |
| Index Size (MB) | The size of the specified index (in megabytes). |
| In Packets Discards | The number of inbound packets discarded. |
| In Packets Discards+ | The cumulative number of inbound packets discarded. |
| In Packets Errors | The number of inbound packets that contain errors. |
| In Packets Errors+ | The cumulative number of inbound packets that contain errors. |
| Link Bandwidth (Mbit/s) | The speed of the network adapter (in megabits per second). |
| Load Average - 15 Minute | CPU saturation (in percent) - 15 minute sampling average. |
| Load Average - 1 Minute | CPU saturation (in percent) - 1 minute sampling average. |
| Load Average - 5 Minute | CPU saturation (in percent) - 5 minute sampling average. |
| Load Percentage | CPU saturation in percent. |
| Number of Prepared Transactions+ | The cumulative number of prepared transactions. |
| Number of WAL Files+ | The cumulative number of write-ahead log files. |
| Out Packets Discards | The number of outbound packets discarded. |
| Out Packets Discards+ | The cumulative number of outbound packets discarded. |
| Out Packets Errors | The number of outbound packets that contain errors. |
| Out Packets Errors+ | The cumulative number of outbound packets that contain errors. |
| Packets Received | The number of packets received. |
| Packets Received+ | The cumulative number of packets received. |
| Packets Sent | The number of packets sent. |
| Packets Sent+ | The cumulative number of packets sent. |
| Size (MB) | The total size of the disk (in megabytes). |
| Size of Indexes (MB) | The size of indexes on the specified table (in megabytes). |
| Space Available (MB) | The current disk space available (in megabytes). |
| Space Used (MB) | The current disk space used (in megabytes). |
| Table Size (MB) | The size of the specified table (in megabytes). |
| Tablespace Size (MB) | The size of the specified tablespace (in megabytes). |
| Temp Buffers (MB) | The size of temporary buffers (in megabytes). |
| Toast Blocks Hit | The number of TOAST blocks found in the cache. |
| Toast Blocks Hit+ | The cumulative number of TOAST blocks found in the cache. |
| Toast Blocks Read | The number of TOAST blocks read. |
| Toast Blocks Read+ | The cumulative number of TOAST blocks read. |
| Total RAM Memory | The total amount of RAM memory on the system (in megabytes). |
| Total Swap Memory | The total amount of swap space on the system (in megabytes). |
| Total Table Size w/Indexes and Toast | The total size of the specified table (including indexes and associated oversized attributes). |
| Transactions Aborted | The number of aborted transactions. |
| Transactions Aborted+ | The cumulative number of aborted transactions. |
| Transactions Committed | The number of committed transactions. |
| Transactions Committed+ | The cumulative number of committed transactions. |
| Tuples Deleted | The number of tuples deleted from the specified table. |
| Tuples Deleted+ | The cumulative number of tuples deleted from the specified table. |
| Tuples Estimated by ANALYZE | The number of visible tuples in the specified table. |
| Tuples Estimated by ANALYZE+ | The cumulative number of visible tuples in the specified table. |
| Tuples Fetched | The number of tuples fetched from the specified table. |
| Tuples Fetched+ | The cumulative number of tuples fetched from the specified table. |
| Tuples HOT Updated | The number of tuples HOT updated. In a HOT update, the new tuple resides in the same block as the original tuple and the tuples share an index entry. |
| Tuples HOT Updated+ | The cumulative number of tuples HOT updated. In a HOT update, the new tuple resides in the same block as the original tuple and the tuples share an index entry. |
| Tuples Inserted | The number of tuples inserted into the specified table. |
| Tuples Inserted+ | The cumulative number of tuples inserted into the specified table. |
| Tuples Returned | The number of tuples returned in result sets. |
| Tuples Returned+ | The cumulative number of tuples returned in result sets. |
| Tuples Updated | The number of tuples updated in the specified table. |
| Tuples Updated+ | The cumulative number of tuples updated in the specified table. |
| WAL Segment Size (MB) | The segment size of the write-ahead log (in megabytes). |
Note The ‘+’ following the name of a metric signifies that the data for the metric is gathered cumulatively; those metrics that are not followed by the ‘+’ sign are collected as a ‘point-in-time’ value.
PEM Probes – Reference
A probe is a scheduled task that retrieves information about the database objects that are being monitored by the PEM agent. PEM uses the collected information to build the graphs displayed on each dashboard. The Manage Probes tab (accessed via the Management menu) allows you to modify the data collection schedule and the length of time that PEM will retain information returned by a specific probe.
| Probe Name | Information Monitored by Probe | Level |
|---|---|---|
| Background Writer Statistics | This probe monitors information about the background writer. The information includes: The number of timed checkpoints The number of requested checkpoints The number of buffers written (by checkpoint) The number of buffers written (by background writer) The number of background writer cycles The number of background buffers written The number of buffers allocated |
Server |
| Blocked Session Information | This probe provides information about blocked sessions. | Server |
| CPU Usage | This probe monitors CPU Usage information. | Agent |
| Data and Log File Analysis | This probe monitors information about log files. The information includes: The name of the log file The directory in which the log file resides |
Server |
| Database Frozen XID | This probe monitors the frozen XID of each database. | Server |
| Database Size | This probe monitors information about the size of the monitored databases.The information includes: The time the information was gathered The database name The database size (in MB’s). |
Server |
| Database Statistics | This probe monitors database statistics. The information includes: The number of backends The number of transactions committed The number of transactions rolled back The number of blocks read The number of blocks hit The number of rows returned The number of rows fetched The number of rows inserted The number of rows updated The number of rows deleted |
Server |
| Disk Busy Info | This probe monitors information about disk activity. Note: This probe is not supported on Mac OS X, Solaris or HP-UX |
Agent |
| Disk Space | This probe monitors information about disk space usage. The information includes: The amount of disk space used The amount of disk space available |
Agent |
| EDB Audit Configuration | This probe monitors the audit logging configuration of EDB Postgres Advanced Server. | Server |
| Failover Manager Cluster Info | This probe monitors a Failover Manager cluster, returning information about the cluster. This probe is disabled unless a cluster name and path of the Failover Manager binary is provided on the Server Properties dialog. | Server |
| Failover Manager Node Status | This probe monitors a Failover Manager cluster, returning detailed about each node within the cluster. This probe is disabled unless a cluster name and path of the Failover Manager binary is provided on the Server Properties dialog. | Server |
| Function Statistics | This probe monitors a database, retrieving information about functions. The information includes: Function names Argument types Return values |
Database |
| Index Size | This probe monitors a database, retrieving information about indexes. The information includes: The name of the index The time the data was gathered The size of the index (in MB’s) |
Database |
| Index Statistics | This probe monitors index statistics. The information includes: The number of index scans The number of rows read The number of rows fetched The number of blocks read The number of blocks hit |
Database |
| Installed Packages | This probe monitors the packages that are currently installed. The information gathered includes: The name of the installed package The version of the installed package The date and time that the probe executed |
Agent |
| IO Analysis | This probe monitors disk I/O information in. The information includes: The number of blocks read The number of blocks written The date and time that the probe executed Note: This probe is not supported on Mac OS X |
Agent |
| Load Average | This probe monitors CPU load averages. The information includes: The 1-minute load average The 5-minute load average The 15-minute load average Note: This probe is not supported on Windows |
Agent |
| Lock Information | This probe monitors lock information. The information includes: The database name The lock type The lock mode The process holding the lock |
Server |
| Memory Usage | This probe monitors information about system memory usage.The information includes: Total RAM in MB Free RAM in MB Total swap memory in MB Free swap memory in MB Shared system memory in MB(It is used by tuning wizard to tune the memory parameters for the database server) - On non-windows system, it is shmmax value and read from /proc/sys/kernel/shmmax.- On windows, it is same as total memory. |
Agent |
| Network Statistics | This probe monitors network statistics. The information includes: The interface IP address The number of packets sent The number of packets received The number of bytes sent The number of bytes received The link speed (in MB/second) |
Agent |
| Number of Prepared Transactions | This probe stores the number of prepared transactions. | Server |
| Number of WAL Files | This probe monitors the number of WAL files. | Server |
| Object Catalog: Database | This probe monitors a list of databases and their properties The information includes: The database name The database encoding type If the database allows user connections or system connections |
Server |
| Object Catalog: Foreign Key | This probe monitors a list of foreign keys and their properties. The information includes: The name of the table that contains the foreign key The name of the table that the foreign key references The name of the database in which the table resides The name of the schema in which the table resides |
Schema |
| Object Catalog: Function | This probe monitors a list of functions and their properties. The information includes: The name of the function The name of the schema in which the function resides The name of the database in which the function resides |
Schema |
| Object Catalog: Index | This probe monitors a list of indexes and their properties. The information includes: The name of the index The name of the table that the index is associated with The name of the database in which the indexed table resides |
Schema |
| Object Catalog: Schema | This probe monitors a list of schemas and their associated databases and servers. | Database |
| Object Catalog: Sequence | This probe monitors a list of sequences and their properties. | Schema |
| Object Catalog: Table | This probe monitors a list of table information. The information includes: The table name The name of the schema in which the table resides The name of the database in which the schema resides A Boolean indicator that indicates if the table has a primary key |
Schema |
| Object Catalog: Tablespace | This probe monitors a list of tablespaces. | Server |
| Operating System Information | This probe monitors the operating system details and boot time. | Agent |
| Package Catalog | This probe monitors the packages that are currently available for installation. The information gathered includes: The package name The package version |
Agent |
| PG HBA Conf | This probe monitors authentication configuration information from the pg_hba.conf file. | Server |
| Server Information | This probe monitors server information. | Server |
| Session Information | This probe monitors session information. The information includes: The name of the session user The date and time that the session connected to the server The status of the session at the time that the information was gathered (idle, waiting, etc) The client address and port number |
Server |
| Settings | This probe monitors the values currently assigned to GUC variables. | Server |
| SQL Protect | This probe monitors a server, retrieving information about SQL injection attacks. | Server |
| Slony Replication | This probe monitors lag data for clusters replicated using Slony. | Database |
| Streaming Replication | This probe monitors a cluster that is using streaming replication, retrieving information about: The sent Xlog location (in bytes) The write Xlog location (in bytes) The flush Xlog location (in bytes) The replay Xlog location (in bytes) The Xlog lag (in segments) The Xlog lag (in pages) |
Server |
| Streaming Replication Lag Time | This probe monitors a cluster that is using streaming replication, retrieving lag information about: Replication lag time (in seconds) Current status of replication (running/paused) |
Server |
| Streaming Replication Database Conflicts | This probe monitors a database that is using streaming replication, retrieving information about any conflicts that arise. This includes information about queries that have been canceled due to: The # of drop tablespace conflicts The # of lock timeout conflicts The # of old snapshot conflicts The # of pinned buffer conflicts The # of deadlock conflicts |
Server |
| Table Bloat | This probe monitors information about the current table bloat. The information includes: The name of the table The name of the schema in which the table resides The estimated number of pages The estimated number of wasted pages The estimated number of bytes per row |
Database |
| Table Frozen XID | This probe monitors the frozen XID of each table. | Schema |
| Table Size | This probe monitors information about table size. The information includes: Table size (in MB’s) Total index size (in MB’s) Total table size, with indexes and TOAST (in MB’s) |
Database |
| Table Statistics | This probe monitors table statistics. The information includes: The number of sequential scans The number of sequential scan rows The number of index scans The number of index scan rows The number of rows inserted The number of rows updated The number of rows deleted The number of live rows The number of dead rows The last VACUUM The last auto-vacuum The last ANALYZE The last auto-analyze The number of pages estimated by ANALYZE The number of rows estimated by ANALYZE |
Database |
| Tablespace Size | This probe monitors a list of tablespaces and their sizes. | Server |
| User Information | This probe monitors a list of the current users. The stored information includes: The user name The user type (superuser vs. non-superuser) The server to which the user is connected |
Server |
| WAL Archive Status | This probe monitors the status of the WAL archive. The stored information includes: The # of WAL archives done The # of WAL archives pending The last archive time The # of WAL archives failed The time of the last failure |
Server |
| xDB Replication | This probe monitors lag data for clusters replicated using xDB replication. | Database |
PEM Pre-defined Alert Templates – Reference
An alert definition contains a system-defined or user-defined set of conditions that PEM compares to the system statistics; if the statistics deviate from the boundaries specified for that statistic, the alert triggers, and the PEM client displays a warning on the *Alerts Overview* page, and optionally sends a notification to a monitoring user.
The tables that follow list the system-defined alert templates that you can use to create an alert; please note that this list is subject to change, and may vary by system:
Templates applicable on Agent
| Template Name | Description |
|---|---|
| Load Average (1 minute) | 1-minute system load average. |
| Load Average (5 minutes) | 5-minute system load average. |
| Load Average (15 minutes) | 15-minute system load average. |
| Load Average per CPU Core (1 minutes) | 1-minute system load average per CPU core. |
| Load Average per CPU Core (5 minutes) | 5-minute system load average per CPU core. |
| Load Average per CPU Core (15 minutes) | 15-minute system load average per CPU core. |
| CPU utilization | Average CPU consumption. |
| Number of CPUs running higher than a | Number of CPUs running at greater than K% utilization threshold |
| Free memory percentage | Free memory as a percent of total system memory. |
| Memory used percentage | Percentage of memory used. |
| Swap consumption | Swap space consumed (in megabytes). |
| Swap consumption percentage | Percentage of swap area consumed. |
| Disk Consumption | Disk space consumed (in megabytes). |
| Disk consumption percentage | Percentage of disk consumed. |
| Disk Available | Disk space available (in megabytes). |
| Disk busy percentage | Percentage of disk busy. |
| Most used disk percentage | Percentage used of the most utilized disk on the system. |
| Total table bloat on host | The total space wasted by tables on a host, in MB. |
| Highest table bloat on host | The most space wasted by a table on a host, in MB. |
| Average table bloat on host | The average space wasted by tables on host, in MB. |
| Table size on host | The size of tables on host, in MB. |
| Database size on host | The size of databases on host, in MB. |
| Number of ERRORS in the logfile on agent N in last X hours. | The number of ERRORS in the logfile on agent N in last X hours |
| Number of WARNINGS in the logfile on agent N in last X hours | The number of WARNINGS in the logfile on agent N in last X hours. |
| Number of WARNINGS or ERRORS in the logfile on agent N in last X hours | The number of WARNINGS or ERRORS in the logfile on agent N in last X hours. |
| Package version mismatch | Check for package version mismatch as per catalog. |
| Total materialized view bloat on host | The total space wasted by materialized views on a host, in MB. |
| Highest materialized view bloat on host | The most space wasted by a materialized view on a host, in MB. |
| Average materialized view bloat on host | The average space wasted by materialized views on host, in MB. |
| Materialized view size on host | The size of materialized views on host, in MB. |
| Agent Down | Specified agent is currently down. |
Templates applicable on Server
| Template Name | Description |
|---|---|
| Total table bloat in server | The total space wasted by tables in server, in MB. |
| Largest table (by multiple of unbloated size) | Largest table in server, calculated as a multiple of its own estimated unbloated size; exclude tables smaller than N MB. |
| Highest table bloat in server | The most space wasted by a table in server, in MB. |
| Average table bloat in server | The average space wasted by tables in server, in MB. |
| Table size in server | The size of tables in server, in MB. |
| Database size in server | The size of databases in server, in MB. |
| Number of WAL files | Total number of Write Ahead Log files. |
| Number of prepared transactions | Number of transactions in prepared state. |
| Total connections | Total number of connections in the server. |
| Total connections as percentage of | Total number of connections in the server as a percentage of maximum |
| max_connections | connections allowed on server, settings. |
| Unused, non-superuser connections | Number of unused, non-superuser connections on the server, user_info, settings. |
| Unused, non-superuser connections as percentage of max_connections | Number of unused, non-superuser connections on the server as a percentage of max_connections of max_connections, user_info, settings. |
| Ungranted locks | Number of ungranted locks in server. |
| Percentage of buffers written by backends | The percentage of buffers written by backends vs. the total buffers written. |
| Percentage of buffers written by checkpoint | The percentage of buffers written by the checkpoints vs. the total buffers written. |
| Buffers written per second | Number of buffers written per second, over the last two probe cycles. |
| Buffers allocated per second | Number of buffers allocated per second, over the last two probe cycles. |
| Connections in idle state | Number of connections in server that are in idle state. |
| Connections in idle-in-transaction state | Number of connections in server that are in idle-in-transaction state. |
| Connections in idle-in-transaction state, as percentage of max_connections | Number of connections in server that are in idle-in-transaction state, as a percentage of maximum connections allowed on server, settings. |
| Long-running idle connections | Number of connections in the server that have been idle for more than N seconds. |
| Long-running idle connections and idle transactions | Number of connections in the server that have been idle or transactions idle-in-transaction for more than N seconds. |
| Long-running idle transactions | Number of connections in the server that have been idle in transaction for more than N seconds. |
| Long-running transactions | Number of transactions in server that have been running for more than N seconds. |
| Long-running queries | Number of queries in server that have been running for more than N seconds. |
| Long-running vacuums | Number of vacuum operations in server that have been running for more than N seconds. |
| Long-running autovacuums | Number of autovacuum operations in server that have been running for more than N seconds. |
| Committed transactions percentage | Percentage of transactions in the server that committed vs. that rolled-back over last N minutes. |
| Shared buffers hit percentage | Percentage of block read requests in the server that were satisfied by shared buffers, over last N minutes. |
| Tuples inserted | Tuples inserted into server over last N minutes. |
| InfiniteCache buffers hit percentage | Percentage of block read requests in the server that were satisfied by InfiniteCache, over last N minutes. |
| Tuples fetched | Tuples fetched from server over last N minutes. |
| Tuples returned | Tuples returned from server over last N minutes. |
| Dead Tuples | Number of estimated dead tuples in server. |
| Tuples updated | Tuples updated in server over last N minutes. |
| Tuples deleted | Tuples deleted from server over last N minutes. |
| Tuples hot updated | Tuples hot updated in server, over last N minutes. |
| Sequential Scans | Number of full table scans in server, over last N minutes. |
| Index Scans | Number of index scans in server, over last N minutes. |
| Hot update percentage | Percentage of hot updates in the server over last N minutes. |
| Live Tuples | Number of estimated live tuples in server. |
| Dead tuples percentage | Percentage of estimated dead tuples in server. |
| Last Vacuum | Hours since last vacuum on the server. |
| Last AutoVacuum | Hours since last autovacuum on the server. |
| Last Analyze | Hours since last analyze on the server. |
| Last AutoAnalyze | Hours since last autoanalyze on the server. |
| Percentage of buffers written by backends over the last N minutes | The percentage of buffers written by backends vs. the total buffers backends over last N |
| Table Count | Total number of tables in server. |
| Function Count | Total number of functions in server. |
| Sequence Count | Total number of sequences in server. |
| A user expires in N days | Number of days before a user’s validity expires. |
| Index size as a percentage of table size | Size of the indexes in server, as a percentage of their tables’ size. |
| Largest index by table-size percentage oc_index, table_size. | Largest index in server, calculated as percentage of its table’s size. |
| Number of ERRORS in the logfile on server M in the last X hours | The number of ERRORS in the logfile on server M in last X hours. |
| Number of WARNINGS in the logfile on server M in the last X hours | The number of WARNINGS in logfile on server M in the last X hours. |
| Number of WARNINGS or ERRORS in the logfile on server M in the last X hours | The number of WARNINGS or ERRORS in the logfile on server M in the last X hours. |
| Number of attacks detected in the last N minutes | The number of SQL injection attacks occurred in the last N minutes. |
| Number of attacks detected in the last N minutes by username | The number of SQL injection attacks occurred in the last N minutes by username. |
| Number of replica servers lag behind the primary by write location | > Streaming Replication: number of replica servers lag behind the primary by write location. |
| Number of replica servers lag behind the primary by flush location | > Streaming Replication: number of replica servers lag behind the primary by flush location. |
| Number of replica servers lag behind the primary by replay location | > Streaming Replication: number of replica servers lag behind the primary by replay location. |
| Replica server lag behind the primary by write location | > Streaming Replication: replica server lag behind the primary by write location in MB. |
| Replica server lag behind the primary by flush location | > Streaming Replication: replica server lag behind the primary by flush location in MB. |
| Replica server lag behind the primary by replay location | > Streaming Replication: replica server lag behind the primary by replay location in MB. |
| Replica server lag behind the primary by size (MB) | > Streaming Replication: replica server lag behind the primary by size in MB. |
| Replica server lag behind the primary by WAL segments | > Streaming Replication: replica server lag behind the primary by WAL segments. |
| Replica server lag behind the primary by WAL pages | > Streaming Replication: replica server lag behind the primary by WAL pages. |
| Total materialized view bloat in server | The total space wasted by materialized views in server, in MB. |
| Largest materialized view (by multiple of unbloated size) | Largest materialized view in server, calculated as a multiple of its own estimated unbloated size; exclude materialized views smaller than N MB. |
| Highest materialized view bloat in server | The most space wasted by a materialized view in server, in MB. |
| Average materialized view bloat in server | The average space wasted by materialized views in server, in MB. |
| Materialized view size in server | The size of materialized view in server, in MB. |
| View Count | Total number of views in server. |
| Materialized View Count | Total number of materialized views in server. |
| Audit config mismatch | Check for audit config parameter mismatch |
| Server Down | Specified server is currently inaccessible. |
| Number of WAL archives pending | Streaming Replication: number of WAL files pending to be replayed at replica. |
| Number of minutes lag of replica server from primary server | > Streaming Replication: number of minutes replica node is lagging behind the primary node. |
| Log config mismatch | Check for log config parameter mismatch. |
Templates applicable on Database
| Template Name | Description |
|---|---|
| Total table bloat in database | The total space wasted by tables in database, in MB. |
| Largest table (by multiple of unbloated size) | Largest table in database, calculated as a multiple of its own estimated unbloated size; exclude tables smaller than N MB. |
| Highest table bloat in database | The most space wasted by a table in database, in MB. |
| Average table bloat in database | The average space wasted by tables in database, in MB. |
| Table size in database | The size of tables in database, in MB. |
| Database size | The size of the database, in MB. |
| Total connections | Total number of connections in the database. |
| Total connections as percentage of max_connections | Total number of connections in the database as a percentage of maximum connections allowed on server, settings. |
| Ungranted locks | Number of ungranted locks in database. |
| Connections in idle state | Number of connections in database that are in idle state. |
| Connections in idle-in-transaction state | Number of connections in database that are in idle-in-transaction state |
| Connections in idle-in-transaction state,as percentage of max_connections | Number of connections in database that are in idle-in-transaction state, as a percentage of maximum connections allowed on server, settings. |
| Long-running idle connections | Number of connections in the database that have been idle for more than N seconds. |
| Long-running idle connections and idle transactions | Number of connections in the database that have been idle or idle-in-transaction for more than N seconds. |
| Long-running idle transactions | Number of connections in the database that have been idle in transaction for more than N seconds. |
| Long-running transactions | Number of transactions in database that have been running for more than N seconds. |
| Long-running queries | Number of queries in database that have been running for more than N seconds. |
| Long-running vacuums | Number of vacuum operations in database that have been running for more than N seconds. |
| Long-running autovacuums | Number of autovacuum operations in database that have been running for more than N seconds. |
| Committed transactions percentage | Percentage of transactions in the database that committed vs. that rolled-back over last N minutes. |
| Shared buffers hit percentage | Percentage of block read requests in the database that were satisfied by shared buffers, over last N minutes. |
| InfiniteCache buffers hit percentage | Percentage of block read requests in the database that were satisfied by InfiniteCache, over last N minutes. |
| Tuples fetched | Tuples fetched from database over last N minutes. |
| Tuples returned | Tuples returned from database over last N minutes. |
| Tuples inserted | Tuples inserted into database over last N minutes. |
| Tuples updated | Tuples updated in database over last N minutes. |
| Tuples deleted | Tuples deleted from database over last N minutes. |
| Tuples hot updated | Tuples hot updated in database, over last N minutes. |
| Sequential Scans | Number of full table scans in database, over last N minutes. |
| Index Scans | Number of index scans in database, over last N minutes. |
| Hot update percentage | Percentage of hot updates in the database over last N minutes. |
| Live Tuples | Number of estimated live tuples in database. |
| Dead Tuples | Number of estimated dead tuples in database. |
| Dead tuples percentage | Percentage of estimated dead tuples in database. |
| Last Vacuum | Hours since last vacuum on the database. |
| Last AutoVacuum | Hours since last autovacuum on the database. |
| Last Analyze | Hours since last analyze on the database. |
| Last AutoAnalyze | Hours since last autoanalyze on the database. |
| Table Count | Total number of tables in database. |
| Function Count | Total number of functions in database. |
| Sequence Count | Total number of sequences in database. |
| Index size as a percentage of table size | Size of the indexes in database, as a percentage of their tables’ size. |
| Largest index by table-size percentage | Largest index in database, calculated as percentage of its table’s size, oc_index, table_size. |
| Database Frozen XID | The age (in transactions before the current transaction) of the database’s frozen transaction ID. |
| Number of attacks detected in the | The number of SQL injection attacks occurred in the last N minutes. last N minutes |
| Number of attacks detected in the | The number of SQL injection attacks occurred in the last N minutes by last N minutes by username. |
| Queries that have been cancelled due to dropped tablespaces | Streaming Replication: number of queries that have been cancelled due to dropped tablespaces. |
| Queries that have been cancelled due to lock timeouts | Streaming Replication: number of queries that have been cancelled due to lock timeouts. |
| Queries that have been cancelled due to old snapshots | Streaming Replication: number of queries that have been cancelled due to old snapshots. |
| Queries that have been cancelled due to pinned buffers | Streaming Replication: number of queries that have been cancelled due to pinned buffers. |
| Queries that have been cancelled due to deadlocks | Streaming Replication: number of queries that have been cancelled due to deadlocks. |
| Total events lagging in all slony clusters | Slony Replication: total events lagging in all slony clusters. |
| Events lagging in one slony cluster | Slony Replication: events lagging in one slony cluster. |
| Lag time (minutes) in one slony cluster | Slony Replication: lag time (minutes) in one slony cluster. |
| Total rows lagging in xdb single primary replication | > xDB Replication: Total rows lagging in xdb single primary replication |
| Total rows lagging in xdb multi primary replication | > xDB Replication: Total rows lagging in xdb multi primary replication. |
| Total materialized view bloat in database | The total space wasted by materialized views in database, in MB. |
| Largest materialized view (by multiple of unbloated size) | Largest materialized view in database, calculated as a multiple of its estimated unbloated size; exclude materialized views smaller than N MB. |
| Highest materialized view bloat in database | The most space wasted by a materialized view in database, in MB. |
| Average materialized view bloat in database | The average space wasted by materialized views in database, in MB. |
| Materialized view size in database | The size of materialized view in database, in MB. |
| View Count | Total number of views in database. |
| Materialized View Count | Total number of materialized views in database. |
Templates applicable on Schema
| Template Name | Description |
|---|---|
| Total table bloat in schema | The total space wasted by tables in schema, in MB. |
| Largest table (by multiple of unbloated size) | Largest table in schema, calculated as a multiple of its own estimated unbloated size; exclude tables smaller than N MB. |
| Highest table bloat in schema | The most space wasted by a table in schema, in MB. |
| Average table bloat in schema | The average space wasted by tables in schema, in MB. |
| Table size in schema | The size of tables in schema, in MB. |
| Tuples inserted | Tuples inserted in schema over last N minutes. |
| Tuples updated | Tuples updated in schema over last N minutes. |
| Tuples deleted | Tuples deleted from schema over last N minutes. |
| Tuples hot updated | Tuples hot updated in schema, over last N minutes. |
| Sequential Scans | Number of full table scans in schema, over last N minutes. |
| Index Scans | Number of index scans in schema, over last N minutes. |
| Hot update percentage | Percentage of hot updates in the schema over last N minutes. |
| Live Tuples | Number of estimated live tuples in schema. |
| Dead Tuples | Number of estimated dead tuples in schema. |
| Dead tuples percentage | Percentage of estimated dead tuples in schema. |
| Last Vacuum | Hours since last vacuum on the schema. |
| Last AutoVacuum | Hours since last autovacuum on the schema. |
| Last Analyze | Hours since last analyze on the schema. |
| Last AutoAnalyze | Hours since last autoanalyze on the schema. |
| Table Count | Total number of tables in schema. |
| Function Count | Total number of functions in schema. |
| Sequence Count | Total number of sequences in schema. |
| Index size as a percentage of table size | Size of the indexes in schema, as a percentage of their table’s size. |
| Largest index by table-size percentage | Largest index in schema, calculated as percentage of its table’s size, oc_index, table_size |
| Materialized View bloat | Space wasted by the materialized view, in MB. |
| Total materialized view bloat in schema | The total space wasted by materialized views in schema, in MB. |
| Materialized view size as a multiple of unbloated size | Size of the materialized view as a multiple of estimated unbloated size. |
| Largest materialized view (by multiple of unbloated size) | Largest materialized view in schema, calculated as a multiple of its own estimated unbloated size; exclude materialized view smaller than N MB. |
| Highest materialized view bloat in schema | The most space wasted by a materialized view in schema, in MB. |
| Average materialized view bloat in schema | The average space wasted by materialized views in schema, in MB. |
| Materialized view size | The size of materialized view, in MB. |
| Materialized view size in schema | The size of materialized views in schema, in MB. |
| View Count | Total number of views in schema. |
| Materialized View Count | Total number of materialized views in schema. |
| Materialized View Frozen XID | The age (in transactions before the current transaction) of the materialized view’s frozen transaction ID. |
Templates applicable on Table
| Template Name | Description |
|---|---|
| Table bloat | Space wasted by the table, in MB. |
| Table size | The size of table, in MB. |
| Table size as a multiple of ubloated size | Size of the table as a multiple of estimated unbloated size. |
| Tuples inserted | Tuples inserted in table over last N minutes. |
| Tuples updated | Tuples updated in table over last N minutes. |
| Tuples deleted | Tuples deleted from table over last N minutes. |
| Tuples hot updated | Tuples hot updated in table, over last N minutes. |
| Sequential Scans | Number of full table scans on table, over last N minutes. |
| Index Scans | Number of index scans on table, over last N minutes. |
| Hot update percentage | Percentage of hot updates in the table over last N minutes. |
| Live Tuples | Number of estimated live tuples in table. |
| Dead Tuples | Number of estimated dead tuples in table. |
| Dead tuples percentage | Percentage of estimated dead tuples in table. |
| Last Vacuum | Hours since last vacuum on the table. |
| Last AutoVacuum | Hours since last autovacuum on the table. |
| Last Analyze | Hours since last analyze on the table. |
| Last AutoAnalyze | Hours since last autoanalyze on the table. |
| Row Count | Estimated number of rows in a table. |
| Index size as a percentage of table size | Size of the indexes on table, as a percentage of table’s size. |
| Table Frozen XID | The age (in transactions before the current transaction) of the table’s frozen transaction ID. |
Global Templates
| Template Name | Description |
|---|---|
| Agents Down | Number of agents that haven’t reported in recently. |
| Servers Down | Number of servers that are currently inaccessible. |
| Alert Errors | Number of alerts in an error state. |
Monitoring BDR Nodes
BDR (Bi-Directional Replication) is a PostgreSQL extension that provides a multi-master replication between the Postgres clusters. Before you monitor BDR through PEM console, you must ensure that your BDR nodes are up and running. For more information about BDR, please see BDR Documentation.
You can configure PEM to display status information about one or more BDR Nodes via dashboards from PEM 8.1.0 and BDR 3.7.9 onwards.
To configure PEM to monitor BDR Nodes, use the PEM Web Client to create a server definition. Use the tabs on the New Server Registration dialog to specify general connection properties for the BDR Node with the following exceptions:
Specify the BDR-enabled database name in the
Databasefield of thePEM Agenttab.Specify the user having
bdr_monitororbdr_superuserrole in theusernamefield of thePEM Agenttab.
After saving the server definition, the BDR Node will be included in the list of servers under the PEM Server Directory in the PEM client object browser tree. You can monitor the BDR Nodes from BDR dashboards.
To include monitoring information on the BDR dashboards, you must enable the relative probes for each BDR Group. You can see the complete list of BDR Probes here.
To enable a probe, right click on the node name, and select Manage Probes from the Management menu.
To monitor the BDR Node, right click on the name of the BDR Node in the Object browser tree control and navigate through the Dashboards menu to select BDR Admin or BDR Group Monitoring or BDR Node Monitoring dashboard.