PEM 8.1 -PEM SQL Profiler Guide
EnterpriseDB
SQL Profiler
Postgres Enterprise Manager (PEM) is designed to assist database administrators, system architects, and performance analysts when administering, monitoring, and tuning PostgreSQL and Advanced Server database servers. PEM has been designed to manage and monitor a single server or multiple servers from a single console, allowing complete control over monitored databases.
The SQL Profiler Plugin works with PEM to allow you to profile a server’s workload. The SQL Profiler plugin may be installed on servers with or without a PEM Agent, however traces can only be run in ad-hoc mode on unmanaged servers, and may only be scheduled on managed servers.
This document provides step-by-step instructions to guide you through the installation and use of SQL Profiler.
SQL Profiler is officially supported only on the EDB distributions of PostgreSQL and Advanced Server supported versions . The plugin is distributed via StackBuilder, or as operating system dependent packages in EDB’s yum repositories. The plugin is also distributed and installed with the Advanced Server installations.
Throughout this guide, the term Postgres refers to either a PostgreSQL or an Advanced Server installation, where either is appropriate.
installing_the_sql_profiler_plugin using_sql_profiler uninstalling_sql_profiler conclusion
Installing the SQL Profiler Plugin
You must install the plugin on each server on which you wish to use SQL Profiler. For example, if you have a host running PostgreSQL 9.6 and PostgreSQL 10, you must install two versions of the plugin, one for each server.
Follow the installation steps listed below to install the plugin for PostgreSQL before continuing to the Configuration section. If you are using Advanced Server, you can skip installation and move ahead to the Configuration section.
You can use the graphical installer to install any version of SQL Profiler on the Windows platform. On Linux, use an RPM package to install the SQL Profiler. For detailed information about configuring the EDB repository for your host platform, see the PEM Linux Installation Guide.
Installing SQL Profiler on Windows
To invoke the SQL Profiler graphical installer, assume Administrator privileges, navigate into the directory that contains the installer, and double-click the installer icon. The SQL Profiler installer welcomes you to the Setup Wizard.
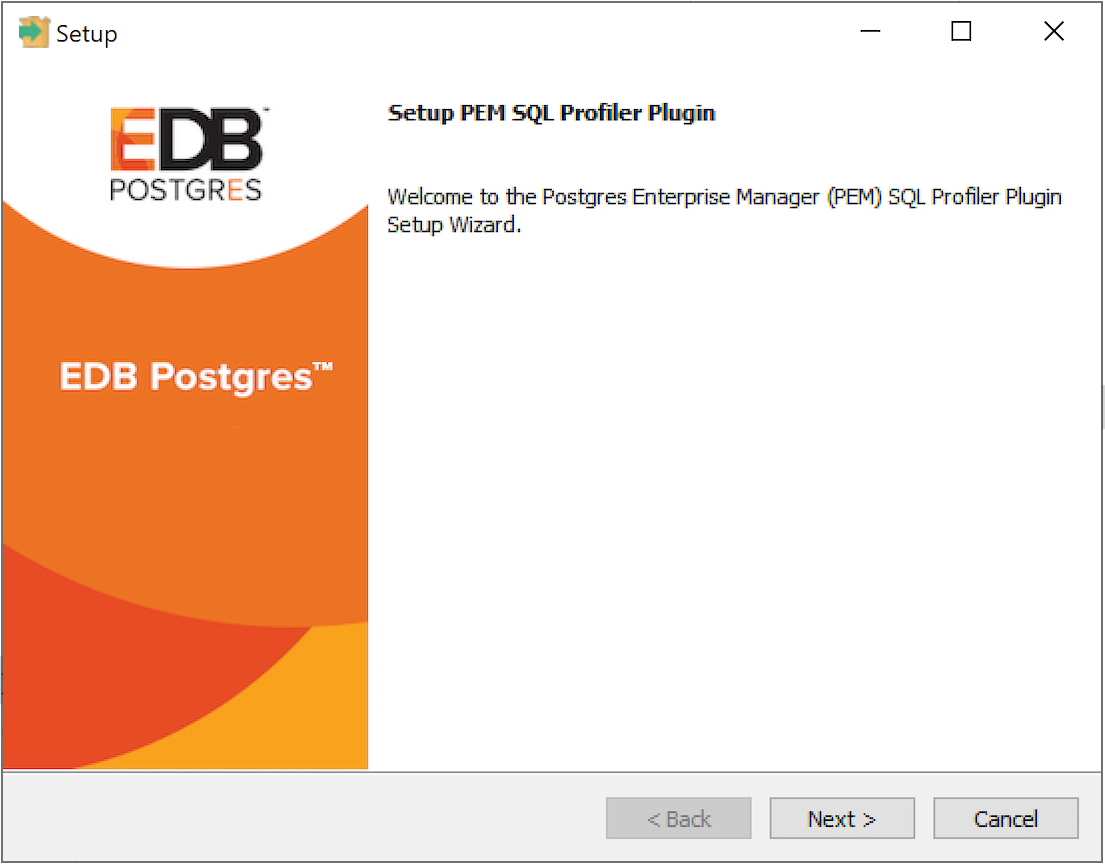
Click Next to continue to the License Agreement.
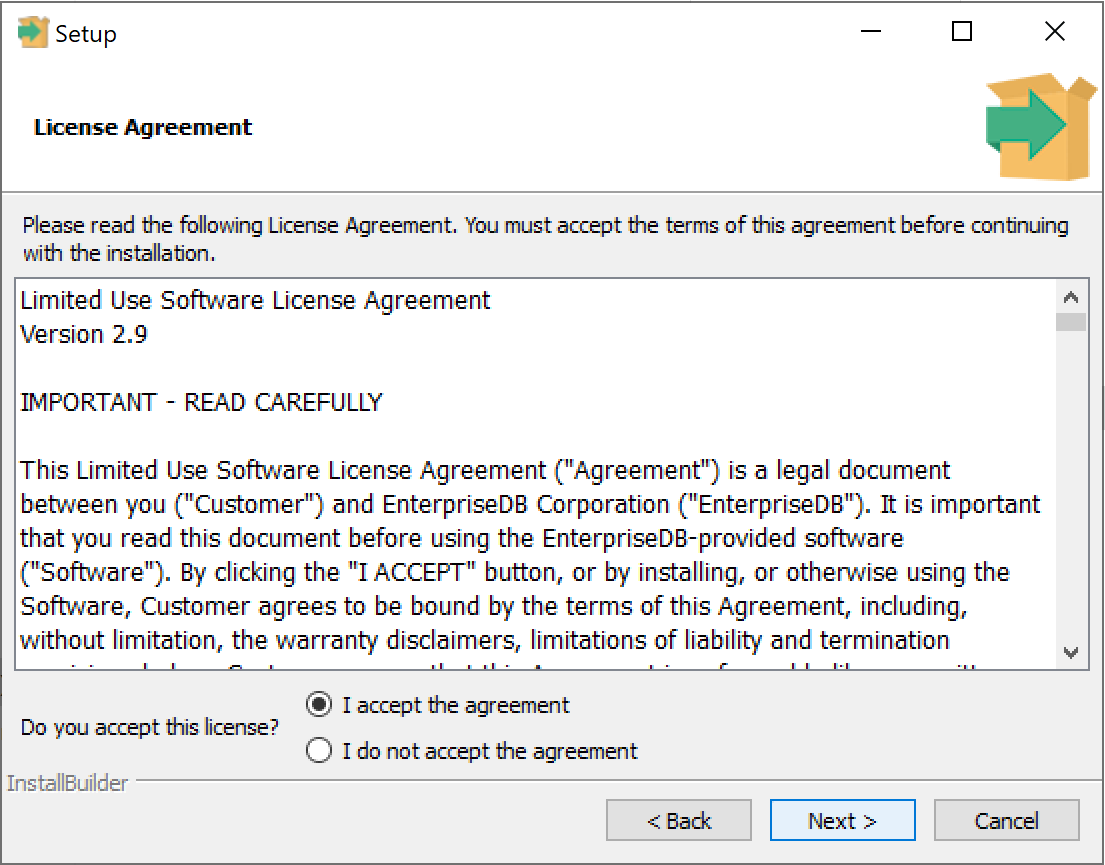
Carefully review the license agreement before highlighting the appropriate radio button and accepting the agreement; click Next to continue to the Installation Directory dialog.

Specify an alternate location for the installation directory, or accept the default location and click Next to continue.
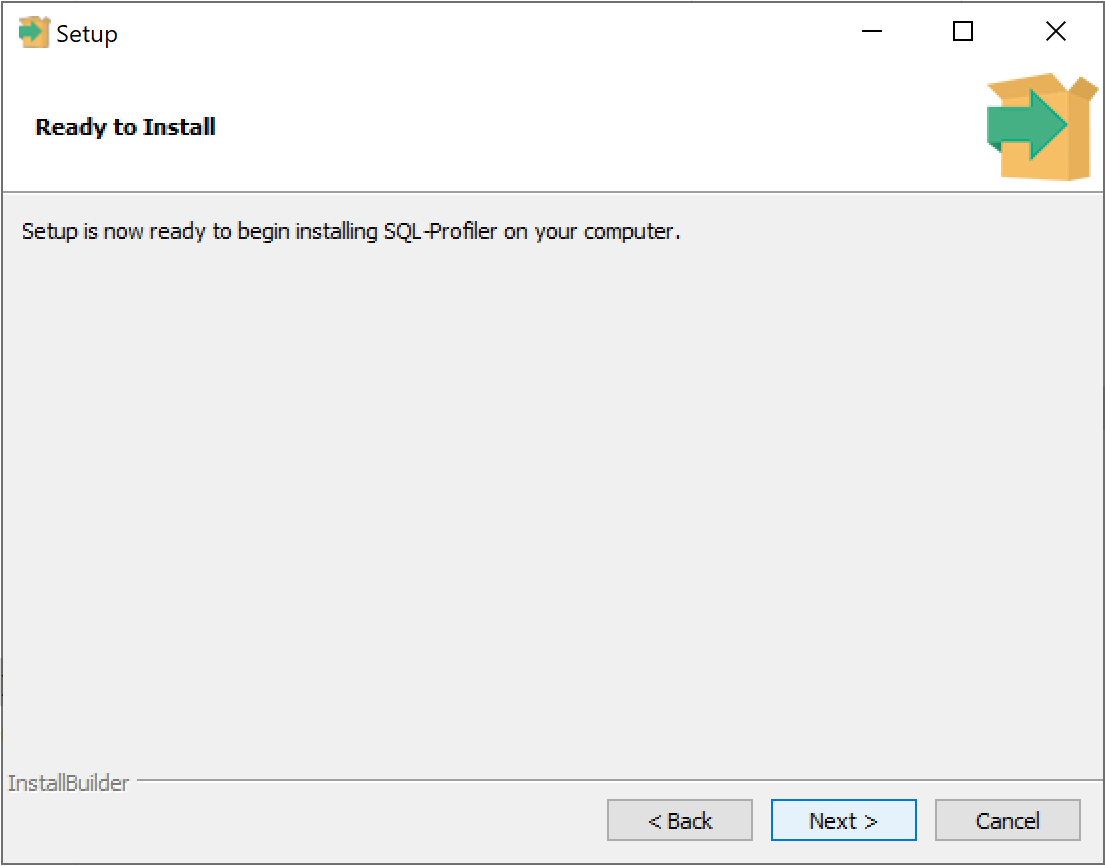
The wizard is now ready to install the SQL Profiler plugin. Click Next to continue.
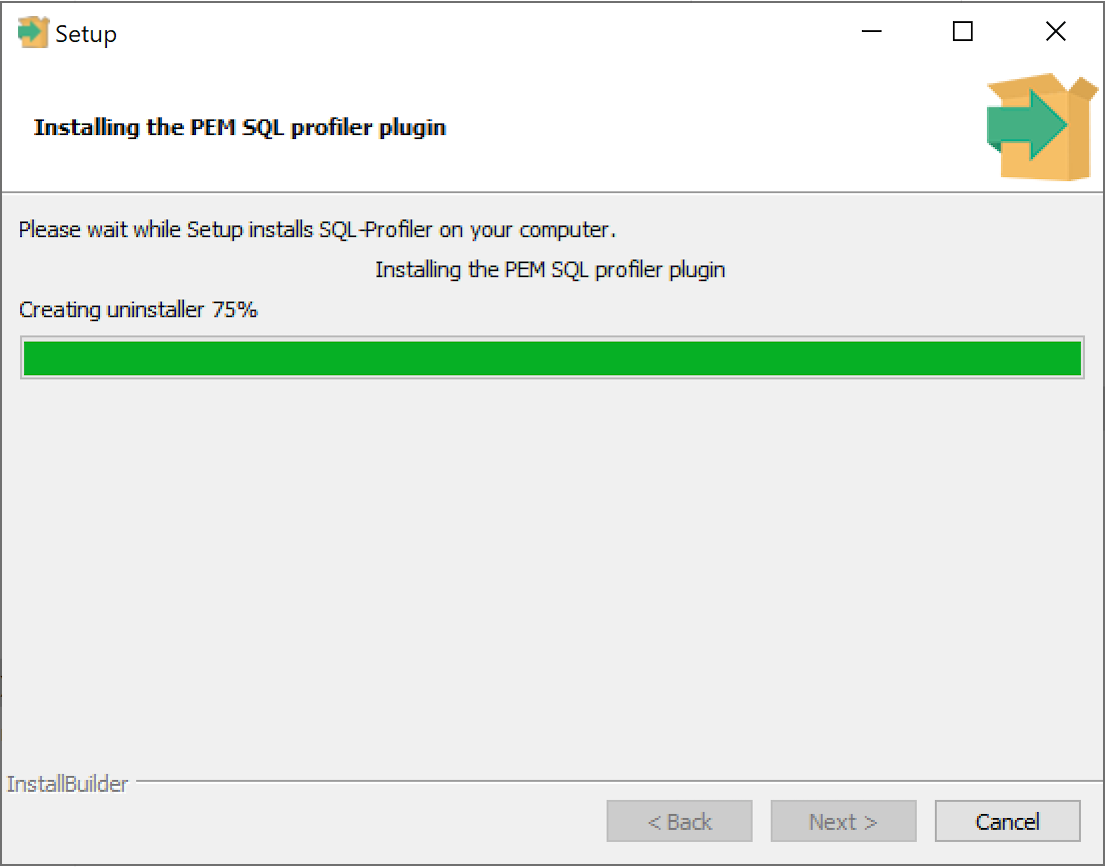
The SQL Profiler plugin installer displays progress bars as it copies files to your system.
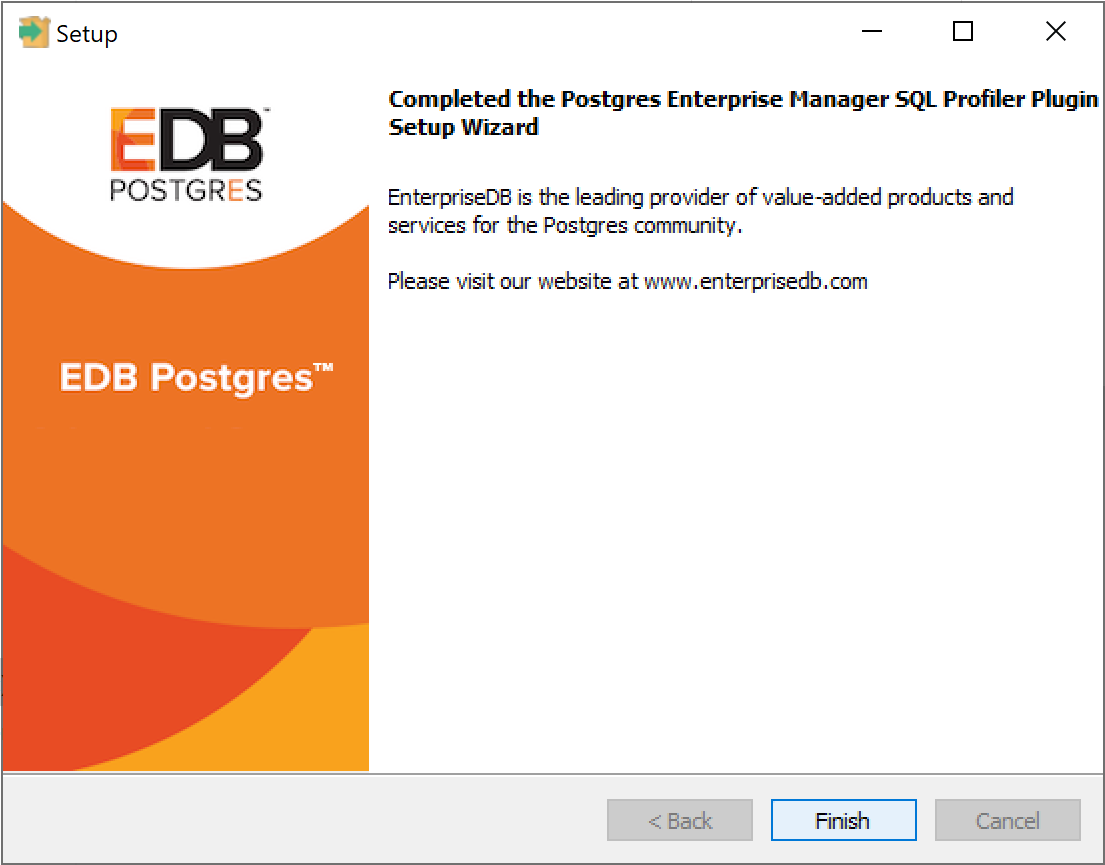
When the installation is complete, the SQL Profiler plugin is ready to be configured.
Using an RPM Package to Install SQL Profiler
Note You may be required to add the
sslutilspackage to your PostgreSQL database servers before installing SQL Profiler.
If you have already configured the EDB repository on your system, you can use yum or dnf to install SQL Profiler:
yum install postgresql<X>-sqlprofiler

or

dnf install postgresql<X>-sqlprofiler
Where, <X> is the version of your Postgres installation.
For detailed information about configuring the EDB repository, please see the PEM Linux Installation Guide.
Installing SQL Profiler on Debian/Ubuntu
Note You may be required to add the
sslutilspackage to your PostgreSQL database servers before installing SQL Profiler.
You can use an apt command to install SQL Profiler using DEB on Debian 9.x or Ubuntu 18; assume root privileges and enter:
apt install postgresql-<X>-sqlprofilerWhere, <X> is the version of your Postgres installation.
When the installation is complete, the SQL Profiler plugin is ready to be configured.
Configuring SQL Profiler
The SQL Profiler plugin is not automatically enabled when the installation process completes. This allows you to restart the server at a convenient time, and prevents the plugin from being loaded unnecessarily on systems where it is not required on a continual basis.
Use the following steps to enable the plugin:
- Edit the
postgresql.conffile on the server you wish to profile, modifying theshared_preload_librariesparameter as shown below:
shared_preload_libraries = '$libdir/sql-profiler'Restart the Postgres server.
Using the
Query Toolor thepsqlcommand line interface, run thesql-profiler.sqlscript in the database specified as theMaintenance Databaseon the server you wish to profile. If you are using:- PostgreSQL, the default maintenance database is
postgres. - Advanced Server, the default maintenance database is
edb.
To use the PEM Query Tool to run the script, highlight the name of the maintenance database in the
Browsertree control, and navigate through theToolsmenu to selectQuery tool. When the Query Tool opens, use theOpenoption on theFilesmenu to open a web browser and navigate to thesql-profiler.sqlscript. By default, thesql-profiler.sqlscript is located in thecontribfolder, under your Postgres installation.When the script opens in the
SQL Editorpanel of the Query Tool, highlight the content of the script in the SQL Editor and select theExecuteoption from theQuerymenu (or click theExecuteicon) to invoke the script and configure SQL Profiler.You can also use the psql command line to invoke the configuration script. The following command uses psql to invoke the
sql-profiler.sqlscript on an Advanced Server database on a Linux system:- PostgreSQL, the default maintenance database is
$ /usr/edb/as<x>/bin/psql -U postgres postgres < /usr/edb/as<x>/share/contrib/sql-profiler.sqlwhere <x> is the version of the Advanced Server.
After configuring SQL Profiler, it is ready to use with all databases that reside on the server.
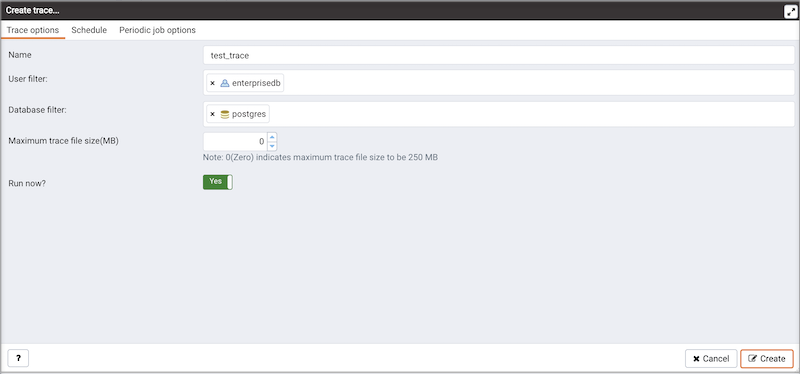
To access SQL Profiler functionality, highlight the name of the monitored Server/ database in the PEM Browser tree control; under Tools menu navigate through Server option to the SQL Profiler pull-aside menu. Menu options allow you to manage your SQL traces:
- Select
Create trace… to define a new trace. - Select
Open trace… to open an existing trace. - Select
Delete trace(s)… to delete one or more traces. - Select
View scheduled trace(s)… to review a list of scheduled traces.
SQL Profiling and Analysis
Most RDBMS experts agree that inefficient SQL code is the leading cause of most database performance problems. The challenge for DBAs and developers is to locate the poorly-running SQL code in large and complex systems, and then optimize that code for better performance.
The SQL Profiler component allows a database superuser to locate and optimize poorly-running SQL code. Users of Microsoft SQL Server’s Profiler will find PEM’s SQL Profiler very similar in operation and capabilities. SQL Profiler is installed with each Advanced Server instance; if you are using PostgreSQL, you must download the SQL Profiler installer, and install the SQL Profiler product into each managed database instance you wish to profile.
For each database monitored by SQL Profiler, you must:
Edit the
postgresql.conffile; you must include the SQL Profiler library in the shared_preload_libraries configuration parameter.For Linux installations, the parameter value should include:
$libdir/sql-profileron Windows, the parameter value should include:
$libdir/sql-profiler.dllCreate the functions used by SQL Profiler in your database. The SQL Profiler installation program places a SQL script (named sql-profiler.sql) in the
share/postgresql/contribsubdirectory of the main PostgreSQL installation directory on Linux systems. On Windows systems, this script is located in thesharesubdirectory. You must invoke this script on the maintenance database specified when registering the server with PEM.Stop and re-start the server for the changes to take effect.
Please note: if you have connected to the PEM server with the PEM client before configuring SQL Profiler, you must disconnect and reconnect with the server to enable SQL Profiler functionality. For more detailed information about installing and configuring the SQL Profiler plugin, please refer to the PEM Installation Guides.
Creating a New SQL Trace
SQL Profiler captures and displays a specific SQL workload for analysis in a SQL trace. You can start and review captured SQL traces immediately, or save captured traces for review at a later time. You can use SQL Profiler to create and store up to 15 named traces; use menu options to create and manage traces.
Creating a Trace
You can use the Create trace... dialog to define a SQL Trace for any database on which SQL Profiler has been installed and configured. installed and configured. To access the dialog, highlight the name of the database in the PEM client tree control; navigate through the Management menu to the SQL Profiler pull-aside menu, and select Create trace….
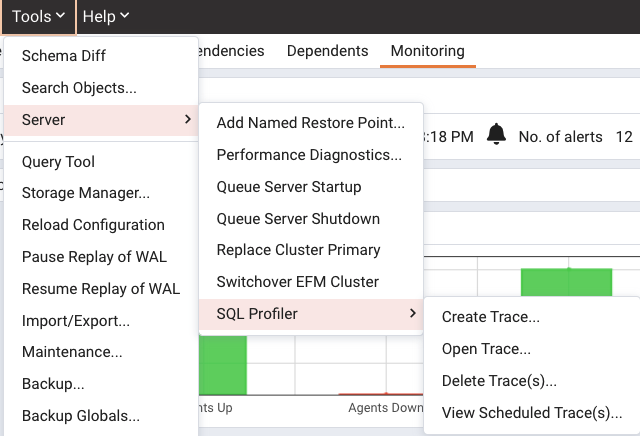
Use the fields on the Trace options tab to specify details about the new trace:
- Provide a name for the trace in the Name field.
- Click in the
User filterfield to specify the roles whose queries will be included the trace; optionally, check the box next to Select All to include queries from all roles. - Click in the
Database filterfield to specify which databases to trace; optionally, check the box next to Select All to include queries against all databases. - Specify a
trace size in the Maximum Trace File Sizefield; SQL Profiler will terminate the trace when it reaches approximately the size specified. - Specify Yes in the
Run Nowfield to start the trace when you select the Create button; select No to enable fields on the Schedule tab.
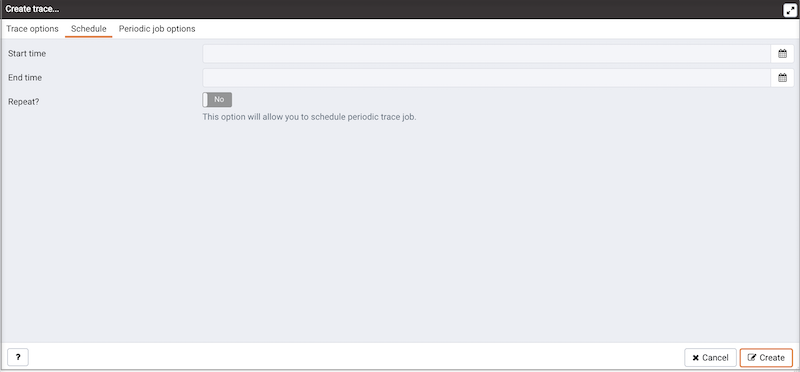
Use the fields on the Schedule tab to specify scheduling details for the new trace:
- Use the
Start timefield to specify the starting time for the trace. - Use the
End timefield to specify the ending time for the trace. - Specify Yes in the
Repeat?field to indicate that the trace should be repeated every day at the times specified; select No to enable fields on the Periodic job options tab.
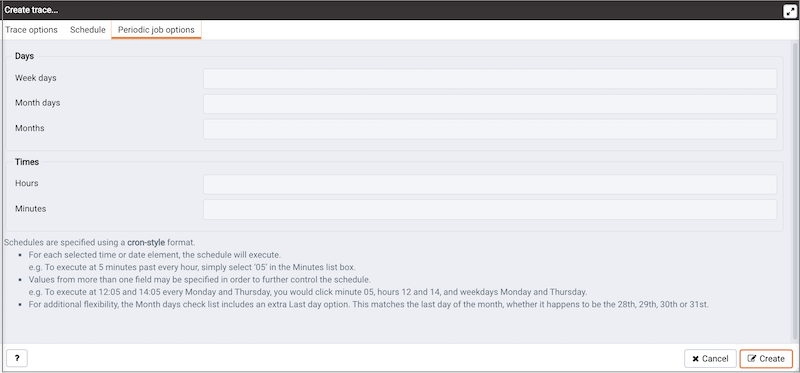
Fields on the Periodic job options tab specify scheduing details about a recurring trace. Use fields in the Days section to specify the days on which the job will execute:
- Click in the
Week daysfield to select the days of the week on which the trace will execute. - Click in the
Month daysfield to select the days of the month on which the trace will execute. - Click in the
Monthsfield to select the months in which the trace will execute.
Use fields in the Times section to specify a time schedule for the trace execution:
- Click in the
Hoursfield to select the hours at which the trace will execute. - Click in the
Minutesfield to select the hours at which the trace will execute.
When you’ve completed the Create trace... dialog, click Create to start the newly defined trace or to schedule the trace for a later time.
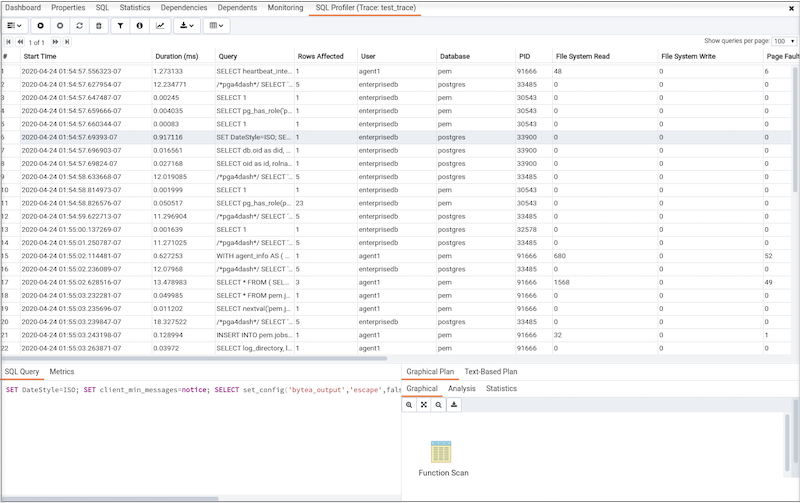
If you elect to execute the trace immediately, the trace results will display in the PEM client.
Opening an Existing Trace
To view a previous trace, highlight the name of the profiled database in the PEM client tree control; navigate through the Management menu to the SQL Profiler pull-aside menu, and select Open trace.... You can also use the SQL Profiler toolbar menu to open a trace; select the Open trace... option. The Open trace… dialog opens.
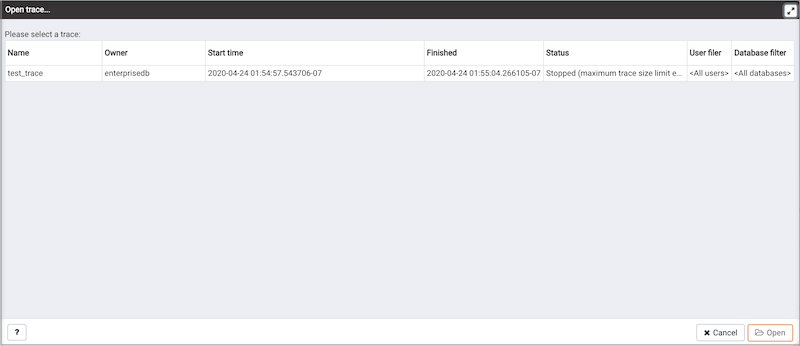
Highlight an entry in the trace list and click Open to open the selected trace. The selected trace opens in the SQL Profiler tab.
Filtering a Trace
A filter is a named set of (one or more) rules, each of which can hide events from the trace view. When you apply a filter to a trace, the hidden events are not removed from the trace, but are merely excluded from the display.
Click the Filter icon to open the Trace Filter dialog and create a rule (or set of rules) that define a filter. Each rule will screen the events within the current trace based on the identity of the role that invoked the event, or the query type invoked during the event.
To open an existing filter, select the Open button; to define a new filter, click the Add (+) icon to add a row to the table displayed on the General tab and provide rule details:
- Use the
Typedrop-down listbox to specify the trace field that the filter rule will apply to. - Use the
Conditiondrop-down listbox to specify the type of operator that SQL Profiler will apply to the Value when it filters the trace:- Select
Matches tofilter events that contain the specified Value. - Select
Does not matchto filter events that do not contain the specified Value. - Select
Is equal toto filter events that contain an exact match to the string specified in the Value field. - Select
Is not equalto to filter events that do not contain an exact match to the string specified in the Value field. - Select
Starts withto filter events that begin with the string specified in the Value field. - Select
Does not start withto filter events that do not begin with the string specified in the Value field. - Select
Less thanto filter events that have a numeric value less than the number specified in the Value field. - Select
Greater thanto filter events that have a numeric value greater than the number specified in the Value field. - Select
Less than or equal toto filter events that have a numeric value less than or equal to the number specified in the Value field. - Select
Greater than or equal toto filter events that have a numeric value greater than or equal to the number specified in the Value field.
- Select
- Use the
Valuefield to specify the string, number or regular expression that SQL Profiler will search for.
When you’ve finished defining a rule, click the Add (+) icon to add another rule to the filter. To delete a rule from a filter, highlight the rule and click the Delete icon.
Click the Save button to save the filter definition to a file without applying the filter; to apply the filter, click OK. Select Cancel to exit the dialog and discard any changes to the filter.
Deleting a Trace
To delete a trace, highlight the name of the profiled database in the PEM client tree control; navigate through the Management menu to the SQL Profiler pull-aside menu, and select Delete trace(s).... You can also use the SQL Profiler toolbar menu to delete a trace; select the Delete trace(s)... option. The Delete traces dialog opens.
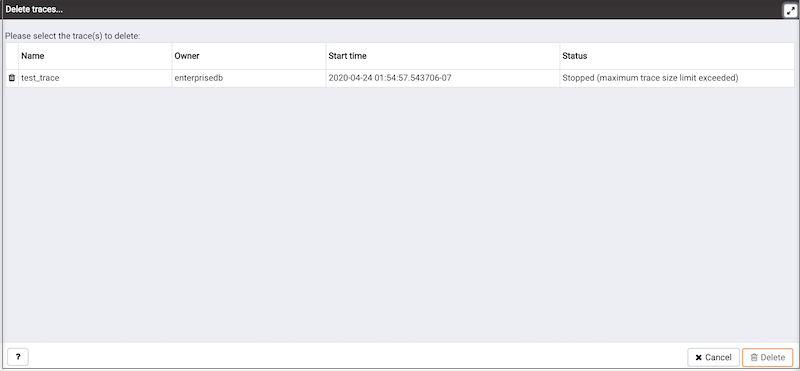
Click the icon to the left of a trace name to mark one or more traces for deletion and click Delete. The PEM client will acknowledge that the selected traces have been deleted.
Viewing Scheduled Traces
To view a list of scheduled traces, highlight the name of the profiled database in the PEM client tree control; navigate through the Management menu to the SQL Profiler pull-aside menu, and select Scheduled traces... You can also use the SQL Profiler toolbar menu to the list; select the Scheduled traces... option.
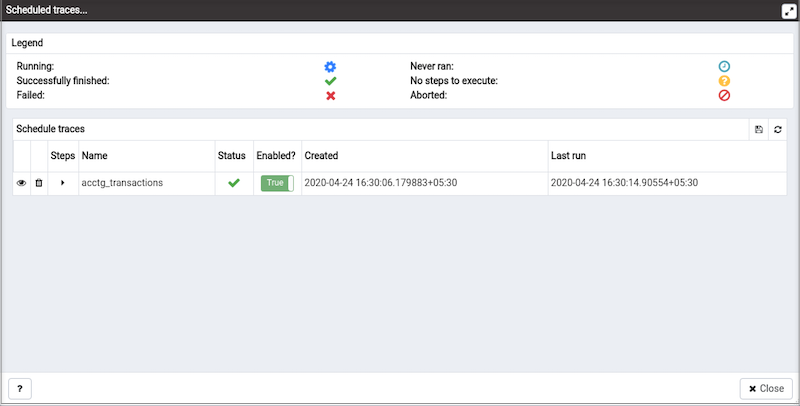
The Scheduled traces... dialog displays a list of the traces that are awaiting execution. Click the edit button to the left of a trace name to access detailed information about the trace:
- The
Statusfield lists the status of the current trace. - The
Enabled?switch displays Yes if the trace is enabled; No if it is disabled. - The
Namefield displays the name of the trace. - The
Agentfield displays the name of the agent responsible for executing the trace. - The
Last runfield displays the date and time of the last execution of the trace. - The
Next runfield displays the date and time of the next scheduled trace. - The
Createdfield displays the date and time that the trace was defined.
Using the Index Advisor
Index Advisor is distributed with Advanced Server 9.0 and above. Index Advisor works with SQL Profiler by examining collected SQL statements and making indexing recommendations for any underlying tables to improve SQL response time. The Index Advisor works on all DML (INSERT, UPDATE, DELETE) and SELECT statements that are invoked by a superuser.
Diagnostic output from the Index Advisor includes:
- Forecasted performance benefits from any recommended indexes
- The predicted size of any recommended indexes
- DDL statements you can use to create the recommended indexes
Before using Index Advisor, you must:
Modify the
postgresql.conffile on each Advanced Server host, adding the index_advisor library to the shared_preload_libraries parameter.Install the
Index Advisor contribmodule. To install the module, use the psql client or PEM Query Tool to connect to the database, and invoke the following command:\i <complete_path>/share/contrib/index_advisor.sqlRestart the server for your changes to take effect.
Index Advisor can make indexing recommendations based on trace data captured by SQL Profiler. Simply highlight one or more queries in the SQL Profiler Trace Data pane, and click the Index Advisor toolbar button (or select Index Advisor from the View menu). For detailed usage information about Index Advisor, please see the EDB Postgres Advanced Server Guide.
Please note: Index Advisor cannot analyze statements invoked by a non-superuser. If you attempt to analyze statements invoked by a non-superuser, the server log will include the following error:
ERROR: access to library "index_advisor" is not allowed
Note It is recommended that you disable the index advisor while using the pg_dump functionality.
For more information about configuring and using Index Advisor, please see the EDB Postgres Advanced Server Guide, available from EDB at:
https://www.enterprisedb.com/docs
Uninstalling SQL Profiler
The process of uninstalling SQL Profiler is platform-specific.
Uninstalling SQL Profiler from Windows Hosts
If you are using SQL Profiler on a Windows host, Windows will lock any files that have been executed or loaded into memory. To release any locked files, you must stop the Postgres server before performing an uninstall.
On Windows, you can use the Services dialog to control the service. To open the Services dialog, navigate through the Control Panel to the System and Security menu. Select Administrative Tools, and then double-click the Services icon. When the Services dialog opens, highlight the service name in the list, and use the option provided on the dialog to Stop the service.
After stopping the Postgres Server:
Delete the existing SQL Profiler query set on each node by invoking the uninstall-sql-profiler.sql script.
By default, the script resides in the share\contrib directory under your Advanced Server or PostgreSQL installation.
Uninstalling SQL Profiler from CentOS or RHEL Hosts
To uninstall a SQL Profiler installation that resides on a Linux host:
Delete the existing SQL Profiler query set on each node by invoking the uninstall-sql-profiler.sql script.
By default, if you are using Advanced Server on a Linux host, the script resides in the share/contrib directory under the Advanced Server installation.
If you are using a PostgreSQL installation on a Linux host, the script resides in the share/contrib directory under the PostgreSQL installation.