Audit Manager
You can use the PEM Audit Manager to simplify audit log configuration for Advanced Server instances. With the Audit Manager, you can configure logging attributes such as:
How often log files are to be collected by PEM
The type of database activities that are included in the log files
How often (and when) log files are to be rotated
Audit logs may include the following activities:
All connections made to the database instance
Failed connection attempts
Disconnections from the database instance
All queries (SELECT statements)
All DML statements (INSERT, UPDATE, DELETE)
All DDL statements (e.g., CREATE, DROP, ALTER)
Once the audit logs are stored on the PEM server, you can use the Audit Log dashboard to review the information in an easy-to-read form. The Audit Log dashboard allows you to filter the log file by timestamp range (when an activity occurred), the database on which the activity occurred, the user performing the activity, or the type of command being invoked.
Setting the Advanced Server Instance Service ID
To configure logging for an Advanced Server instance, the server must be a PEM-managed server with a bound agent, and the server registration must include the name of a service script. When registering a new server, include the service name in the Service ID field on the Advanced tab of the New Server dialog.
Before adding a service name to an existing (registered and connected)
server, you must disconnect the server. Right click on the server name,
and select Disconnect server from the context menu. Then, right click on
the server name and select Properties from the context menu. Select the
Advanced tab, and add a service name to the Service ID field.
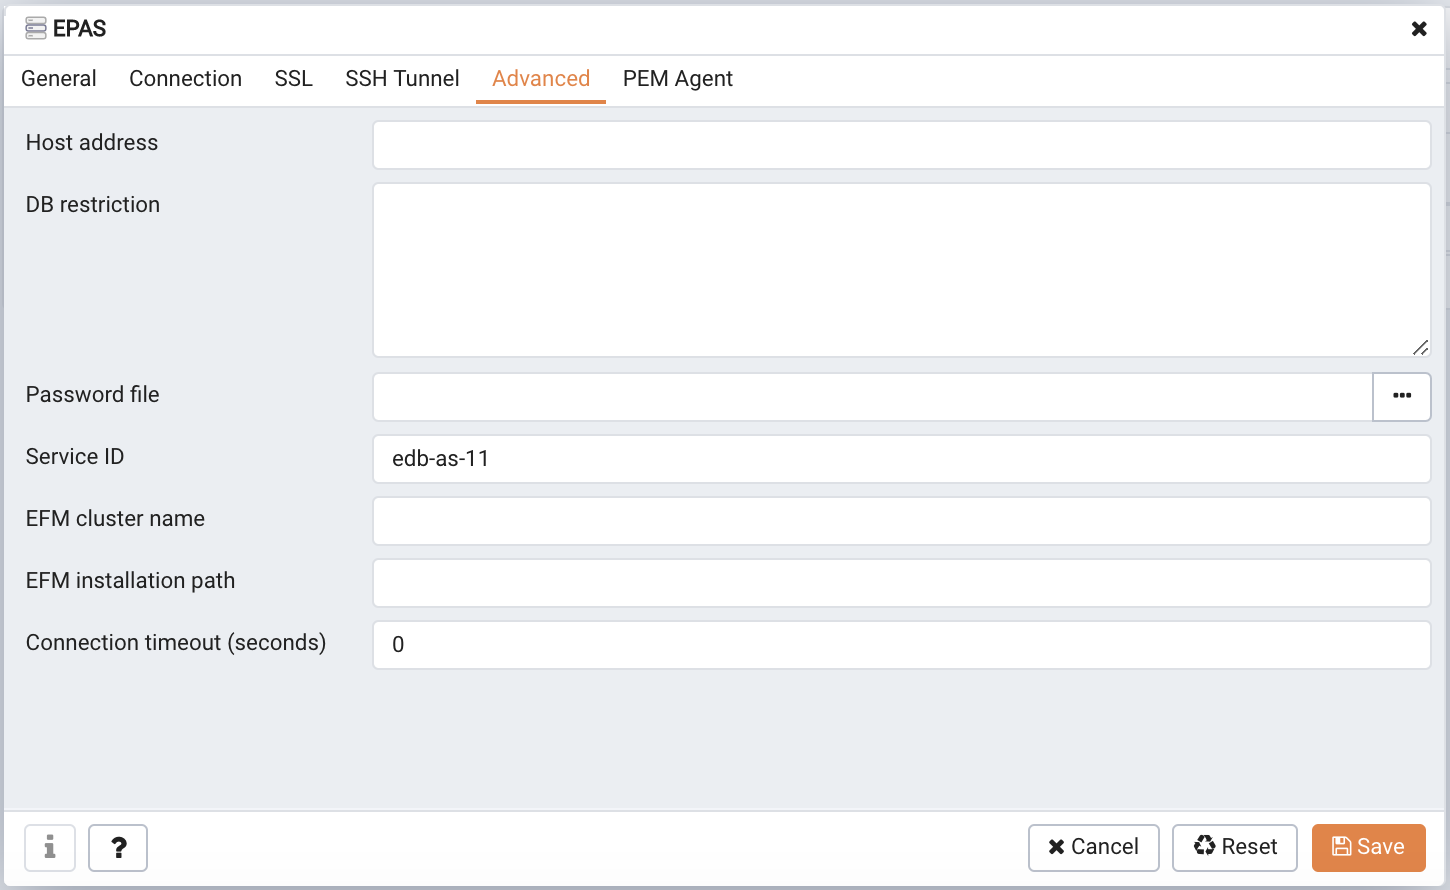
The Service ID of the Advanced Server instance
The Service ID field allows the PEM server to stop and start the service.
The name of the Advanced Server 11 service script is
edb-as-11.The name of the Advanced Server 10 service script is
edb-as-10.The name of the Advanced Server 9.6 service script is
edb-as-9.6.The name of the Advanced Server 9.5 (or prior) service script is ppas-9.x, where x specifies the version.
The name of the PostgreSQL 9.6 service script is
postgresql-11.The name of the PostgreSQL 9.6 service script is
postgresql-10.The name of the PostgreSQL 9.6 service script is
postgresql-9.6.
Setting the EDB Audit Configuration Probe
Before configuring audit logging of Advanced Server servers, you must
ensure that the EDB Audit Configuration probe is enabled. To open the
Manage Probes tab and check the status of the probe, right click on the
name of a registered Advanced Server server in the tree control, and
select Manage Probes... from the Management menu.
Ensure that the Enabled column in the Probe Configuration dialog is set
to Yes for the EDB Audit Configuration probe.
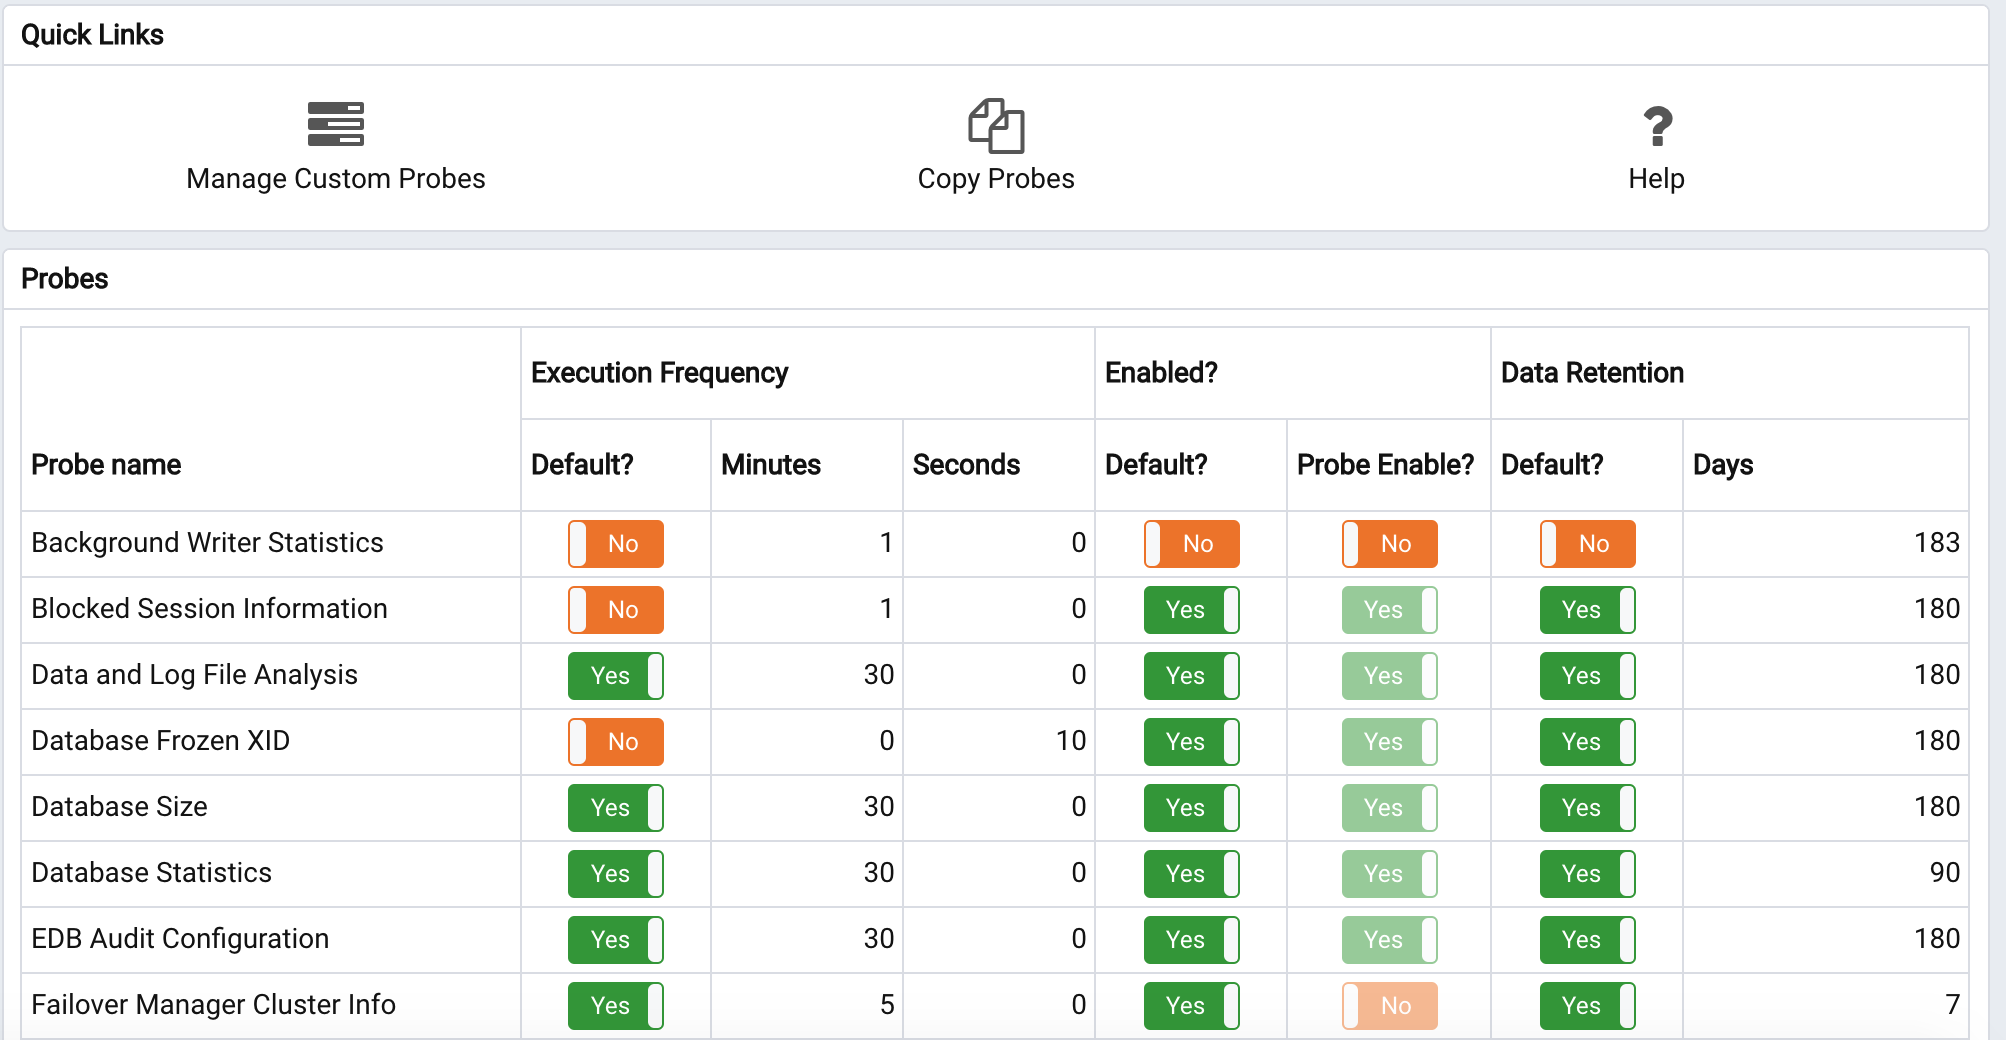
The EDB Audit Configuration probe
If EDB Audit Configuration is not enabled, use the Enabled? switch on
the Manage Probes tab to enable it.
Configuring Audit Logging with the Audit Manager
To open the Audit manager wizard, select Audit Manager... from the
Management menu. The Audit manager - Welcome dialog opens.
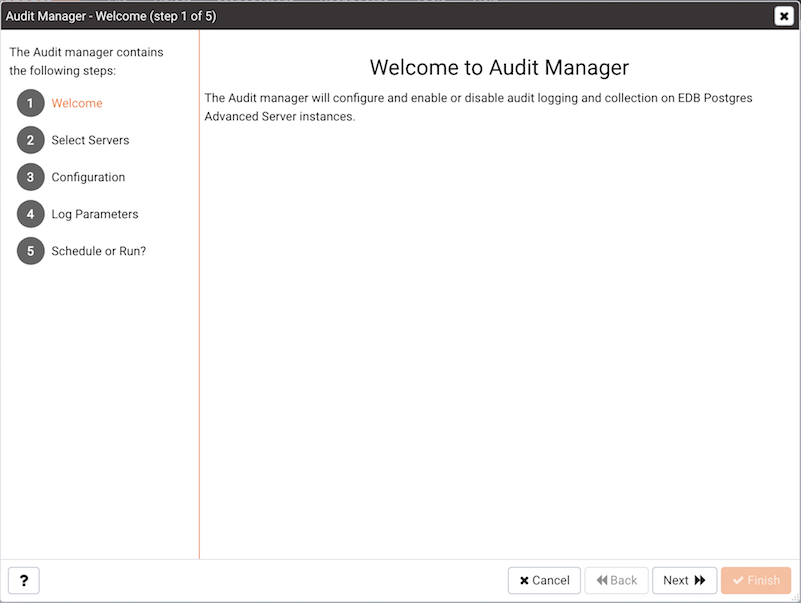
The Audit Manager Welcome dialog
Click Next to continue.
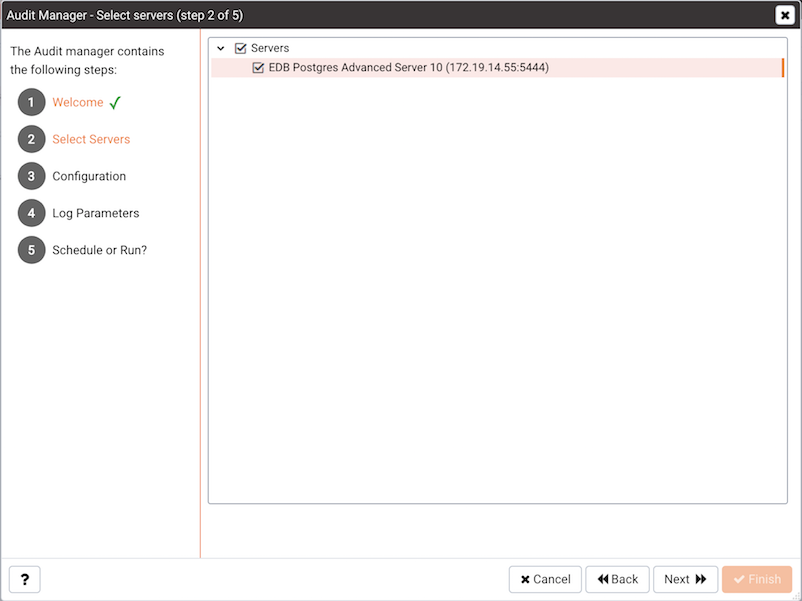
Select the servers you wish to configure for auditing
Use the Select servers tree control to specify the
servers to which the auditing configuration will be applied. To make a
server available in the tree control, you must provide the Service ID on
the Advanced tab of the Create – Server dialog when registering a server
for monitoring by PEM. Note that only EDB Postgres Advanced Server
supports auditing; PostgreSQL servers will not be included in the tree
control.
Click Next to continue.
The Auditing Parameters Configuration dialog lets you enable or disable
auditing and choose how often log records are collected into PEM.
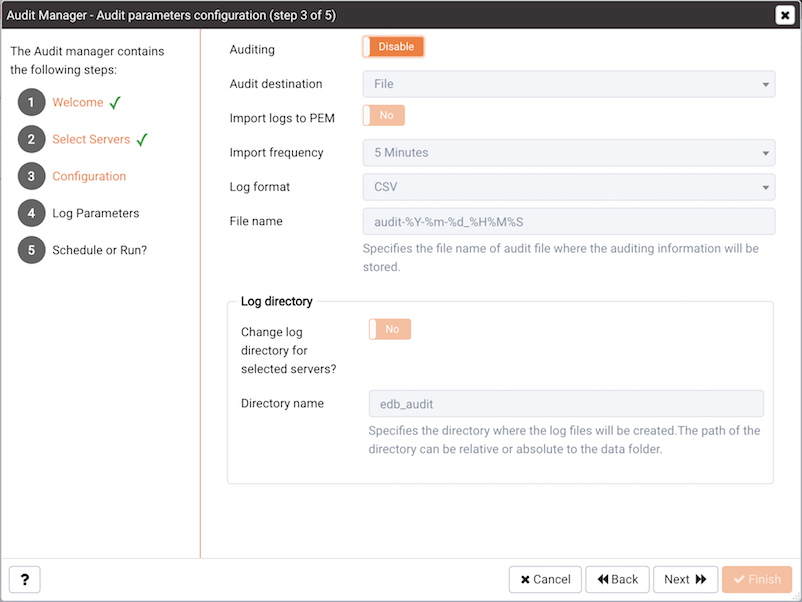
The Auditing Parameters Configuration dialog
Use the fields on the Auditing parameters configuration dialog to
specify auditing preferences:
Use the
Auditingswitch to Enable or Disable auditing on the specified servers.Use the
Audit destinationdrop-down to select a destination for the audit logs; select File or Syslog. Please note this feature is supported on Advanced Server 10 and newer releases only.Use the
Import logs to PEMswitch to instruct PEM to periodically import log records from each server to the PEM Server. Set the switch to Yes to import log files; the default is No.Use the
Collection frequencydrop-down listbox to specify how often PEM will collect log records from monitored servers when log collection is enabled.Use the
Log formatdrop-down listbox to select the raw log format that will be written on each server. If log collection is enabled, the PEM server will use CSV format.Use the
File namefield to specify the format used when generating log file names. By default, the format is set toaudit-%Y-%m-%d_%H%M%Swhere:auditis the file name specified in the Audit Directory Name fieldYis the year that the log was storedmis the month that the log was storeddis the day that the log was storedHis the hour that the log was storedMis the minute that the log was storedSis the second that the log was storedCheck the box next to
Change Log Directory for selected servers?and use theAudit Directory Namefield to specify a directory name to which the audit logs will be written. The directory will reside beneath the data directory on the PEM server.
Use fields in the Log directory box to specify information about the
directory in which the log files will be saved:
Move the
Change log directory for selected servers?switch to Yes to enable the Directory name field.Use the
Directory namefield to specify the name of the directory on each server into which audit logs will be written. The directory specified will be created as a sub-directory of the data directory on the server.
Click Next to continue.
The Audit log configuration dialog is only available if
you have enabled auditing on the Auditing parameters configuration
dialog.
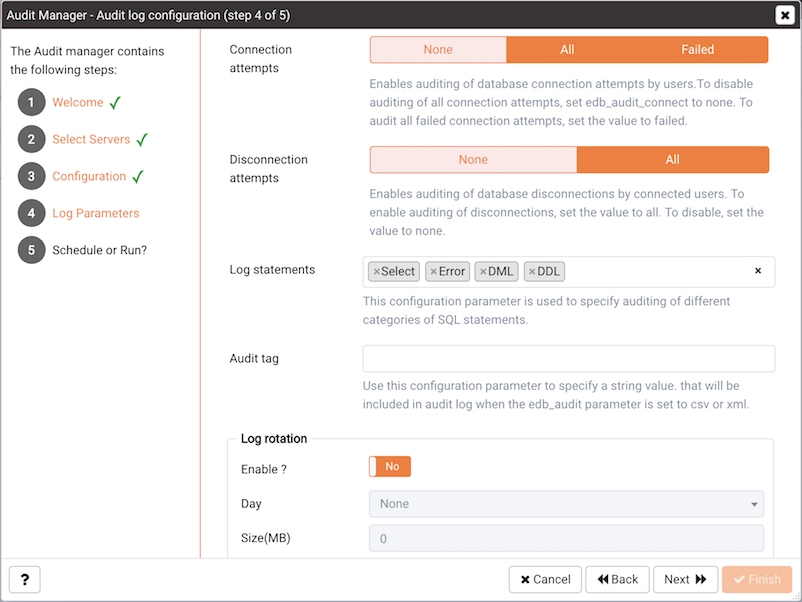
The Audit Log Configuration dialog
Use the controls on the Audit log configuration dialog to specify log
configuration details that will be applied to each server:
Use the
Connection attemptsswitch to specify if connection attempts should be logged:Noneto disable connection logging.Allto indicate that all connection attempts will be logged.Failedto log any connection attempts that fail.Use the
Disconnection attemptsswitch to specify if disconnections should be logged. Specify:Noneto specify that disconnections should not be logged.Allto enable disconnection logging.Use the
Log statementsfield to specify the statement types that will be logged. Click within the field, and select from:Select- All statements that include theSELECTkeyword will be logged.Error- All statements that result in an error will be logged.DML- All DML (Data Modification Language) statements will be logged.DDL- All DDL (Data Definition Language) statements (those that add, delete or alter data) will be logged.Check the box next to
Select Allto select all statement types.Check the box next to
Unselect Allto deselect all statement types.Use the
Audit tagfield to specify a tracking tag for the collected logs. Please note that audit tagging functionality is available only for Advanced Server versions 9.5 and later. If you are defining auditing functionality for multiple servers, and one or more of the servers are version 9.5 or later, this field will be enabled, but if selected, tagging functionality will only apply to those servers that are version 9.5 or later.
Use the fields in the Log rotation box to specify how the log files are
managed on each server:
Use the
Enable?switch to specify that logfiles should be rotated. Please note that a new log file should be used periodically to prevent a single file becoming unmanageably large.Use the
Day drop-downlistbox to select a day or days on which the log file will be rotated.Use the
Size (MB)field to specify a size in megabytes at which the log file will be rotated.Use the
Time (seconds)field to specify the number of seconds between log file rotations.
Click Next to continue:
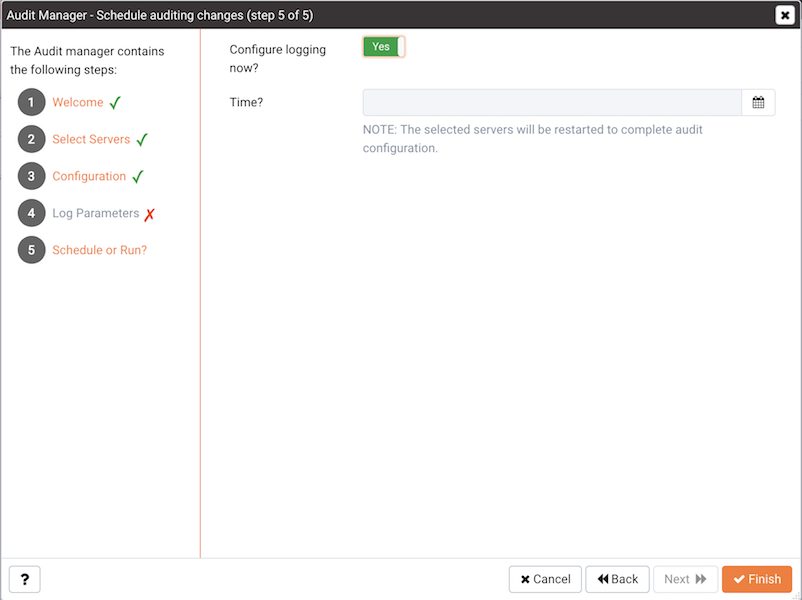
The Schedule Auditing Changes dialog
Use the Schedule Auditing Changes dialog to determine
when auditing configuration changes are to take effect.
Select
Configure logging now?if you want the auditing configuration changes to take place immediately. The affected database servers will be restarted so the auditing changes can take effect.Use the
Time?selector to schedule the auditing configuration changes to take place at some point in the future. Select the desired date and time from the drop-down lists. The affected database servers will be restarted at the specified date/time to put the auditing changes into effect.
Click Finish to complete the auditing configuration process.
The Audit Manager will schedule a job to apply the configuration to each server. The job will consist of two tasks: one to update the audit logging configuration on the server, and one to restart the server with the new configuration.
You can use the Scheduled Tasks tab to review a list of Scheduled jobs.
To open the Scheduled Tasks tab, highlight the name of a server or agent
and select Scheduled Tasks... from the Management menu.
Viewing the Log with the Audit Log Dashboard
Use the Audit Log dashboard to view the audit log from Advanced Server database instances.
To open the Audit Log dashboard, right click on a server or agent node,
and select Audit Log Analysis from the Dashboards menu. You can also
open the Audit Log dashboard by navigating through the Dashboards menu
(located on the Management menu).
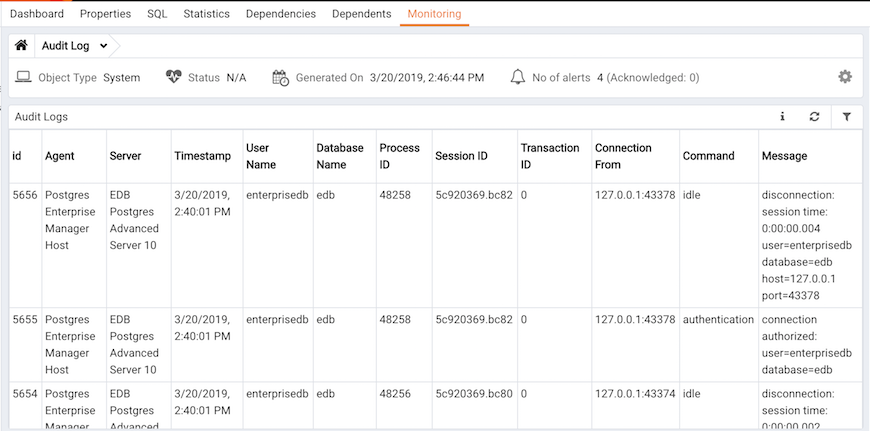
The Audit Log dashboard
The Audit Log dashboard displays the audit records in reverse chronological order (newest records at the top, oldest records towards the bottom).
To view older audit records that do not appear in the window, use the vertical scroll bar controlling the list of audit records (the innermost scroll bar of the two located on the right-hand side of the window). As you move the scroll bar towards the bottom of the window, older audit records are continuously loaded and displayed.
You can use filtering to limit the number of audit records that are
displayed. Click Show Filters to expose the filters panel.
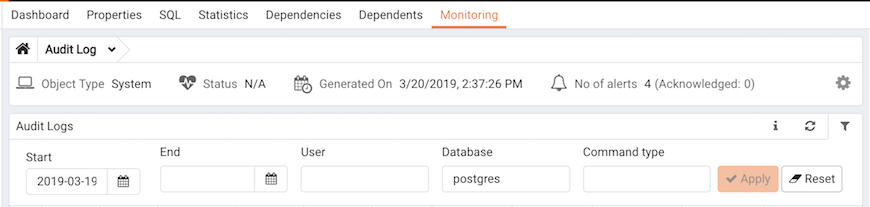
The Audit Log dashboard filters panel
Use the fields in the filters panel to provide certain selection
criteria for the audit records you wish to display.
Use the
Startfield to specify a start date for the report. Click the mouse button in the field to open a calendar and select a start date.Use the
Endfield to specify an end date for the report. Click the mouse button in the field to open a calendar and select an end date.Use the
Userfield to display only those entries where the activity was initiated by the given Postgres user.Use the
Databasefield to display only those entries where the activity was issued on the given database.Use the
Command typefield to display only those entries where the activity was of the given type. Command types you can specify are idle, authentication, and SELECT. (For viewing SQL statements from user applications, specify the idle command type.)
Click Filter to apply the filtering criteria to the log entries.