
Managing a PEM server#
Some of the tasks related to managing the PEM server include:
Restarting the PEM server and agent
Controlling the PEM server or PEM agent
Controlling the web server
Managing PEM authentication and security
Modifying the
pg_hba.conffileModifying PEM to use a proxy server
Starting and stopping the PEM server and agents#
The PEM server starts, stops, and restarts when the Postgres server instance where it resides starts, stops, or restarts. Use the same commands to control the PEM server that you use to control the Postgres server. On Linux platforms, the command that stops and starts the service script varies by platform and OS version.
The PEM agent is controlled by a service named pemagent.
The Windows operating system includes a graphical service controller that displays the server status and offers interactive server control. You can access the Services utility through the Windows Control Panel. When the utility opens, navigate through the listed services and select the service name.
Select Stop, Pause, Start, or Restart to control the state of the service.
Any user or client application connected to the Postgres server is abruptly disconnected if you stop the service. For more information about controlling a service, see EDB Postgres Advanced Server .
Controlling the PEM server or PEM agent on Linux#
On Linux platforms, the name of the service script that controls:
A PEM server on EDB Postgres Advanced Server is
edb-as-<x>or justedb-as.A PEM server on PostgreSQL is
postgresql-<x>.A PEM agent is
pemagent.
Where x indicates the server version number.
You can use the service script to control the service.
To control a service, at the command prompt, assume superuser privileges and issue the command:
systemctl <action> <service_name>
Where:
service_name is the name of the service.
action specifies the action taken by the service. Specify:
startto start the service.stopto stop the service.restartto stop and then start the service.statusto check the status of the service.
Controlling the PEM server or PEM agent on Windows#
The Windows operating system includes a graphical service controller that displays the server status and offers interactive server control. The registered name of the service that controls:
A PEM server host on PostgreSQL is
postgresql-<x>.A PEM server host on Advanced Server is
edb-as-<x>orppas-<x>.A PEM agent is
Postgres Enterprise Manager - pemAgent.
Where x indicates the server version number.
In the Windows Control Panel, open the Services utility to see the list of services.
Select Stop the service to stop a service. Any user or client application connected to the server is abruptly disconnected if you stop the service.
Select Pause the service to reload a service’s configuration parameters. Pause the service is an effective way to reset parameters without disrupting user sessions for many of the configuration parameters.
Select Start the service to start a service.
Controlling the web server on Linux#
On Linux, both NGINX and Apache HTTPD are supported. The default for new installs is NGINX.
You can check which web server your installation is using by running the
command below. If it returns USE_NGINX=1 then your installation is
using NGINX. If it returns USE_NGINX=0 , or returns nothing, then
your installation is using Apache HTTPD.
grep USE_NGINX /usr/edb/pem/share/.install-config
NGINX#
You can check the status of the NGINX service with the following command.
systemctl status nginx
If the service is not running you can start it.
systemctl start nginx
When NGINX is used as the web server, PEM uses a separate service
edb-uwsgi to run the application itself.
You can check the status of the edb-uwsgi service with the following
command.
systemctl status edb-uwsgi
If the service is not running you can start it.
systemctl start edb-uwsgi
Apache HTTPD#
You can check the status of the Apache service with the following
command, substituting <service-name> for the name of the service on
you operating system. This is generally httpd for RHEL-like systems
and apache2 for Debian-like systems.
systemctl status <service-name>
If the service is not running you can start it.
systemctl start <service-name>
Controlling the web server on Windows#
On Windows, the web server is a bundled version of Apache HTTPD called PEM-HTTPD.
You can use the Services applet to check the status of the PEM HTTPD service. After opening the Services applet, select the PEM HTTPD service from the list.
The Status column displays the current state of the server. Select Start to start PEM HTTPD if the service isn’t running.
Managing PEM authentication#
Postgres supports a number of authentication methods:
Secure password (md5)
GSSAPI
SSPI
Kerberos
Ident
LDAP
RADIUS
Certificate (SSL)
PAM
Postgres and PEM authentication is controlled by the pg_hba.conf
configuration file. Entries in the configuration file specify:
Who can connect to a specific database
The type of authentication required before that user is allowed to connect
A typical entry in the pg_hba.conf file that allows a user named
postgres to connect to all databases from the local host (127.0.0.1/32)
using secure password (md5) authentication connections takes the form:
host all postgres 127.0.0.1/32 md5
Depending on your system configuration, you might also need to create a
password file for the user account that the PEM agent uses to connect to
the server. This file allows the agent to properly respond to the
server’s authentication request. An entry in the password file for a
user named postgres, with a password of 1safepwd takes the form:
localhost:5432:*:postgres:1safepwd
The password file is usually named ~root/.pgpass on Linux systems or
%APPDATA%\postgresql\pgpass.conf on Windows. For more information
about configuring a password file, see the PostgreSQL website .
For more information about the authentication methods supported by Postgres, see the PostgreSQL core documentation .
Editing the PEM server configuration#
You can use the PEM client to manage the configuration parameters of the PEM server to enable features or modify default settings. To open the Server Configuration dialog box, select Management > Server Configuration. Then edit the parameter values as needed.
Managing security#
PEM provides an interface for managing your Postgres roles and servers.
Login roles#
When you connect to the PEM server, you must provide role credentials that allow access to the database on which the PEM server stores data. By default, the postgres superuser account is used to initially connect to the server, but we strongly recommend (for both security and auditing purposes) creating individual roles for each connecting user. You can use the PEM Query tool, the PEM web interface Create – Login/Group Role dialog box, or a command line client (such as psql) to create a role.
To use the Create – Login/Group Role dialog box to create a role:
In the PEM tree, expand the node for the server where you want to create the role.
Right-click the Login/Group Roles node.
From the context menu, select Create > Login/Group Role.
Use the tabs of the Create – Login/Group Role dialog box to define the role.
After you finish defining the new role, to create the role, select Save.
To modify the properties of an existing login role, right-click the name of a login role in the tree and select Properties from the context menu. To delete a login role, right-click the name of the role and select Delete/Drop from the context menu.
For more complete information about creating and managing a role, see the PostgreSQL online documentation .
Group roles#
Group roles can serve as containers and are used to dispense system privileges, such as creating databases, and object privileges, such as inserting data into a table. The primary purpose of a group role is to make the mass management of system and object permissions easier for a DBA. Rather than assigning or modifying privileges individually across many different login accounts, you can assign or change privileges for a single role and then grant that role to many login roles at once.
Use the Group Roles node (located beneath the name of each registered server in the PEM tree) to create and manage group roles. Options on the context menu provide access to a dialog box that allows you to create a new role or modify the properties of an existing role. You can find more information about creating roles in the PostgreSQL documentation .
Using PEM predefined roles to manage access to PEM functionality#
You can use the Login/Group Role dialog box to allow a role with limited privileges to access PEM features such as the Audit Manager, Capacity Manager, or SQL Profiler. PEM predefined roles allow access to PEM functionality. Roles that are assigned membership in these roles can access the associated feature.
When defining a user, use the Membership tab to specify the roles in which the new user is a member. The new user shares the privileges associated with each role in which it’s a member. For a user to have access to PEM extended functionality, the role must be a member of the pem_user role and the predefined role that grants access to the feature. Use the Roles field to select predefined role names from a list.
The SQL tab displays the SQL command that the server executes when you select Save.
This example creates a login role named acctg_clerk that has access to Audit Manager. The role can make unlimited connections to the server at any given time.
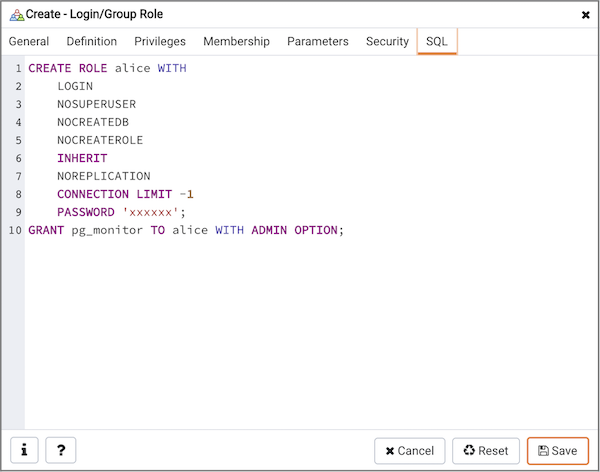
Create Login Role - SQL tab#
You can use PEM predefined roles to allow access to the capabilities listed in the table.
Value |
Parent role |
Description |
|---|---|---|
pem_super_admin |
Role to manage/configure everything on PEM |
|
pem_admin |
pem_super_admin |
Role for administration/management/configuration of all visible agents/servers and monitored objects |
pem_user |
Role for having read-only access to all the agents, servers, or monitored objects that are visible to a user having pem_user role. A user with pem_user role can view only those objects where this role has been mentioned in the Team field under the server's properties. |
|
pem_config |
pem_admin |
Role for configuration management of PEM |
pem_component |
pem_admin |
Role to run/execute all wizard/dialog box-based components |
pem_rest_api |
pem_admin |
Role to access the REST API |
pem_server_service_manager |
pem_admin |
Role for allowing to restart/reload the monitored database server (if server-id provided) |
pem_manage_schedule_task |
pem_admin |
Role to configure the schedule tasks |
pem_manage_chart |
pem_admin |
Role for managing/configuring custom charts. |
pem_manage_alert |
pem_admin |
Role for managing/configuring alerts and its templates |
pem_config_alert |
pem_config, pem_manage_alert |
Role for configuring the alerts on any monitored objects |
pem_manage_probe |
pem_admin |
Role to create, update, and delete the custom probes and change custom probe configuration |
pem_config_probe |
pem_config, pem_manage_probe |
Role for probe configuration (history retention, execution frequency, enable/disable the probe) on all visible monitored objects |
pem_database_server_registration |
pem_admin |
Role to register a database server |
pem_comp_auto_discovery |
pem_component |
Role to run the auto discovery of a database server dialog box |
pem_comp_sqlprofiler |
pem_component |
Role to run the SQL Profiler |
pem_manage_efm |
pem_admin |
Role to manage Failover Manager |
pem_comp_capacity_manager |
pem_component |
Role to run the Capacity Manager |
pem_comp_log_manager |
pem_component |
Role to run the Log Manager |
pem_comp_audit_manager |
pem_component |
Role to run the Audit Manager |
pem_comp_bart |
pem_component |
Role to configure and manage BART server. |
pem_comp_performance_diagnostic |
pem_component |
Role to run the Performance Diagnostics. |
Using a team role#
When you register a server for monitoring by PEM, you can specify a team to associate with the server. A team is a group role that you can use to allow or restrict access to one or more monitored servers to a limited group of role members. The PEM client displays a server with a specified team only to those users who are:
A member of the team role
The role that created the server
A role with superuser privileges on the PEM server
To create a team role:
In the PEM tree, expand the node for the server where you want to create the role.
Right-click the Login/Group Roles node.
From the context menu, select Create > Login/Group Role.
In the Create - Login/Group Role dialog box, use the fields to specify the properties of the team role.
Object permissions#
A role must be granted sufficient privileges before accessing,
executing, or creating any database object. PEM allows you to assign
(GRANT ) and remove (REVOKE ) object permissions to group roles
or login accounts using the PEM client interface.
Object permissions are managed with the graphical object editor for each particular object. For example, to assign privileges to access a database table, right-click the table name in the tree and select Properties from the context menu. Use the Privileges tab to assign privileges for the table.
The PEM client also contains a Grant wizard (accessed through the Tools menu) that allows you to manage many object permissions at once.
Server configuration#
You can use the Server Configuration dialog box to modify values of user-configurable parameters that control PEM behavior. To access the Server Configuration dialog box, connect to the PEM server, and select File > Server Configuration.
Enter a parameter name in the search box in the upper-right corner of the dialog to locate a specific parameter in the list.
To modify a parameter value, edit the content displayed in the Value field to the right of a parameter name. To save your changes, select the Save icon in the upper-right corner of the dialog box.
Server configuration parameters - reference#
You can use global configuration options to modify aspects of the PEM Server’s behavior. The list of configuration parameters is subject to change.
Parameter name |
Value and unit |
Description |
|---|---|---|
audit_log_retention_time |
30 days |
Specifies the number of days for an audit log to be retained on the PEM server. |
auto_create_agent_alerts |
true |
Specifies whether to create default agent level alerts automatically when an agent is registered. |
auto_create_server_alerts |
true |
Specifies whether to create default server level alerts automatically when a server is bound to an agent. |
chart_disable_bullets |
false |
Enables/disables bullets on line charts on dashboards and Capacity Manager reports. |
cm_data_points_per_report |
50 |
Specifies the number of data points to plot on charts on Capacity Manager reports. |
cm_max_end_date_in_years |
5 years |
Specifies the maximum amount of time for the Capacity Manager to extrapolate data for. Ensures that threshold-based end dates of reports aren't extrapolated indefinitely. |
dash_alerts_timeout |
60 seconds |
Specifies the number of seconds after which the components of the Alerts dashboard are refreshed. |
dash_db_comrol_span |
7 days |
Specifies the number of days worth of data to plot on the Commit/Rollback Analysis chart on the Database Analysis and Server Analysis dashboards. |
dash_db_comrol_timeout |
1800 seconds |
Specifies the number of seconds after which the Commits/Rollbacks line chart is refreshed on the Database Analysis and Server Analysis dashboards. |
dash_db_connovervw_timeout |
300 seconds |
Specifies the number of seconds after which the Connection Overview pie chart is refreshed on the Database Analysis dashboard. |
dash_db_eventlag_span |
7 days |
Specifies the number of days worth of data to plot on the Number of Events Lag chart for slony replication on the Database Analysis dashboard. |
dash_db_eventlag_timeout |
1800 seconds |
Specifies the number of seconds after which the Number of Events Lag line chart for slony replication is refreshed on the Database Analysis dashboard. |
dash_db_hottable_rows |
25 rows |
Specifies the number of rows to show on the HOT Table Analysis table on the Database Analysis dashboard. |
dash_db_hottable_timeout |
300 seconds |
Specifies the number of seconds after which the Hot Tables table is refreshed on the Database Analysis dashboard. |
dash_db_io_span |
7 days |
Specifies the number of days worth of data to plot on the Database I/O Analysis chart on the Database Analysis and I/O Analysis dashboards. |
dash_db_io_timeout |
1800 seconds |
Specifies the number of seconds after which the Database I/O line chart is refreshed on the Database Analysis and I/O Analysis dashboards. |
dash_db_rowact_span |
7 days |
Specifies the number of days worth of data to plot on the Row Activity Analysis chart on the Database Analysis, I/O Analysis, and Server Analysis dashboards. |
dash_db_rowact_timeout |
1800 seconds |
Specifies the number of seconds after which the Row Activity line chart is refreshed on the Database Analysis, I/O Analysis, and Server Analysis dashboards. |
dash_db_storage_timeout |
300 seconds |
Specifies the number of seconds after which the Storage bar chart is refreshed on the Database Analysis dashboard. |
dash_db_timelag_span |
7 days |
Specifies the number of days worth of data to plot on the Time Lag chart for Slony replication on the Database Analysis dashboard. |
dash_db_timelag_timeout |
1800 seconds |
Specifies the number of seconds after which the Time Lag line chart for Slony replication is refreshed on the Database Analysis dashboard. |
dash_db_useract_span |
7 days |
Specifies the number of days worth of data to plot on the User Activity Analysis chart on the Database Analysis dashboard. |
dash_db_useract_timeout |
1800 seconds |
Specifies the number of seconds after which the User Activity line chart is refreshed on the Database Analysis dashboard. |
dash_efm_timeout |
300 seconds |
Specifies the number of seconds after which the Failover Manager Node Status and Failover Manager Cluster Info line chart is refreshed on the Streaming Replication dashboard. |
dash_global_overview_timeout |
30 seconds |
Specifies the number of seconds after which the components of the Global Overview dashboard are refreshed. |
dash_header_timeout |
60 seconds |
Specifies the number of seconds after which the information on the header of all the dashboards are refreshed. |
dash_io_chkpt_span |
7 days |
Specifies the number of days worth of data to plot on the Checkpoints chart on the I/O Analysis dashboard. |
dash_io_chkpt_timeout |
1800 seconds |
Specifies the number of seconds after which the Checkpoints line chart is refreshed on the I/O Analysis dashboard. |
dash_io_hotindx_timeout |
300 seconds |
Specifies the number of seconds after which the Hot Indexes bar chart is refreshed on the I/O Analysis dashboard. |
dash_io_hottbl_timeout |
300 seconds |
Specifies the number of seconds after which the Hot Tables bar chart is refreshed on the I/O Analysis dashboard. |
dash_io_index_objectio_rows |
25 rows |
Specifies the number of rows displayed on the Index Activity table on the I/O Analysis and Object Activity Analysis dashboards. |
dash_io_index_objectio_timeout |
60 seconds |
Specifies the number of seconds after which the Index Activity table is refreshed on the I/O Analysis and Object Activity Analysis dashboards. |
dash_io_objectio_rows |
25 rows |
Specifies the number of rows displayed on the Object I/O Details table on the I/O Analysis and Object Activity Analysis dashboards. |
dash_io_objectio_timeout |
300 seconds |
Specifies the number of seconds after which the Object I/O Details table is refreshed on the I/O Analysis and Object Activity Analysis Dashboards. |
dash_memory_hostmemact_span |
7 days |
Specifies the number of days worth of data to plot on the Host Memory Activity Analysis chart on the Memory Analysis dashboard. |
dash_memory_hostmemact_timeout |
1800 seconds |
Specifies the number of seconds after which the Host Memory Activity line chart is refreshed on the Memory Analysis dashboard. |
dash_memory_hostmemconf_timeout |
300 seconds |
Specifies the number of seconds after which the Host Memory Configuration pie chart is refreshed on the Memory Analysis and Server Analysis dashboards. |
dash_memory_servmemact_span |
7 days |
Specifies the number of days worth of data to plot on the server Memory Activity Analysis chart on the Memory Analysis dashboard. |
dash_memory_servmemact_timeout |
1800 seconds |
Specifies the number of seconds after which the Server Memory Activity line chart is refreshed on the Memory Analysis dashboard. |
dash_memory_servmemconf_timeout |
300 seconds |
Specifies the number of seconds after which the Server Memory Configuration pie chart is refreshed on the Memory Analysis dashboard. |
dash_objectact_objstorage_rows |
15 rows |
Specifies the number of rows to show on the Object Storage table on the Object Activity Analysis dashboard. |
dash_objectact_objstorage_timeout |
300 seconds |
Specifies the number of seconds after which the Object Storage table is refreshed on the Object Activity Analysis dashboard. |
dash_objectact_objtopindexes_timeout |
300 seconds |
Specifies the number of seconds after which the Top 5 Largest Indexes bar chart is refreshed on the Object Activity Analysis dashboard. |
dash_objectact_objtoptables_timeout |
300 seconds |
Specifies the number of seconds after which the Top 5 Largest Tables bar chart is refreshed on the Object Activity Analysis dashboard. |
dash_os_cpu_span |
7 days |
Specifies the number of days worth of data to plot on the CPU chart on the Operating System Analysis dashboard. |
dash_os_cpu_timeout |
1800 seconds |
Specifies the number of seconds after which the CPU line chart is refreshed on the Operating System Analysis dashboard. |
dash_os_data_span |
7 days |
Specifies the number of days worth of data to plot on the I/O line chart on the Operating System Analysis dashboard. |
dash_os_disk_span |
7 days |
Specifies the number of days worth of data to plot on the Utilisation chart on the Operating System Analysis dashboard. |
dash_os_hostfs_timeout |
1800 seconds |
Specifies the number of seconds after which the Host File System Details table is refreshed on the Operating System Analysis dashboard. |
dash_os_io_timeout |
1800 seconds |
Specifies the number of seconds after which the I/O line chart is refreshed on the Operating System Analysis dashboard. |
dash_os_memory_span |
7 days |
Specifies the number of days worth of data to plot on the Memory chart on the Operating System Analysis dashboard. |
dash_os_memory_timeout |
1800 seconds |
Specifies the number of seconds after which the Memory line chart is refreshed on the Operating System Analysis dashboard. |
dash_os_packet_span |
7 days |
Specifies the number of days worth of data to plot on the Packet chart on the Operating System Analysis dashboard. |
dash_os_packet_timeout |
1800 seconds |
Specifies the number of seconds after which the Network Packets line chart is refreshed on the Operating System Analysis dashboard. |
dash_os_process_span |
7 days |
Specifies the number of days worth of data to plot on the Process chart on the Operating System Analysis dashboard. |
dash_os_process_timeout |
1800 seconds |
Specifies the number of seconds after which the Process line chart is refreshed on the Operating System Analysis dashboard. |
dash_os_storage_timeout |
1800 seconds |
Specifies the number of seconds after which the Storage pie chart is refreshed on the Operating System Analysis dashboard. |
dash_os_traffic_span |
7 days |
Specifies the number of days worth of data to plot on the Traffic chart on the Operating System Analysis dashboard. |
dash_os_traffic_timeout |
1800 seconds |
Specifies the number of seconds after which the Traffic line chart is refreshed on the Operating System Analysis dashboard. |
dash_os_util_timeout |
1800 seconds |
Specifies the number of seconds after which the Utilization line chart is refreshed on the Operating System Analysis dashboard. |
dash_patroni_timeout |
300 seconds |
Specifies the refresh interval, in seconds, for the Patroni Node Status and Patroni Cluster Status line charts on the Streaming Replication dashboard. |
dash_probe_log_timeout |
300 seconds |
Specifies the number of seconds after which the Probe Log table refreshed. |
dash_replication_archivestat_span |
7 days |
Specifies the number of days worth of data to plot on the WAL Archive Status chart on the Streaming Replication Analysis dashboard. |
dash_replication_archivestat_timeout |
1800 seconds |
Specifies the number of seconds after which the WAL Archive Status line chart is refreshed on the Streaming Replication dashboard. |
dash_replication_pagelag_span |
7 days |
Specifies the number of days worth of data to plot on the WAL Lag Pages chart on the Streaming Replication dashboard. |
dash_replication_pagelag_timeout |
1800 seconds |
Specifies the number of seconds after which the WAL Lag Pages line chart is refreshed on the Streaming Replication dashboard. |
dash_replication_segmentlag_span |
7 days |
Specifies the number of days worth of data to plot on the WAL Lag Segments chart on the Streaming Replication dashboard. |
dash_replication_segmentlag_timeout |
1800 seconds |
Specifies the number of seconds after which the WAL Lag Segments line chart is refreshed on the Streaming Replication dashboard. |
dash_replication_timelag_span |
7 days |
Specifies the number of days worth of data to plot on the Replication Lag Time chart on the Streaming Replication dashboard. |
dash_replication_timelag_timeout |
1800 seconds |
Specifies the number of seconds after which the Replication Lag Time line chart is refreshed on the Streaming Replication dashboard. |
dash_server_buffers_written |
168 hours |
Specifies the number of days worth of data to plot on the Background Writer Statistics chart on the Server Analysis dashboard. |
dash_server_buffers_written_timeout |
300 seconds |
Specifies the number of seconds after which the Background Writer Statistics line chart is refreshed on the Server Analysis dashboard. |
dash_server_connovervw_timeout |
300 seconds |
Specifies the number of seconds after which the Connection Overview pie chart is refreshed on the Server Analysis dashboard. |
dash_server_database_timeout |
300 seconds |
Specifies the number of seconds after which the Databases table is refreshed on the Server Analysis dashboard. |
dash_server_dbsize_span |
7 days |
Specifies the number of days worth of data to plot on the Database Size Analysis on the Server Analysis dashboard. |
dash_server_dbsize_timeout |
1800 seconds |
Specifies the number of seconds after which the Database Size line chart is refreshed on the Server Analysis dashboard. |
dash_server_disk_timeout |
1800 seconds |
Specifies the number of seconds after which the Disk line chart is refreshed on the Server Analysis dashboard. |
dash_server_global_span |
7 days |
Specifies the number of days worth of data to plot on the Disk line chart on the Server Analysis dashboard. |
dash_server_sharedbuff_span |
7 days |
Specifies the number of days worth of data to plot on the Shared Buffer chart on the Server Analysis dashboard. |
dash_server_sharedbuff_timeout |
1800 seconds |
Specifies the number of seconds after which the Shared Buffers line chart is refreshed on the Server Analysis dashboard. |
dash_server_tabspacesize_span |
7 days |
Specifies the number of days worth of data to plot on the Tablespace Size chart on the Server Analysis dashboard. |
dash_server_tabspacesize_timeout |
1800 seconds |
Specifies the number of seconds after which the Tablespace Size line chart is refreshed on the Server Analysis dashboard. |
dash_server_useract_span |
7 days |
Specifies the number of days worth of data to plot on the User Activity chart on the Server Analysis dashboard. |
dash_server_useract_timeout |
1800 seconds |
Specifies the number of seconds after which the User Activity line chart is refreshed on the Server Analysis dashboard. |
dash_sess_waits_timewait_timeout |
300 seconds |
Specifies the number of seconds after which the Session Waits By Time Waited pie chart is refreshed on the Session Waits Analysis dashboard. |
dash_sess_waits_waitdtl_timeout |
300 seconds |
Specifies the number of seconds after which the Session Waits Details table is refreshed on the Session Waits Analysis dashboard. |
dash_sessact_lockact_timeout |
300 seconds |
Specifies the number of seconds after which the Session Lock Activity table is refreshed on the Session Activity Analysis dashboard. |
dash_sessact_workload_timeout |
300 seconds |
Specifies the number of seconds after which the Session Workload table is refreshed on the Session Activity Analysis dashboard. |
dash_storage_dbdtls_timeout |
300 seconds |
Specifies the number of seconds after which the Database Details table is refreshed on the Storage Analysis dashboard. |
dash_storage_dbovervw_timeout |
300 seconds |
Specifies the number of seconds after which the Database Overview pie chart is refreshed on the Storage Analysis dashboard. |
dash_storage_hostdtls_timeout |
300 seconds |
Specifies the number of seconds after which the Host Details table is refreshed. |
dash_storage_hostovervw_timeout |
300 seconds |
Specifies the number of seconds after which the Host Overview pie chart is refreshed on the Storage Analysis dashboard. |
dash_storage_tblspcdtls_timeout |
300 seconds |
Specifies the number of seconds after which the Tablespace Details table is refreshed on the Storage Analysis dashboard. |
dash_storage_tblspcovervw_timeout |
300 seconds |
Specifies the number of seconds after which the Tablespace Overview pie chart is refreshed on the Storage Analysis dashboard. |
dash_sys_waits_nowaits_timeout |
300 seconds |
Specifies the number of seconds after which the System Waits By Number Of Waits pie chart is refreshed on the System Waits Analysis dashboard. |
dash_sys_waits_timewait_timeout |
300 seconds |
Specifies the number of seconds after which the System Waits By Time Waited pie chart is refreshed on the System Waits Analysis dashboard. |
dash_sys_waits_waitdtl_timeout |
300 seconds |
Specifies the number of seconds after which the System Waits Details table is refreshed on the System Waits Analysis dashboard. |
deleted_charts_retention_time |
7 days |
Specifies the number of days that a custom chart (displayed on a user-defined dashboard) is stored. |
deleted_objects_data_retention_time |
3 days |
Specifies the number of days after which the probe data of any deleted object, for example, server or agents or Barman server, is deleted from the pemhistory and pemdata schema. It deletes the job in case you don't want to delete the data of those obsolete objects. |
deleted_probes_retention_time |
7 days |
Specifies the number of days that a custom probe (displayed on a user-defined dashboard) is stored. |
download_chart_format |
jpeg |
Specifies the format in which a downloaded chart is stored. Can be jpeg or png. |
flapping_detection_state_change |
3 |
Specifies the number of state changes detected within a specified interval to define a given alert as flapping. Flapping starts when more than N state changes have occurred over [ N + 1 *(min(probe_interval) * 2)] minutes and the fine state is not None. The default value of N is 2 or 3, and min(probe_interval) is the smallest interval for all the probes used by the alert. Flapping ends when ZERO state changes have occurred over [2 N * min(probe_interval)] minutes. |
job_notification_error_limit |
1000 |
Specifies the character limit for the error output included in job failure notifications. |
job_notification_webhook_endpoint |
Specifies the name of the webhook endpoint to be used for job failure notifications. When a job fails, a notification is sent to the configured webhook. |
|
job_retention_time |
30 days |
Specifies the number of days that nonrecurring scheduled tasks and their associated jobs are retained. |
long_running_transaction_minutes |
5 minutes |
Specifies the number of minutes a query executes before being considered long running. |
nagios_cmd_file_name |
file_name |
Specifies nagios command file to which passive service check results are sent. |
nagios_enabled |
t |
Specifies whether alert notification are submitted to nagios. |
nagios_medium_alert_as_critical |
f |
Specifies whether a medium level PEM alert is considered critical in nagios. |
nagios_spool_retention_time |
7 days |
Specifies the number of days to retain nagios messages in the spool table before they are discarded. |
probe_log_retention_time |
30 days |
Specifies the number of days that probe log records are retained. |
reminder_notification_interval |
24 hours |
Specifies the number of hours after which a reminder email is sent in case an alert wasn't cleared. |
server_log_retention_time |
30 days |
Specifies the number of days that the server log is retained on the PEM server. |
show_data_tab_on_graph |
false |
If true, a Data tab is added to each graph. Select the Data tab to review the data that's plotted on the graph. |
smtp_authentication |
false |
Specifies whether to enable/disable authentication over SMTP. |
smtp_enabled |
true |
Specifies whether to enable/disable sending of emails. |
smtp_encryption |
false |
Specifies whether to send SMTP email using an encrypted connection. |
smtp_password |
Specifies the password to use to connect to the SMTP server. |
|
smtp_port |
25 |
Specifies the SMTP server port to use for sending email. |
smtp_server |
127.0.0.1 |
Specifies the SMTP server host address to use for sending email. |
smtp_spool_retention_time |
7 days |
Specifies the number of days to retain sent email messages in the spool table before they are discarded. |
smtp_username |
Specifies the username to used to connect to an SMTP server. |
|
snmp_authentication_password |
Specifies the authentication password associated with security name mentioned in snmp_security_name. Used only for SNMPv3. |
|
snmp_authentication_protocol |
NONE |
Specifies the authentication type for SNMP traps. Its possible values are NONE, HMACMD5, and HMACSHA. Used only with SNMPv3. |
snmp_community |
public |
Specifies the SNMP community used when sending traps. Used only with SNMPv1 and SNMPv2. |
snmp_context_engine_id |
Specifies the context engine id, the identifier for MIB objects when sending SNMP traps. If not specified, snmp_security_engine_id is used. Used only with SNMPv3. |
|
snmp_context_name |
Specifies the context name, the identifier for MIB objects when sending SNMP traps. Used only with SNMPv3. |
|
snmp_enabled |
true |
Specifies whether to enable/disable sending SNMP traps. |
snmp_port |
162 |
Specifies the SNMP server port to use for sending SNMP traps. |
snmp_privacy_password |
Specifies the privacy password associated with security name mentioned in snmp_security_name. Used only for SNMPv3. |
|
snmp_privacy_protocol |
NONE |
Specifies the privacy protocol for SNMP traps. Its possible values are NONE, DES, AES128, IDEA, AES192, or AES256. Used only with SNMPv3. |
snmp_security_engine_id |
Specifies the engine id of the SNMP agent on the SNMP server. Used only with SNMPv3. |
|
snmp_security_level |
NOAUTH_NOPRIV |
Specifies security level. Its possible values are: - AUTH_NOPRIV - Authentication, No Privacy. Then NONE option is possible for privacy protocol only. AUTH_PRIV - Authentication, Privacy. Then NONE option selection shouldn't be allowed for authentication and privacy protocol. NOAUTH_NOPRIV - no Authentication, no Privacy. Then only NONE option is possible for authentication and privacy protocol. Used only with SNMPv3. |
snmp_security_name |
Specifies the user name or security name for sending SNMP traps. Used only with SNMPv3. |
|
snmp_server |
127.0.0.1 |
Specifies the SNMP server host address to use for sending SNMP traps. |
snmp_spool_retention_time |
7 days |
Specifies the number of days to retain sent traps in the spool table before they're discarded. |
timezone_for_system_jobs |
current server timezone |
Specifies the time zone to be used when scheduling the next run time for system jobs. |
webclient_help_pg |
EDB hosted documentation |
Specifies the location of the online PostgreSQL core documentation. |