
Alerts#
PEM continually monitors registered servers. It compares performance metrics against predefined and user-specified thresholds that specify good or acceptable performance for each statistic. Any deviation from an acceptable threshold value triggers an alert. An alert is a system-defined or user-defined set of conditions that PEM compares to the system statistics. Alerts tell you about conditions on registered servers that require your attention.
Viewing the alerts via Global dashboard#
When your system statistics deviate from the boundaries specified for that statistic, the alert triggers. The alert displays a high (red), low (yellow), or medium (orange) severity warning in the left-most column of the Alert Status table on the Global Overview dashboard.
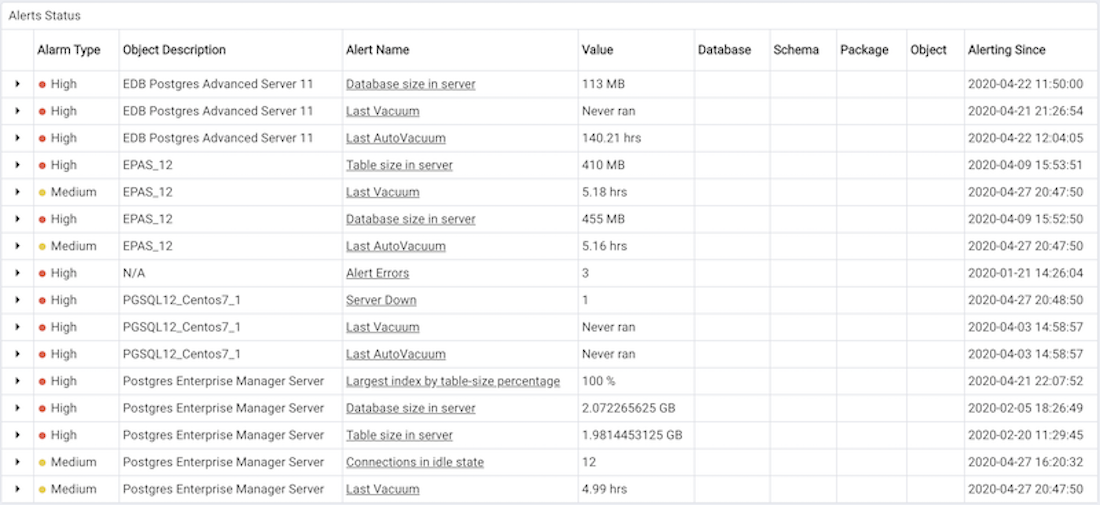
The Alert Status table#
The PEM server includes a number of predefined alerts that are actively monitoring your servers. The alert definition might make details available about the cause of the alert. Select the down arrow to the right of the severity warning to open a dialog box that has details about the condition that triggered the alert.
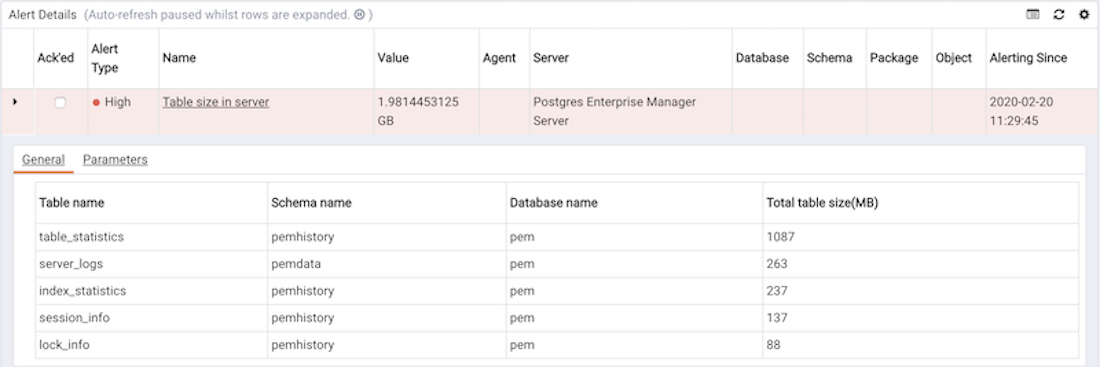
Alert details#
PEM also provides an interface that lets you create customized alerts. Each alert uses metrics defined on an alert template. An alert template defines how the server evaluates the statistics for a resource or metric. The PEM server includes predefined alert templates, and you can create custom alert templates.
Viewing the alerts via Alerts dashboard#
Use the Dashboards menu (on the Monitoring tab) to open the Alerts dashboard. The Alerts dashboard shows a summary of the active alerts and the status of each alert.
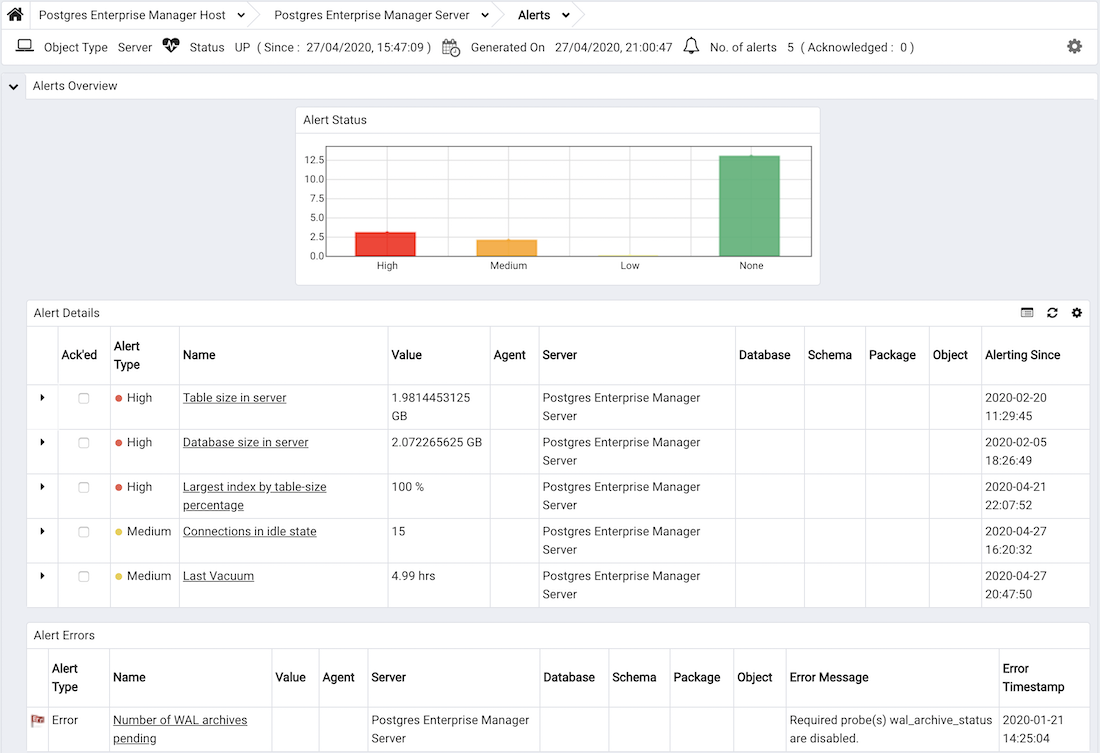
The Alerts Dashboard#
The Alerts dashboard header shows the date and time that the dashboard was last updated and the number of current alerts.
The Alerts Overview section shows a visual representation of the active alerts and a count of the current high, low, and medium alerts. The vertical bar on the left of the graph provides the count of the alerts displayed in each column. Hover over a bar to display the alert count for the selected alert severity in the upper-right corner of the graph.
The Alert Details table provides a list of the alerts that are currently triggered. The entries appear in order from high severity to low severity. Each entry includes information that lets you identify the alert and recognize the condition that triggered the alert. Select an alert to review detailed information about the alert definition.
The Alert Errors table shows configuration-related errors, such as accidentally disabling a required probe or improperly configuring an alert parameter. You can use the information provided in the Error Message column to identify and resolve the conflict that’s causing the error.
Customizing the Alerts dashboard#
You can customize tables and charts that appear on the Alerts dashboard. To customize a table or chart, select Settings in the upper-right corner.
Use fields on the Personalize Chart Configuration dialog box to provide your display preferences:
Use the Auto Refresh field to specify the number of seconds between updates of the data displayed in the table or chart.
Use the Download as field to indicate whether to download a chart as a JPEG image or as a PNG image.
Use Colours selectors to specify the colors to use on a chart.
Set the Show Acknowledged Alerts switch to Yes if you want the table to display alerts that you acknowledged with a check box in the Ack’ed column. Set it to No to hide any acknowledged alerts. Acknowledged alerts are purged from the table content only when the time specified in the alert definition passes.
To save your customizations, select Save (a checkmark) in the upper-right corner. To delete any previous changes and revert to the default values, select Delete. Use the Save and Delete menus to specify whether to apply your preferences to all dashboards or to a selected server or database.
Managing alerts#
Use the PEM client’s Manage Alerts tab to define, copy, or manage alerts. To open the Manage Alerts tab, select Management > Manage Alerts.
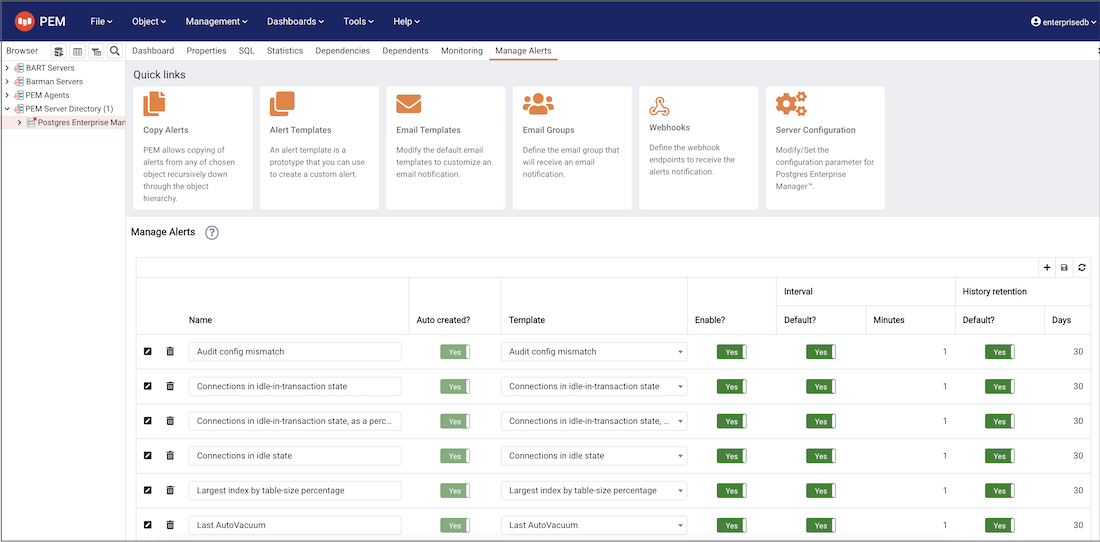
The Manage Alerts tab#
Use the Quick Links toolbar to open dialog boxes and tabs for managing alerts:
Select Copy Alerts to open the Copy Alert Configuration dialog box and copy an alert definition.
Select Alert Templates to open the Alert Template tab and modify or create an alert template.
Select Email Templates to open the Email Template dialog box and modify the default email template to customize an email notification.
Select Email Groups to open the Email Groups tab and modify or create an email group.
Select Webhooks to open the Webhooks tab and create or manage the webhooks endpoints.
Select Server Configurations to open the Server Configuration dialog box and review or modify server configuration settings.
Use the table in the Alerts section of the Manage Alerts tab to create new alerts or manage existing alerts.
Alert templates#
An alert template is a prototype that defines the properties of an alert. An alert instructs the server to compare the current state of the monitored object to a threshold specified in the alert template to determine if a situation requires administrative attention.
You can use the Alert Templates tab to define a custom alert template or view the definitions of existing alert templates. To open the Alert Templates tab, select Management > Manage Alerts. From the Manage Alerts tab, on the Quick Links toolbar, select Alert Templates.
Use the Show System Template list to filter the alert templates that are displayed in the Alert Templates table. From the list, select a level of the PEM hierarchy to view all of the templates for that level.
Defining a new alert template#
To define a new alert template, from the Show System Template list, select None. Then click the plus sign (+) in the upper-right corner of the alert template table. The alert template editor opens.
Use fields on the General tab to specify general information about the template:
Use the Template name field to specify a name for the new alert template.
Use the Description field to provide a description of the alert template.
Use the Target type list to select the type of object that is the focus of the alert.
Use the Applies to server list to specify the server type (EDB Postgres Advanced Server or PostgreSQL) to which to apply the alert. You can specify a single server type or ALL.
Use the History retention field to specify the number of days to store the result of the alert execution on the PEM server.
Use the Threshold unit field to specify the unit type of the threshold value.
Use fields in the Auto create box to specify for PEM to use the template to generate an automatic alert. If you enable this option, PEM creates an alert when a new server or agent, as specified by the Target type list, is added and deletes that alert when the target object is dropped.
Move the Auto create? slider to Yes to specify for PEM to create alerts based on the template. If you modify an existing alert template by changing the Auto create? slider to Yes, PEM creates alerts on the existing agents and servers. If you change the slider from Yes to No, the default threshold values in existing alerts are erased, and you can’t recover them.
Use the Operator list to select the operator for PEM to use when evaluating the current system values.
Select a greater-than sign (>) to trigger the alert when the system values are greater than the values entered in the Threshold values fields.
Select a less-than sign (<) to indicate to trigger the alert when the system values are less than the values entered in the Threshold values fields.
Use the threshold fields to specify the values for PEM to compare to the system values to determine whether to raise an alert. You must specify values for all three thresholds (Low, Medium, and High).
Use the Check frequency field to specify the default number of minutes between alert executions. This value specifies how often the server invokes the SQL code specified in the definition and compares the result to the threshold value specified in the template.
Use the fields on the Probe Dependency tab to specify the names of probes referred to in the SQL query specified on the SQL tab:
Use the Probes list to select from a list of the available probes.
To add the probe to the list of probes used by the alert template, select a probe name and select Add.
To remove a probe from the selected probes list, select the probe name and select Delete.
Use the Parameters tab to define the parameters to use in the SQL code specified on the SQL tab. Select the plus sign (+). Then:
Use the Name field to specify the parameter name.
Use the Data type list to specify the type of parameter.
Use the Unit field to specify the type of unit specified by the parameter.
Use the Code field on the SQL tab to provide the text of the SQL query for the server to invoke when executing the alert. The SQL query provides the result against which to compare the threshold value. If the alert result deviates from the specified threshold value, an alert is raised.
In the query, reference parameters defined on the Parameters tab
sequentially by using the variable param_x . The x indicates
the position of the parameter definition in the parameter list. For
example, param_1 refers to the first parameter in the parameter list,
param_2 refers to the second parameter in the parameter list, and so on.
The query can also include the following variables:
Variable description |
Variable name |
|---|---|
agent identifier |
'${agent_id}' |
server identifier |
'${server_id}' |
database name |
'${database_name}' |
schema name |
'${schema_name}' |
Table |
'${object_name}' |
index |
'${object_name}' |
sequence |
'${object_name}' |
function name |
'${object_name}' |
Use the Detailed Information SQL field to provide a SQL query to invoke if the alert is triggered. The result set of the query might be displayed as part of the detailed alert information on the Alerts dashboard or Global Overview dashboard.
Note
If the specified query depends on one or more probes from different levels in the PEM hierarchy (server, database, schema, and so on), and a probe becomes disabled, any resulting alerts are displayed as follows:
- If the alert definition and the probe referenced by the query are from the same level in the PEM hierarchy, the server displays any alerts that reference the alert template on the Alert Error table of the Global Alert dashboard. - If the alert definition and the probe referenced by the query are from different levels of the PEM hierarchy, the server displays any triggered alerts that reference the alert template on the Alert Details table of the hierarchy on which the alert was defined.
To save the alert template definition and add the template name to the Alert Templates list, select Save. After saving a custom alert template, you can use the Alerting dialog box to define an alert based on the template.
Exporting or importing alert templates#
To export the alert template:
Select any alert template from the Alert Templates tab.
Select Export in the upper-right corner of the table.
Select Save File.
To generate the JSON file, select OK.
To import the Alert Template:
On the Alert Templates tab, select Import in the upper-right corner.
To select the JSON file with the code import, select Browse, and then select Import.
After selecting the file to import, you can select the following check boxes:
Skip existing - Skip the alert template if it already exists.
Skip existing dependent probe - The alert templates depend on probes. Select this check box to skip the dependent probe if it already exists.
If both the check boxes are selected and the alert template already exists, then it skips importing the alert template.
If you don’t select the Skip existing check box, select Skip dependent probe, and the alert template already exists, then the alert template imports successfully.
If both the check boxes are cleared and the alert template doesn’t exist, then it successfully imports the alert template.
Modifying or deleting an alert template#
To view the definition of an existing template (including PEM predefined alert templates), use the Show System Template list to select the type of object monitored. When you select the object type, the Alert Templates table displays the alert templates that correspond with that object type.
Select a template name in the list, and select Edit at the left end of the row to review the template definition.
Use the Alert Templates dialog box to view detailed information about the alert template:
The General tab displays general information.
The Probe Dependency tab lists the names of probes that provide data for the template.
The Parameters tab lists the names of any parameters referred to in the SQL code.
The SQL tab displays the SQL code that defines the behavior of the alert.
To delete an alert template, select the template name in the alert templates table and select Delete, located in the upper-right corner of the table. The alert history persists for the time specified in the History Retention field in the template definition.
Predefined alert templates – reference#
An alert definition contains a system-defined or user-defined set of conditions that PEM compares to the system statistics. If the statistics deviate from the boundaries specified for that statistic, the alert triggers, and the PEM client displays a warning on the Alerts Overview page and optionally sends a notification to a monitoring user.
The tables that follow list the system-defined alert templates that you can use to create an alert. This list is subject to change and can vary by system.
Templates applicable on agent#
Template name |
Description |
Probe dependency |
|---|---|---|
Load Average (1 minute) |
1-minute system load average |
load_average |
Load Average (5 minutes) |
5-minute system load average |
load_average |
Load Average (15 minutes) |
15-minute system load average |
load_average |
Load Average per CPU Core (1 minutes) |
1-minute system load average per CPU core |
load_average |
Load Average per CPU Core (5 minutes) |
5-minute system load average per CPU core |
load_average |
Load Average per CPU Core (15 minutes) |
15-minute system load average per CPU core |
load_average |
CPU utilization |
Average CPU consumption |
cpu_usage |
Number of CPUs running higher than a |
Number of CPUs running at greater than K% utilization threshold |
cpu_usage |
Free memory percentage |
Free memory as a percent of total system memory |
memory_usage |
Memory used percentage |
Percentage of memory used |
memory_usage |
Swap consumption |
Swap space consumed (in megabytes) |
memory_usage |
Swap consumption percentage |
Percentage of swap area consumed |
memory_usage |
Disk Consumption |
Disk space consumed (in megabytes) |
disk_space |
Disk consumption percentage |
Percentage of disk consumed |
disk_space |
Disk Available |
Disk space available (in megabytes) |
disk_space |
Disk busy percentage |
Percentage of disk busy |
disk_busy_info |
Most used disk percentage |
Percentage used of the most utilized disk on the system |
disk_space |
Total table bloat on host |
The total space wasted by tables on a host, in MB |
table_bloat, settings |
Highest table bloat on host |
The most space wasted by a table on a host, in MB |
table_bloat, settings |
Average table bloat on host |
The average space wasted by tables on host, in MB |
table_bloat, settings |
Table size on host |
The size of tables on host, in MB |
table_size |
Database size on host |
The size of databases on host, in MB |
database_size |
Number of ERRORS in the logfile on agent N in last X hours. |
The number of ERRORS in the logfile on agent N in last X hours |
N/A |
Number of ERRORS in the audit logfile on agent N in last X hours |
The number of ERRORS in the audit logfile on agent N in last X hours |
N/A |
Number of WARNINGS in the logfile on agent N in last X hours |
The number of WARNINGS in the logfile on agent N in last X hours |
N/A |
Number of WARNINGS in the audit logfile on agent N in last X hours |
The number of WARNINGS in the audit logfile on agent N in last X hours |
N/A |
Number of WARNINGS or ERRORS in the logfile on agent N in last X hours |
The number of WARNINGS or ERRORS in the logfile on agent N in last X hours |
N/A |
Number of WARNINGS or ERRORS in audit the logfile on agent N in last X hours |
The number of WARNINGS or ERRORS in the logfile on agent N in last X hours |
N/A |
Package version mismatch |
Check for package version mismatch as per catalog |
N/A |
Total materialized view bloat on host |
The total space wasted by materialized views on a host, in MB |
mview_bloat, settings |
Highest materialized view bloat on host |
The most space wasted by a materialized view on a host, in MB |
mview_bloat, settings |
Average materialized view bloat on host |
The average space wasted by materialized views on host, in MB |
mview_bloat, settings |
Materialized view size on host |
The size of materialized views on host, in MB |
mview_size |
Agent Down |
Specified agent is currently down |
N/A |
Templates applicable on server#
Template name |
Description |
Probe dependency |
|---|---|---|
Audit config mismatch |
Check for audit config parameter mismatch |
audit_configuration |
Average materialized view bloat in server |
The average space wasted by materialized views in server, in MB |
mview_bloat, settings |
Average table bloat in server |
The average space wasted by tables in server, in MB |
table_bloat, settings |
Buffers allocated per second |
Number of buffers allocated per second, over the last two probe cycles |
background_writer_statistics |
Buffers written per second |
Number of buffers written per second, over the last two probe cycles |
background_writer_statistics |
Committed transactions percentage |
Percentage of transactions in the server that committed vs. that rolled-back over last N minutes |
database_statistics |
Conflicting replication slots |
Check for slots that are conflicting for a particular server |
|
Connections in idle state |
Number of connections in server that are in idle state |
session_info |
Connections in idle-in-transaction state |
Number of connections in server that are in idle-in-transaction state |
session_info |
Connections in idle-in-transaction state, as percentage of max_connections |
Number of connections in server that are in idle-in-transaction state, as a percentage of maximum connections allowed on server, settings |
session_info, settings |
Database size in server |
The size of databases in server, in MB |
database_size |
Dead Tuples |
Number of estimated dead tuples in server |
table_statistics |
Dead tuples percentage |
Percentage of estimated dead tuples in server |
table_statistics |
EFM cluster failover detected |
Failover is triggered when a failover event is recorded for an EFM cluster within the specified time. |
failover_manager_node_status |
Function Count |
Total number of functions in server |
oc_function |
Highest materialized view bloat in server |
The most space wasted by a materialized view in server, in MB |
mview_bloat, settings |
Highest table bloat in server |
The most space wasted by a table in server, in MB |
table_bloat, settings |
Hot update percentage |
Percentage of hot updates in the server over last N minutes |
table_statistics |
Inactive replication slots |
Check for slots that are inactive for a particular server |
|
Index Scans |
Number of index scans in server, over last N minutes |
table_statistics |
Index size as a percentage of table size |
Size of the indexes in server, as a percentage of their tables' size |
index_size, oc_index, table_size |
InfiniteCache buffers hit percentage |
Percentage of block read requests in the server that were satisfied by InfiniteCache, over last N minutes |
database_statistics |
Largest index by table-size percentage |
Largest index in server, calculated as percentage of its table's size, oc_index, table_size |
index_size, oc_index, table_size |
Largest materialized view (by multiple of unbloated size) |
Largest materialized view in server, calculated as a multiple of its own estimated unbloated size; exclude materialized views smaller than N MB |
mview_bloat, settings |
Largest table (by multiple of unbloated size) |
Largest table in server, calculated as a multiple of its own estimated unbloated size; exclude tables smaller than N MB |
table_bloat, settings |
Last Analyze |
Hours since last analyze on the server |
table_statistics |
Last AutoAnalyze |
Hours since last autoanalyze on the server |
table_statistics |
Last AutoVacuum |
Hours since last autovacuum on the server |
table_statistics |
Last Vacuum |
Hours since last vacuum on the server |
table_statistics |
Live Tuples |
Number of estimated live tuples in server |
table_statistics |
Log config mismatch |
Check for log config parameter mismatch |
log_configuration |
Long-running autovacuums |
Number of autovacuum operations in server that have been running for more than N seconds |
session_info |
Long-running idle connections |
Number of connections in the server that have been idle for more than N seconds |
session_info |
Long-running idle connections and idle transactions |
Number of connections in the server that have been idle or transactions idle-in-transaction for more than N seconds |
session_info |
Long-running idle transactions |
Number of connections in the server that have been idle in transaction for more than N seconds |
session_info |
Long-running queries |
Number of queries in server that have been running for more than N seconds |
session_info |
Long-running transactions |
Number of transactions in server that have been running for more than N seconds |
session_info |
Long-running vacuums |
Number of vacuum operations in server that have been running for more than N seconds |
session_info |
Materialized View Count |
Total number of materialized views in server |
oc_views |
Materialized view size in server |
The size of materialized view in server, in MB |
mview_size |
Multixact ID exhaustion (wraparound) |
Check for multixact ID exhaustion (wraparound) |
|
Number of attacks detected in the last N minutes |
The number of SQL injection attacks occurred in the last N minutes |
sql_protect |
Number of attacks detected in the last N minutes by username |
The number of SQL injection attacks occurred in the last N minutes by username |
sql_protect |
Number of ERRORS in the logfile on server M in the last X hours |
The number of ERRORS in the logfile on server M in last X hours |
N/A |
Number of minutes lag of replica server from primary server |
Streaming Replication: number of minutes replica node is lagging behind the primary node |
streaming_replication_lag_time |
Number of prepared transactions |
Number of transactions in prepared state |
number_of_prepared_transactions |
Number of replica servers lag behind the primary by flush location |
Streaming Replication: number of replica servers lag behind the primary by flush location |
streaming_replication |
Number of replica servers lag behind the primary by replay location |
Streaming Replication: number of replica servers lag behind the primary by replay location |
streaming_replication |
Number of replica servers lag behind the primary by write location |
Streaming Replication: number of replica servers lag behind the primary by write location |
streaming_replication |
Number of users expiring in N days |
Number of users whose accounts are expiring in N days |
user_info |
Number of users whose password expiring in N days |
Number of users whose password have expired or are expiring in N days |
user_info |
Number of WAL archives pending |
Streaming Replication: number of WAL files pending to be replayed at replica |
wal_archive_status |
Number of WAL files |
Total number of Write Ahead Log files |
number_of_wal_files |
Number of WARNINGS in the logfile on server M in the last X hours |
The number of WARNINGS in logfile on server M in the last X hours |
N/A |
Number of WARNINGS or ERRORS in the logfile on server M in the last X hours |
The number of WARNINGS or ERRORS in the logfile on server M in the last X hours |
N/A |
Patroni cluster paused |
Patroni: Detects if the Patroni cluster is paused and unavailable for failover. |
patroni_cluster_status |
Patroni cluster failover detected |
Patroni: Failover is triggered when a failover event is recorded for a Patroni cluster within the specified time. |
patroni_node_status |
Patroni DCS not healthy |
Patroni: Detects if the distributed configuration store (etcd) is not healthy. |
patroni_cluster_status |
Patroni down or out of contact |
Patroni: Detects if the Patroni process is not reachable or has failed on a monitored node. |
patroni_cluster_status |
Patroni no leader detected |
Patroni: Detects when Patroni cluster has no leader/master node. |
patroni_cluster_status |
Patroni timeline mismatch |
Patroni: Detects if the node timeline doesn't match the cluster timeline. |
patroni_node_status, patroni_cluster_status |
Percentage of buffers written by backends |
The percentage of buffers written by backends vs. the total buffers written |
background_writer_statistics |
Percentage of buffers written by backends over the last N minutes |
The percentage of buffers written by backends vs. the total buffers backends over last N |
background_writer_statistics |
Percentage of buffers written by checkpoint |
The percentage of buffers written by the checkpoints vs. the total buffers written |
background_writer_statistics |
PGD Group Raft Consensus |
PGD group Raft consensus not working |
bdr_monitor_group_raft |
PGD Group Raft Leader ID not matching |
PGD group Raft leader ID not matching |
bdr_group_raft_details |
PGD Group versions check |
PGD/pglogical version mismatched in PGD group |
bdr_monitor_group_raft |
PGD worker error detected |
PGD worker error detected reported for PGD node |
|
Replica server lag behind the primary by flush location |
Streaming Replication: replica server lag behind the primary by flush location in MB |
streaming_replication |
Replica server lag behind the primary by replay location |
Streaming Replication: replica server lag behind the primary by replay location in MB |
streaming_replication |
Replica server lag behind the primary by size (MB) |
Streaming Replication: replica server lag behind the primary by size in MB |
streaming_replication |
Replica server lag behind the primary by WAL pages |
Streaming Replication: replica server lag behind the primary by WAL pages |
streaming_replication |
Replica server lag behind the primary by WAL segments |
Streaming Replication: replica server lag behind the primary by WAL segments |
streaming_replication |
Replica server lag behind the primary by write location |
Streaming Replication: replica server lag behind the primary by write location in MB |
streaming_replication |
Sequence Count |
Total number of sequences in server |
oc_sequence |
Sequential Scans |
Number of full table scans in server, over last N minutes |
table_statistics |
Server Down |
Specified server is currently inaccessible |
N/A |
Shared buffers hit percentage |
Percentage of block read requests in the server that were satisfied by shared buffers, over last N minutes |
database_statistics |
Table Count |
Total number of tables in server |
oc_table |
Table size in server |
The size of tables in server, in MB |
table_size |
Total connections |
Total number of connections in the server |
session_info |
Total connections as percentage of max_connections |
Total number of connections in the server as a percentage of maximum connections allowed on server, settings |
session_info, settings |
Total materialized view bloat in server |
The total space wasted by materialized views in server, in MB |
mview_bloat, settings |
Total table bloat in server |
The total space wasted by tables in server, in MB |
table_bloat, settings |
Transaction ID exhaustion (wraparound) |
Check for transaction ID exhaustion (wraparound) |
|
Tuples deleted |
Tuples deleted from server over last N minutes |
database_statistics |
Tuples fetched |
Tuples fetched from server over last N minutes |
database_statistics |
Tuples hot updated |
Tuples hot updated in server, over last N minutes |
table_statistics |
Tuples inserted |
Tuples inserted into server over last N minutes |
database_statistics |
Tuples returned |
Tuples returned from server over last N minutes |
database_statistics |
Tuples updated |
Tuples updated in server over last N minutes |
database_statistics |
Ungranted locks |
Number of ungranted locks in server |
blocked_session_info |
Unused, non-superuser connections |
Number of unused, non-superuser connections on the server, user_info, settings |
session_info, user_info, settings |
Unused, non-superuser connections as percentage of max_connections |
Number of unused, non-superuser connections on the server as a percentage of max_connections of max_connections, user_info, settings |
session_info, user_info, settings |
View Count |
Total number of views in server |
oc_views |
Templates applicable on database#
Template name |
Description |
Probe dependency |
|---|---|---|
Total table bloat in database |
The total space wasted by tables in database, in MB |
table_bloat, settings |
Largest table (by multiple of unbloated size) |
Largest table in database, calculated as a multiple of its own estimated unbloated size; exclude tables smaller than N MB |
table_bloat, settings |
Highest table bloat in database |
The most space wasted by a table in database, in MB |
table_bloat, settings |
Average table bloat in database |
The average space wasted by tables in database, in MB |
table_bloat, settings |
Table size in database |
The size of tables in database, in MB |
table_size |
Database size |
The size of the database, in MB |
database_size |
Total connections |
Total number of connections in the database |
session_info |
Total connections as percentage of max_connections |
Total number of connections in the database as a percentage of maximum connections allowed on server, settings |
session_info, settings |
Ungranted locks |
Number of ungranted locks in database |
blocked_session_info |
Connections in idle state |
Number of connections in database that are in idle state |
session_info |
Connections in idle-in-transaction state |
Number of connections in database that are in idle-in-transaction state |
session_info |
Connections in idle-in-transaction state,as percentage of max_connections |
Number of connections in database that are in idle-in-transaction state, as a percentage of maximum connections allowed on server, settings |
session_info, settings |
Long-running idle connections |
Number of connections in the database that have been idle for more than N seconds |
session_info |
Long-running idle connections and idle transactions |
Number of connections in the database that have been idle or idle-in-transaction for more than N seconds |
session_info |
Long-running idle transactions |
Number of connections in the database that have been idle in transaction for more than N seconds |
session_info |
Long-running transactions |
Number of transactions in database that have been running for more than N seconds |
session_info |
Long-running queries |
Number of queries in database that have been running for more than N seconds |
session_info |
Long-running vacuums |
Number of vacuum operations in database that have been running for more than N seconds |
session_info |
Long-running autovacuums |
Number of autovacuum operations in database that have been running for more than N seconds |
session_info |
Committed transactions percentage |
Percentage of transactions in the database that committed vs. that rolled-back over last N minutes |
database_statistics |
Shared buffers hit percentage |
Percentage of block read requests in the database that were satisfied by shared buffers, over last N minutes |
database_statistics |
InfiniteCache buffers hit percentage |
Percentage of block read requests in the database that were satisfied by InfiniteCache, over last N minutes |
database_statistics |
Tuples fetched |
Tuples fetched from database over last N minutes |
database_statistics |
Tuples returned |
Tuples returned from database over last N minutes |
database_statistics |
Tuples inserted |
Tuples inserted into database over last N minutes |
database_statistics |
Tuples updated |
Tuples updated in database over last N minutes |
database_statistics |
Tuples deleted |
Tuples deleted from database over last N minutes |
database_statistics |
Tuples hot updated |
Tuples hot updated in database, over last N minutes |
table_statistics |
Sequential Scans |
Number of full table scans in database, over last N minutes |
table_statistics |
Index Scans |
Number of index scans in database, over last N minutes |
table_statistics |
Hot update percentage |
Percentage of hot updates in the database over last N minutes |
table_statistics |
Live Tuples |
Number of estimated live tuples in database |
table_statistics |
Dead Tuples |
Number of estimated dead tuples in database |
table_statistics |
Dead tuples percentage |
Percentage of estimated dead tuples in database |
table_statistics |
Last Vacuum |
Hours since last vacuum on the database |
table_statistics |
Last AutoVacuum |
Hours since last autovacuum on the database |
table_statistics |
Last Analyze |
Hours since last analyze on the database |
table_statistics |
Last AutoAnalyze |
Hours since last autoanalyze on the database |
table_statistics |
Table Count |
Total number of tables in database |
oc_table |
Function Count |
Total number of functions in database |
oc_function |
Sequence Count |
Total number of sequences in database |
oc_sequence |
Index size as a percentage of table size |
Size of the indexes in database, as a percentage of their tables' size |
table_size |
Largest index by table-size percentage |
Largest index in database, calculated as percentage of its table's size, oc_index, table_size |
index_size, oc_index, table_size |
Database Frozen XID |
The age (in transactions before the current transaction) of the database's frozen transaction ID |
database_frozenxid |
Number of attacks detected in the last N minutes |
The number of SQL injection attacks occurred in the last N minutes |
sql_protect |
Number of attacks detected in the last N minutes by username |
The number of SQL injection attacks occurred in the last N minutes by last N minutes by username |
sql_protect |
Queries that have been cancelled due to dropped tablespaces |
Streaming Replication: number of queries that have been cancelled due to dropped tablespaces |
streaming_replication_db_conflicts |
Queries that have been cancelled due to lock timeouts |
Streaming Replication: number of queries that have been cancelled due to lock timeouts |
streaming_replication_db_conflicts |
Queries that have been cancelled due to old snapshots |
Streaming Replication: number of queries that have been cancelled due to old snapshots |
streaming_replication_db_conflicts |
Queries that have been cancelled due to pinned buffers |
Streaming Replication: number of queries that have been cancelled due to pinned buffers |
streaming_replication_db_conflicts |
Queries that have been cancelled due to deadlocks |
Streaming Replication: number of queries that have been cancelled due to deadlocks |
streaming_replication_db_conflicts |
Total events lagging in all slony clusters |
Slony Replication: total events lagging in all slony clusters |
slony_cluster |
Events lagging in one slony cluster |
Slony Replication: events lagging in one slony cluster |
slony_cluster |
Lag time (minutes) in one slony cluster |
Slony Replication: lag time (minutes) in one slony cluster |
slony_cluster |
Total rows lagging in xdb single primary replication |
xDB Replication: Total rows lagging in xdb single primary replication |
xdb_smr_mmr_replication |
Total rows lagging in xdb multi primary replication |
xDB Replication: Total rows lagging in xdb multi primary replication |
xdb_smr_mmr_replication |
Total materialized view bloat in database |
The total space wasted by materialized views in database, in MB |
mview_bloat, settings |
Largest materialized view (by multiple of unbloated size) |
Largest materialized view in database, calculated as a multiple of its estimated unbloated size; exclude materialized views smaller than N MB |
mview_bloat, settings |
Highest materialized view bloat in database |
The most space wasted by a materialized view in database, in MB |
mview_bloat, settings |
Average materialized view bloat in database |
The average space wasted by materialized views in database, in MB |
mview_bloat, settings |
Materialized view size in database |
The size of materialized view in database, in MB |
mview_size |
View Count |
Total number of views in database |
oc_views |
Materialized View Count |
Total number of materialized views in database |
oc_views |
Templates applicable on schema#
Template name |
Description |
Probe dependency |
|---|---|---|
Total table bloat in schema |
The total space wasted by tables in schema, in MB |
table_bloat, settings |
Largest table (by multiple of unbloated size) |
Largest table in schema, calculated as a multiple of its own estimated unbloated size; exclude tables smaller than N MB |
table_bloat, settings |
Highest table bloat in schema |
The most space wasted by a table in schema, in MB |
table_bloat, settings |
Average table bloat in schema |
The average space wasted by tables in schema, in MB |
table_bloat, settings |
Table size in schema |
The size of tables in schema, in MB |
table_size |
Tuples inserted |
Tuples inserted in schema over last N minutes |
table_statistics |
Tuples updated |
Tuples updated in schema over last N minutes |
table_statistics |
Tuples deleted |
Tuples deleted from schema over last N minutes |
table_statistics |
Tuples hot updated |
Tuples hot updated in schema, over last N minutes |
table_statistics |
Sequential Scans |
Number of full table scans in schema, over last N minutes |
table_statistics |
Index Scans |
Number of index scans in schema, over last N minutes |
table_statistics |
Hot update percentage |
Percentage of hot updates in the schema over last N minutes |
table_statistics |
Live Tuples |
Number of estimated live tuples in schema |
table_statistics |
Dead Tuples |
Number of estimated dead tuples in schema |
table_statistics |
Dead tuples percentage |
Percentage of estimated dead tuples in schema |
table_statistics |
Last Vacuum |
Hours since last vacuum on the schema |
table_statistics |
Last AutoVacuum |
Hours since last autovacuum on the schema |
table_statistics |
Last Analyze |
Hours since last analyze on the schema |
table_statistics |
Last AutoAnalyze |
Hours since last autoanalyze on the schema |
table_statistics |
Table Count |
Total number of tables in schema |
oc_table |
Function Count |
Total number of functions in schema |
oc_function |
Sequence Count |
Total number of sequences in schema |
oc_sequence |
Index size as a percentage of table size |
Size of the indexes in schema, as a percentage of their table's size |
table_size |
Largest index by table-size percentage |
Largest index in schema, calculated as percentage of its table's size, oc_index, table_size |
index_size, oc_index, table_size |
Materialized view bloat |
Space wasted by the materialized view, in MB |
mview_bloat, settings |
Total materialized view bloat in schema |
The total space wasted by materialized views in schema, in MB |
mview_bloat, settings |
Materialized view size as a multiple of unbloated size |
Size of the materialized view as a multiple of estimated unbloated size |
mview_bloat |
Largest materialized view (by multiple of unbloated size) |
Largest materialized view in schema, calculated as a multiple of its own estimated unbloated size; exclude materialized view smaller than N MB |
mview_bloat, settings |
Highest materialized view bloat in schema |
The most space wasted by a materialized view in schema, in MB |
mview_bloat, settings |
Average materialized view bloat in schema |
The average space wasted by materialized views in schema, in MB |
mview_bloat, settings |
Materialized view size |
The size of materialized view, in MB |
mview_size |
Materialized view size in schema |
The size of materialized views in schema, in MB |
mview_size |
View Count |
Total number of views in schema |
oc_views |
Materialized View Count |
Total number of materialized views in schema |
ov_views |
Materialized View Frozen XID |
The age (in transactions before the current transaction) of the materialized view's frozen transaction ID |
mview_frozenxid |
Templates applicable on table#
Template name |
Description |
Probe dependency |
|---|---|---|
Table bloat |
Space wasted by the table, in MB |
table_bloat, settings |
Table size |
The size of table, in MB |
table_size |
Table size as a multiple of unbloated size |
Size of the table as a multiple of estimated unbloated size |
table_bloat |
Tuples inserted |
Tuples inserted in table over last N minutes |
table_statistics |
Tuples updated |
Tuples updated in table over last N minutes |
table_statistics |
Tuples deleted |
Tuples deleted from table over last N minutes |
table_statistics |
Tuples hot updated |
Tuples hot updated in table, over last N minutes |
table_statistics |
Sequential Scans |
Number of full table scans on table, over last N minutes |
table_statistics |
Index Scans |
Number of index scans on table, over last N minutes |
table_statistics |
Hot update percentage |
Percentage of hot updates in the table over last N minutes |
table_statistics |
Live Tuples |
Number of estimated live tuples in table |
table_statistics |
Dead Tuples |
Number of estimated dead tuples in table |
table_statistics |
Dead tuples percentage |
Percentage of estimated dead tuples in table |
table_statistics |
Last Vacuum |
Hours since last vacuum on the table |
table_statistics |
Last AutoVacuum |
Hours since last autovacuum on the table |
table_statistics |
Last Analyze |
Hours since last analyze on the table |
table_statistics |
Last AutoAnalyze |
Hours since last autoanalyze on the table |
table_statistics |
Row Count |
Estimated number of rows in a table |
table_statistics |
Index size as a percentage of table size |
Size of the indexes on table, as a percentage of table's size |
table_size |
Table Frozen XID |
The age (in transactions before the current transaction) of the table's frozen transaction ID |
table_frozenxid |
Global templates#
Template name |
Description |
Probe dependency |
|---|---|---|
Agents Down |
Number of agents that haven't reported in recently |
N/A |
Servers Down |
Number of servers that are currently inaccessible |
N/A |
Alert Errors |
Number of alerts in an error state |
N/A |
Audit log alerting#
PEM provides alert templates that let you use the Alerting dialog to
create an alert that triggers when an ERROR or WARNING statement
is written to a log file for a specific server or agent. To open the
Alerting dialog, select the server or agent in the PEM client Object
browser tree control, and select Management > Alerting.
To create an alert to notify you of error or warning messages in the log file for a specific server, create an alert that uses one of the following alert templates:
Number of ERRORS in the logfile on server M in last X hours
Number of WARNINGS in the logfile on server M in last X hours
Number of ERRORS or WARNINGS in the logfile on server M in last X hours
To create an alert to notify you of error or warning messages for a specific agent, create an alert that uses one of the following alert templates. This functionality is supported only on EDB Postgres Advanced Server.
Number of ERRORS in the logfile on agent M in last X hours
Number of WARNINGS in the logfile on agent M in last X hours
Number of ERRORS or WARNINGS in the logfile on agent M in last X hours
Defining a new alert#
Use the PEM client Manage Alerts tab to define, copy, or manage alerts. To open the Manage Alerts tab, select Management > Manage Alerts.
The Manage Alerts tab displays a table of alerts that are defined on the object currently selected in the PEM client tree. You can use the Alerts table to modify an existing alert or to create a new alert.
The Manage Alerts tab#
To open the alert editor and create an alert, select the plus sign (+) in the upper-right of the table. The editor opens.
Use the fields on the General tab to provide information about the alert:
Enter the name of the alert in the Name field.
Use the Template list to select a template for the alert. An alert template is a function that uses one or more metrics or parameters to generate a value to which PEM compares user-specified alert boundaries. If the value returned by the template function evaluates to a value that’s within the boundary of a user-defined alert as specified by the Operator and Threshold values fields, PEM:
Raises an alert
Adds a notice to the Alerts overview display
Performs any actions specified on the template
Use the Enable? switch to specify if the alert is enabled (Yes) or disabled (No).
Use the Interval box to specify how often the alert confirms if the alert conditions are satisfied. Use the Minutes selector to specify an interval value. Use the Default switch to set or reset the Minutes value to the default (recommended) value for the selected template.
Use the History retention box to specify the number of days that PEM stores data collected by the alert. Use the Days selector to specify the number of days to store the data. Use the Default switch to set or reset the Days value to the default value (30 days).
Use controls in the Threshold values box to define the triggering criteria for the alert. When the value specified in the Threshold values fields evaluates to greater than or less than the system value (as specified with the Operator), PEM raises a Low, Medium or High alert level.
Use the Operator list to select the operator for PEM to use when evaluating the current system values:
Select a greater-than sign (>) to trigger the alert when the system values are greater than the values entered in the Threshold values fields.
Select a less-than sign (<) to trigger the alert when the system values are less than the values entered in the Threshold values fields.
Use the Threshold fields to specify the values for PEM to compare to the system values to determine whether to raise an alert. You must specify values for all three thresholds (Low, Medium, and High).
The Parameter Options table contains a list of parameters that are required by the selected template. The table displays both predefined parameters and parameters for which you must specify a value. You must specify a value for any parameter that displays a prompt in the Value column.
PEM can send a notification or execute a script if an alert is triggered or if an alert is cleared. Use the Notification tab to specify how PEM behaves if an alert is raised.
Use the Email notification box to specify the email group to receive an email notification if the alert is triggered at the specified level. Use the Creating an email group tab to create an email group that contains the address of the users to notify when an alert is triggered. To access the Email Groups tab, select Email Groups located in the Quick Links menu of the Manage Alerts tab.
To instruct PEM to send an email when a specific alert level is reached, set the slider next to an alert level to Yes. Use the list to select the predefined user or group to notify.
You must configure the PEM server to use an SMTP server to deliver email before PEM can send email notifications.
Use the Webhook notification box to specify one or multiple endpoints if the alert is triggered at the specified level. Use the Webhook to create a webhook endpoint to receive the notifications when an alert is triggered. To access the Webhooks tab, select Webhooks located in the Quick Links menu of the Manage Alerts tab.
Set Enable? to Yes to send the alert notifictions to the webhook endpoint.
Set Override default configuration? to Yes to set the customized alert levels as per the requirement. Once it’s set to Yes, all the alert levels are enabled to configure.
Use the list to select a predefined endpoint to send a notification to for Low alerts?, Medium alerts?, High alerts?, and Cleared alerts?.
Use the Trap notification options to configure trap notifications for this alert:
Set Send trap to Yes to send SNMP trap notifications when the state of this alert changes.
Set SNMP Ver to v1, v2, or v3 to identify the SNMP version.
Use the Low alert, Med alert, and High alert sliders to select the levels of alert to trigger the trap. For example, if you set the slider next to High alert to Yes, PEM sends a notification when an alert with a high-severity level is triggered.
You must configure the PEM server to send notifications to an SNMP trap/notification receiver before notifications can be sent. For sending SNMP v3 traps, the PEM agent uses ‘User Security Model(USM)’, which is in charge of authenticating, encrypting, and decrypting SNMP packets.
While sending SNMP v3 traps, the agent creates the snmp_boot_counter
file. This file is created in the location mentioned by the
batch_script_dir parameter in agent.cfg . If this parameter
isn’t configured or if the directory isn’t accessible due to
authentication restrictions, then the file is created in the operating
system temporary directory. If that’s also not possible, then the file
is created in your home directory.
Use the Nagios notification box to instruct the PEM server to notify Nagios network-alerting software when the alert is triggered or cleared. For more details, see Using PEM with Nagios
Set the Submit passive service check result to Nagios switch to Yes to notify Nagios when the alert is triggered or cleared.
Use the Script execution box to optionally define a script that executes if an alert is triggered and to specify details about the script execution.
Set the Execute script slider to Yes to instruct PEM to execute the provided script if an alert is triggered.
Set the Execute on alert cleared slider to Yes to instruct PEM to execute the provided script when the situation that triggered the alert is resolved.
Use the Execute script on options to indicate for the script to execute on the PEM server or the monitored server.
In the Code field, provide the script for PEM to execute. You can provide a batch/shell script. In the script, you can use placeholders for the following:
%AlertName% - The name of the triggered alert.
%ObjectName% - The name of the server or agent on which the alert
was triggered.
%ThresholdValue% - The threshold value reached by the metric when
the alert triggered.
%CurrentValue% - The current value of the metric that triggered the
alert.
%CurrentState% - The current state of the alert.
%OldState% - The previous state of the alert.
%AlertRaisedTime% - The time that the alert was raised or the most
recent time that the alert state was changed.
To invoke a script on a Linux system, you must modify the entry for the
batch_script_user parameter of the agent.cfg file and specify
the user to use to run the script. You can either specify a non-root
user or root for this parameter. If you don’t specify a user or the
specified user doesn’t exist, then the script doesn’t execute. Restart
the agent after modifying the file.
To invoke a script on a Windows system, set the registry entry for
AllowBatchJobSteps to true and restart the PEM agent. PEM registry
entries are located in
HKEY_LOCAL_MACHINE\Software\EnterpriseDB\PEM\agent .
After you define the alert attributes, select Edit to close the alert definition editor and then Save in the upper-right corner of the Alerts table.
To discard your changes, select Refresh. A message prompts you to confirm that you want to discard the changes.
Note
Suppose you need to use the alert configuration placeholder values in an external script. You can do so either by passing them as the command-line arguments or exporting them as environment variables. The external script must have proper execution permissions.
You can run the script with any of the placeholders as command-line arguments.
For example:
#!/bin/bash

bash <path_to_script>/script.sh "%AlertName%  %AlertLevel% %AlertDetails%"
You can define the environment variables for any of the placeholders and then use those environment variables in the script.
For example:
#!/bin/bash

export AlertName=%AlertName%
export AlertState=%AlertState%

bash <path_to_script>/script.sh
Modifying an alert#
Use the Alerts table to manage an existing alert or create a new alert. Select an object in the PEM client tree to view the alerts that monitor that object.
You can modify some properties of an alert in the Alerts table:
The Alert name column displays the name of the alert. To change the alert name, replace the name in the table and select Save.
The Alert template column displays the name of the alert template that specifies properties used by the alert. You can use the list to change the alert template associated with an alert.
Use the Alert enable? switch to specify if an alert is enabled (Yes) or disabled (No).
Use the Interval column to specify how often PEM checks whether the alert conditions are satisfied. Set the Default switch to No and specify an alternate value, in minutes. Or set the Default switch to Yes to reset the value to its default setting. By default, PEM checks the status of each alert once every minute.
Use the History retention field to specify the number of days that PEM stores data collected by the alert. Set the Default switch to No and specify an alternative value in days. Or set the Default switch to Yes to reset the value to its default setting. By default, PEM stores historical data for 30 days.
After modifying an alert, select Save (located in the upper-right corner of the table) to preserve your changes.
To modify other alert attributes, select Edit to the left of an alert name to open an editor. The editor provides access to the complete alert definition.
Use the Alert Details dialog box to modify the definition of the selected alert. After you modify the alert definition, select Save.
Deleting an alert#
To mark an alert for deletion, select the alert name in the Alerts table. Then select Delete to the left of the name. The alert remains in the list in red strike-through font.
Delete is a toggle. You can undo the deletion by selecting it a second time. To permanenetly dete the alert defintion, select Save.
Copying an alert#
To speed up the deployment of alerts in the PEM system, you can copy alert definitions from one object to one or more target objects.
To copy alerts from an object, select the object in the PEM client tree on the main PEM window. Then, select Management > Copy Alerts. On the Manage Alerts tab, from the Quick Links toolbar, select Copy Alerts.
The Copy Alert Configuration dialog box copies all alerts from the object selected in the PEM client tree to the objects selected on the dialog box. Expand the tree to select nodes to specify as the target objects. The tree displays a red warning indicator next to the source object.
To copy alerts to multiple objects at once, select a parent node of the targets. For example, to copy the alerts from one table to all tables in a schema, select the check box next to the schema. PEM copies alerts only to targets that are the same type as the source object.
Select Ignore duplicates to prevent PEM from updating any existing alerts on the target objects with the same name as those being copied.
Select Replace duplicates to replace existing alerts with alerts of the same name from the source object.
Select Delete Existing Alerts to delete all the alerts from the target object and copy all the alerts from the source object to the target object.
Select Configure Alerts to copy the alerts from the source object to all objects of the same type in or under those objects selected on the Copy Alert Configuration dialog box.
Schedule an alert blackout#
You can use the Management > Schedule Alert Blackout to schedule an alert blackout for your Postgres servers and PEM agents during maintenance. Alerts aren’t raised during a defined blackout period.
To schedule an alert blackout, select Management > Schedule Alert Blackout.
In the Schedule Alert Blackout dialog box, use the tabs to define the blackout period for servers and agents. On the Server tab, to add a row, select the plus sign (+) at the top-right corner.
Use the Server tab to provide information about an alert blackout period. After you save the blackout period, you can’t edit it.
Use the Start time field to provide the date and time to start the alert blackout.
Use the Duration field to provide the interval for which you want to black out the alerts.
Use the Servers field to provide the server name for which you want to black out the alerts. You can also select multiple servers to black out the alerts for all of those servers.
After providing details, select Save. The alerts don’t appear on the Alerts dashboard for the scheduled interval of that server.
You can also schedule a blackout period for PEM agents using the Agent tab on the dialog box. To add a row, on the Agent tab, select the plus sign (+) at the top-right corner.
Use the Agent tab to provide the information about an alert blackout period. After you save the blackout period, you can’t edit it.
Use the Start time field to provide the date and time to start the alert blackout.
Use the Duration field to provide the interval for which you want to black out the alerts.
Use the Agents field to provide the agent name for which you want to black out the alerts. All server-level alerts for the servers bound to that agent black out.
After providing details, save the details by selecting Save. The alerts aren’t displayed on the Alert dashboard for the scheduled interval for that PEM agent.
You can select Clone from the top-right corner of the dialog box to clone the scheduling of an alert blackout. To create the cloned copy of all the selected servers or agents, select the servers or agents you want to clone, and then select Clone. You can edit newly created schedules as needed, and then select Save.
Select Delete from the top-right corner of the dialog box to remove a scheduled alert blackout. Select the servers or agents and then select Delete.
Select a server for which you want to delete the scheduled alert blackout, and then select Delete. The server prompts for confirmation before deleting that row.
You can select Reset to reset the details on the Alert Blackout dialog box to the default settings. Saved blackouts aren’t affected.
You can view the scheduled alert blackout details from the
event_history table in the pem schema once the schedule is
executed. For more information, see Monitoring event history .