
Accessing the web interface#
After installing a PEM server and agent, you can configure PEM to start monitoring and managing PostgreSQL or EDB Postgres Advanced Server instances. The PEM server installer installs the PEM web interface. You can use the interface to review information about objects that reside on monitored servers or to review statistical information gathered by the PEM server.
After the server installation completes, you can open the PEM interface in your choice of browser by navigating to:
https://<ip_address_of_PEM_host>:8443/pem
ip_address_of_PEM_host specifies the IP address of the host of the
PEM server.
Use the fields on the Postgres Enterprise Manager Login window to authenticate yourself with the PEM server:
Provide the name of a pem database user in the Username field. For the first user connecting, this is the name provided when installing the PEM server.
Provide the password associated with the user in the Password field.
After providing your credentials, select Login to connect to PEM.
The PEM web interface opens, displaying the Global Overview dashboard.
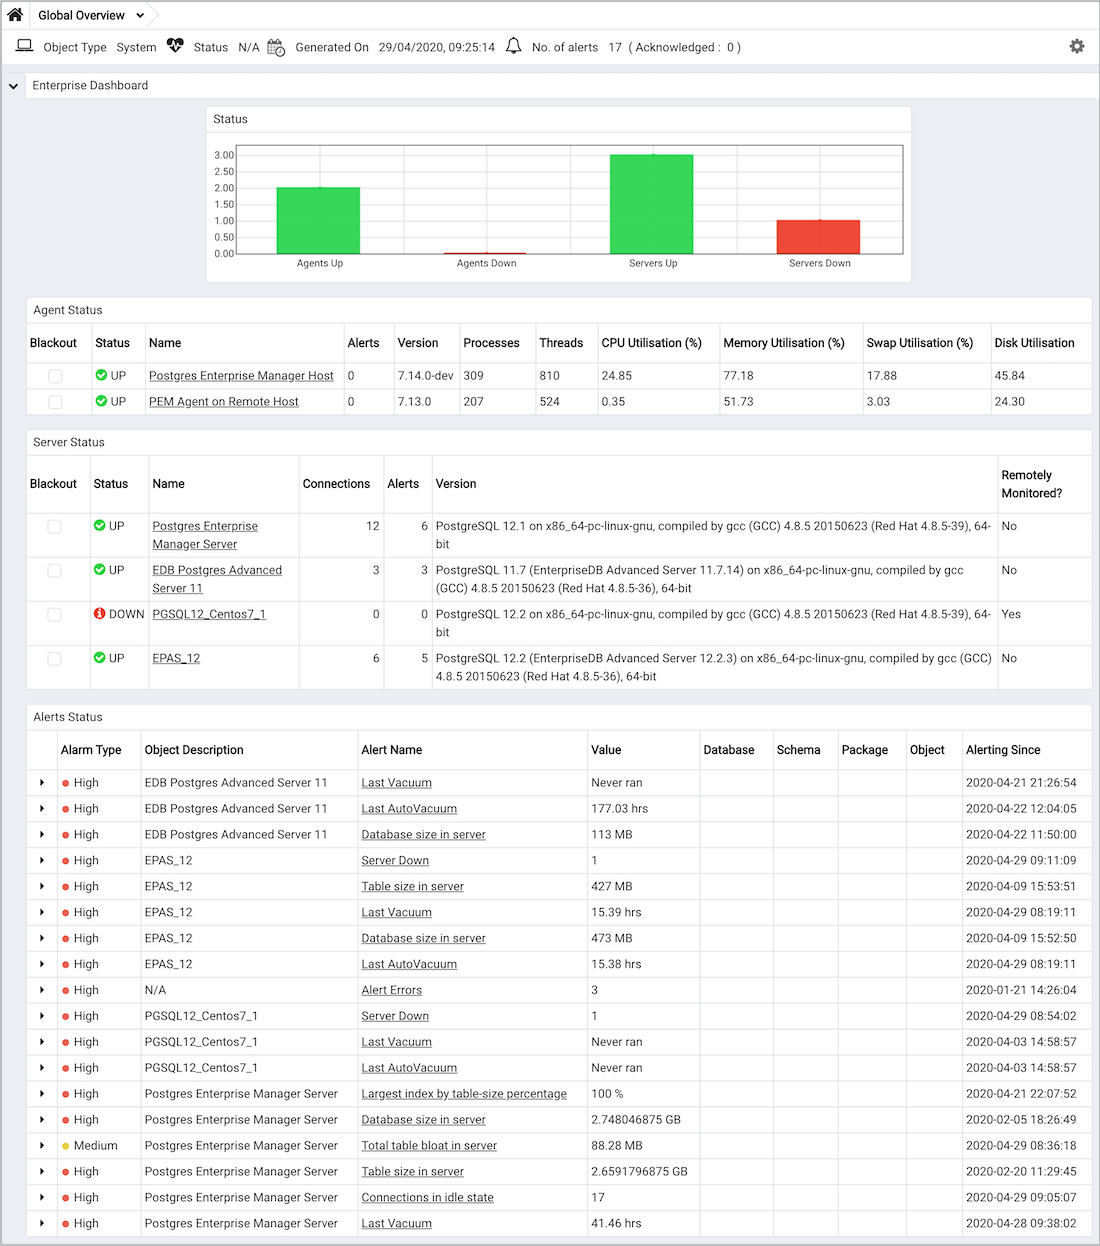
The Global Overview Dashboard#
The Browser pane displays a tree that provides access to information about the database objects that reside on each server. The tree expands to display a hierarchical view of the servers and objects that the PEM server monitors.
Before you can use the PEM web interface to manage or monitor a database server, you must register that server with the PEM server. When you register a server, you describe the connection to the server, provide authentication information for the connection, and specify any management preferences (optionally binding an agent).
A server can be managed or unmanaged:
A managed server is bound to a PEM agent. The PEM agent monitors the server to which it’s bound and performs tasks or reports statistics for display on the PEM dashboards. A managed server has access to extended PEM functionality such as custom alerting. When registering a server, you can also allow PEM to restart a managed server as required.
An unmanaged server isn’t bound to a PEM agent. You can create database objects on an unmanaged server, but extended PEM functionality (such as custom alerting) isn’t supported on an unmanaged server.
You must also ensure the pg_hba.conf file of the server that you’re
registering allows connections from the host of the PEM web interface.
PEM client object browser#
The Browser tree control provides access to information and management options for the database objects that reside on each server. The tree control expands to display a hierarchical view of the servers and objects that are monitored by the PEM server. You can use context menu options, accessed by right-clicking nodes of the tree control, to create new objects and modify and delete existing objects if your role holds the required privileges.
Expand nodes in the tree control to display a hierarchical view of the database objects that reside on a selected server:
Use the plus sign (+) to the left of a node to expand a segment of the tree control.
Use the minus sign (-) to the left of a node to close that node.
Context menu options can include one or more of the following selections:
Option |
Action |
|---|---|
Add named restore point |
Create and enter the name of a restore point. |
Backup |
Open the Tools menu dialog box to back up database objects. |
Backup Globals |
Open the Tools menu dialog box to back up cluster objects. |
Backup Server |
Open the Tools menu dialog box to back up a server. |
Connect Server |
Establish a connection with the selected server. |
Create |
Access a context menu that provides context-sensitive selections. Your selection opens a Create dialog box for creating a new object. |
CREATE Script |
Open the Query information to edit or view the CREATE script. |
Dashboards |
Select for quick access to PEM dashboards. |
Delete/Drop |
Delete the currently selected object from the server. |
Disconnect Database |
Terminate a database connection. |
Disconnect Server |
Refresh the currently selected object. |
Drop Cascade |
Delete the currently selected object and all dependent objects from the server. |
Debugging |
Access the Debugger tool. |
Grant Wizard |
Access the Tools menu tool. |
Maintenance |
Open the Management menu dialog box to VACUUM, ANALYZE, REINDEX, or CLUSTER. |
Management |
Access management tasks that are relevant to the node. |
Properties |
Review or modify the currently selected object's properties. |
Refresh |
Refresh the currently selected object. |
Reload Configuration |
Update configuration files without restarting the server. |
Restore |
Access the Tools menu dialog box to restore database files from a backup. |
View Data |
Use the View Data option to access the data stored in a selected table with the Data Output tab of the Query tool. |
The context-sensitive menus associated with Tables and nested Table nodes provides additional display options.
Option |
Action |
|---|---|
Import/Export |
Open the Import/Export dialog box to import data to or export data from the selected table. |
Reset Statistics |
Reset statistics for the selected table. |
Scripts |
Open the Query information to edit or view the selected script from the flyout menu. |
Truncate |
Remove all rows from a table. |
Truncate Cascade |
Remove all rows from a table and its child tables. |
View First 100 Rows |
Access the data grid that displays the first 100 rows of the selected table. |
View Last 100 Rows |
Access the data grid that displays the last 100 rows of the selected table. |
View All Rows |
Access the data grid that displays all rows of the selected table. |
View Filtered Rows |
Access the Data Filter popup to apply a filter to a set of data. |
PEM tabbed browser window#
The main panel of the PEM client contains a collection of tabs that display information about the object currently selected in the tree control.
The Dashboard tab is context sensitive. When you navigate to the Dashboard tab from a server group or the PEM Agents node, the EDB Postgres Welcome window opens, where you can:
Select the Add New Server icon to open the Manually registering a database server to define a connection to a server.
Select the Configure PEM icon to open the Editing the PEM server configuration and modify server parameters.
Select the Getting Started icon to open a new tab, displaying the PEM Getting Started section at the EnterpriseDB website.
Select the EDB Website icon to navigate to the home page of the EnterpriseDB website. The EnterpriseDB website features news about upcoming events and other projects.
Select the PostgreSQL Website icon to navigate to the PostgreSQL project website. The PostgreSQL site features news about recent releases and other project information.
Select the EDB Blogs icon to navigate to the EDB Blog page, where you can review the most-recent employee posts to Postgres related blogs.
Select the name of an agent or server and navigate to the Dashboard tab to review session or server activity for the currently selected object.
When opened from the name of an agent or server, the Dashboard tab provides a graphical analysis of usage statistics:
The Server sessions or Database sessions graph displays the interactions with the server or database.
The Transactions per second graph displays the commits, rollbacks, and total transactions per second that are taking place on the server or database.
The Tuples In graph displays the number of tuples inserted, updated, and deleted on the server or database.
The Tuples Out graph displays the number of tuples fetched and returned from the server or database.
The Block I/O graph displays the number of blocks read from the file system or fetched from the buffer cache (but not the operating system’s file system cache) for the server or database.
The Server activity tabbed panel displays tables that contain session information, session locks, prepared transactions, and configuration.
Navigate to the Properties tab to review the properties of the item currently selected in the tree control.
The SQL tab displays the SQL code used to generate the object currently selected in the Browser tree control.
The Statistics tab displays the statistics gathered for each object on the tree control. The statistics displayed in the table vary by the type of object that’s highlighted. Select a column heading to sort the table by the data displayed in the column. Select it again to reverse the sort order. The following table lists some of the statistics that might be displayed.
Panel |
Description |
|---|---|
PID |
The process ID associated with the row. |
User |
The name of the user that owns the object. |
Database |
The database name. |
Backends |
The number of current connections to the database. |
Backend start |
The start time of the backend process. |
Xact Committed |
The number of transactions committed to the database in the last week. |
Xact Rolled Back |
The number of transactions rolled back in the last week. |
Blocks Read |
The number of blocks read from memory in the last week, in MB. |
Blocks Hit |
The number of blocks hit in the cache in the last week, in MB. |
Tuples Returned |
The number of tuples returned in the last week. |
Tuples Fetched |
The number of tuples fetched in the last week. |
Tuples Inserted |
The number of tuples inserted into the database in the last week. |
Tuples Updated |
The number of tuples updated in the database in the last week. |
Tuples Deleted |
The number of tuples deleted from the database in the last week. |
Last statistics reset |
The time of the last statistics reset for the database. |
Tablespace conflicts |
The number of queries canceled because of recovery conflict with dropped tablespaces in database. |
Lock conflicts |
The number of queries canceled because of recovery conflict with locks in database. |
Snapshot conflicts |
The number of queries canceled because of recovery conflict with old snapshots in database. |
Bufferpin conflicts |
The number of queries canceled because of recovery conflict with pinned buffers in database. |
Temporary files |
The total number of temporary files, including those used by the statistics collector. |
Size of temporary files |
The size of the temporary files. |
Deadlocks |
The number of queries canceled because of a recovery conflict with deadlocks in database. |
Block read time |
The number of milliseconds required to read the blocks read. |
Block write time |
The number of milliseconds required to write the blocks read. |
Size |
The size of the selected database, in MB. |
The Dependencies tab displays the objects on which the currently
selected object depends. To ensure the integrity of the database
structure, the server makes sure that you don’t accidentally drop
objects that other objects depend on. You must use DROP CASCADE to
remove an object on which another object depends.
The Dependencies table displays:
The Type field, which specifies the parent object type.
The Name field, which specifies the identifying name of the parent object.
The Restriction field, which describes the dependency relationship between the currently selected object and the parent.
The Dependents tab displays a table of objects that depend on the object currently selected in the Browser tree. A dependent object can be dropped without affecting the object currently selected in the Browser tree control.
The Type field specifies the dependent object type.
The Name field specifies the identifying name for the dependent object.
The Restriction field describes the dependency relationship between the currently selected object and the parent.
Navigate to the Monitoring tab to access information presented on Dashboards . Dashboards display statistical information about the objects monitored by the PEM server.
PEM opens additional tabs when you access PEM functionality through the Management or Tools dialog boxes. Right-click the current tab and select from a context menu that allows you to customize the display for your working style:
Select Remove Panel to remove the currently selected panel.
Select Rename Panel to rename the currently selected panel.
Select Detach Panel to detach the currently selected panel, repositioning it for convenience.
Select Add Panel and select any of the available options to add to the panels.
The PEM client preserves any adjustments when you exit the program. To reset the PEM client to its original format, select File > Reset Layout.
Using chart, graph, and table controls#
Use the icons in the upper-right corner of each graphic on a PEM client dashboard to control, download, and customize the charts, graphs, and tables displayed in the PEM client.
Use the Refresh icon  to display the most recent content
available from the PEM probes.
to display the most recent content
available from the PEM probes.
Select the Download icon  to download a .jpeg or .png
image of the chart or graph. By default, the file is in .jpeg format. To
save the file as a .png, use the Personalize icon to modify the
download format.
to download a .jpeg or .png
image of the chart or graph. By default, the file is in .jpeg format. To
save the file as a .png, use the Personalize icon to modify the
download format.
Select the Fullscreen icon  to expand the chart or graph
to fill the main pane of the PEM client.
to expand the chart or graph
to fill the main pane of the PEM client.
Select the Personalize  icon to modify the display
properties of the chart or graph for your session only.
icon to modify the display
properties of the chart or graph for your session only.
Use the Information  icon to access information about the
chart or graph.
icon to access information about the
chart or graph.
Personalizing a graphic#
When you select the Personalize icon, the Personalize chart configuration dialog box opens.
Use controls on the Personalize chart configuration dialog box to modify the properties of the graphic:
Use the Auto Refresh control to increase or decrease the number of seconds between refreshes.
Use the Auto Refresh field to specify the number of seconds between updates of the data displayed in the table or chart.
If applicable, use the Download as field to indicate if you want to download a chart as a .jpeg image or a .png image.
If applicable, use the Colors selectors to specify the display colors to use on a chart.
If applicable, set the Show Acknowledged Alerts switch to Yes to indicate that you want the table to display alerts that you have acknowledged with a check box in the Ack’ed column. Set the field to No to indicate for the table to hide any acknowledged alerts. Acknowledged alerts aren’t purged from the table content until the time specified in the alert definition passes.
After personalizing the display properties, use the controls in the upper-right hand corner to apply your changes:
Use the Delete icon to reset the properties of the graphic to their default settings. Use the menu to specify whether to apply the change to only this instance of the graphic or to the same graphic when displayed on other dashboards.
Use the Save icon to save your changes to the properties for the graphic. Use the menu to specify to apply the change to only this instance of the graphic or to the same graphic when displayed on other dashboards.
Browser toolbar#
The browser toolbar provides shortcuts for frequently used features, like View Data and the Query tool. This toolbar is visible on the Browser panel. Buttons get enabled/disabled based on the selected browser node.
Use the Query tool button to open the Query tool in the current database context.
Use the View Data button to view/edit the data stored in a selected table.
Use the Filtered Rows button to access the Data Filter popup to apply a filter to a set of data for viewing/editing.
Controlling and customizing charts, graphs, and tables#
Use the icons in the upper-right corner of each graphic on a dashboard to control and customize the charts, graphs, and tables displayed in the PEM client for your current user session.
The following table gives the information about icons.
Icons |
Information |
|---|---|
! icon6 |
View information about the chart, graph, or table. |
! icon1 |
Refresh the content of a chart, graph, or table. |
! icon3 |
Personalize the chart, graph, or table settings for the current user. |
! icon4 |
Download an image of the chart or graph. |
! icon5 |
View the legends that are used in the chart, graph, or table. |
! icon2 |
Expand the chart or graph to full-screen. |